Australia Gift Card Market Overview:
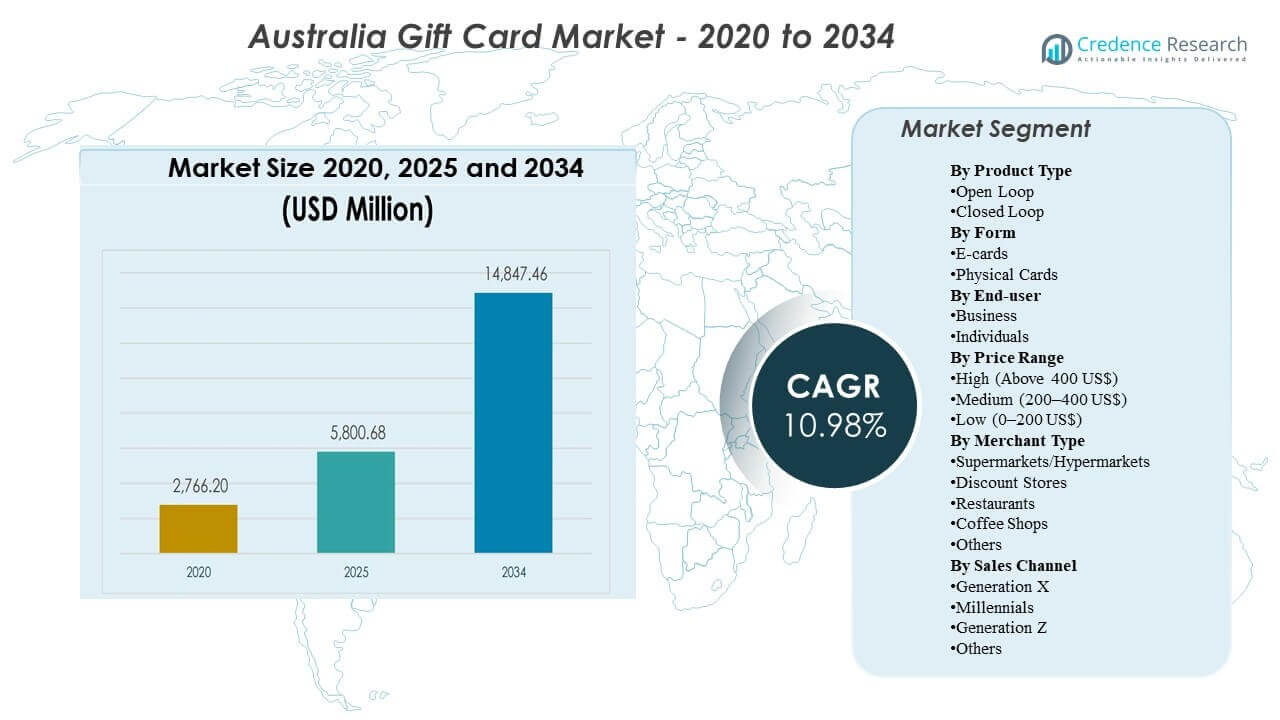
The Australia Gift Card Market was valued at USD 2766.2 million in 2020, reached USD 5800.68 million in 2025, and is projected to expand to USD 14847.46 million by 2034, registering a CAGR of 10.98% during 2025–2034. Expansion is primarily driven by the shift toward digital gifting and broader use of gift cards as payment-like instruments for everyday spending, incentives, and controlled-budget gifting. Adoption is further supported by growing omnichannel distribution across retailer apps, e-commerce checkouts, and physical racks in high-traffic stores.
| REPORT ATTRIBUTE |
DETAILS |
| Historical Period |
2020-2023 |
| Base Year |
2024 |
| Forecast Period |
2025-2034 |
| Australia Gift Card Market Size 2025 |
USD 5800.68 million |
| Australia Gift Card Market, CAGR |
10.98% |
| Australia Gift Card Market Size 2032 |
USD 14847.46 million |
Key Market Trends & Insights
- The market expands from USD 5800.68 million (2025) to USD 14847.46 million (2034), indicating sustained scale-up over the forecast period.
- Market growth from 2025 to 2034 is supported by a 10.98% CAGR, reflecting stronger demand across both consumer gifting and business-led incentive use cases.
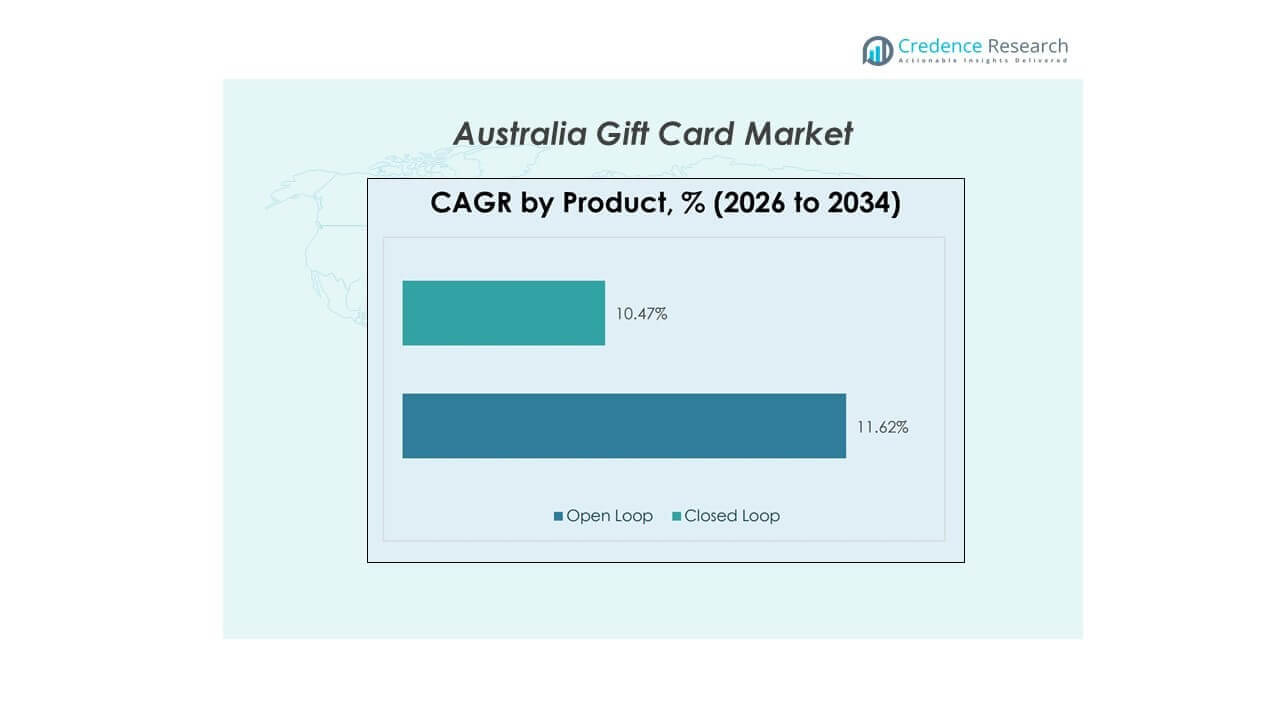
- Open Loop gift cards are expected to grow faster at 11.62% CAGR (2026–2034) versus Closed Loop at 10.47% CAGR (2026–2034), highlighting a rising preference for broader acceptance and flexibility.
- New South Wales accounts for 31.1% of Australia demand in 2025, with Victoria at 25.9% and Queensland at 20.1%, showing demand concentration in the largest population and retail hubs.
- Western Australia holds 11.3% share in 2025, while the Rest of Australia contributes 11.6%, indicating meaningful regional demand outside the eastern corridor.
Segment Analysis
Australia Gift Card Market demand is increasingly shaped by convenience-led purchasing and faster fulfillment, which improves adoption for both planned and last-minute gifting occasions. Digital delivery also supports corporate distribution at scale, enabling organizations to deploy rewards and incentives with lower operational friction and clearer value control. Retailers and platforms compete by improving discovery, personalization, and redemption experiences across mobile, web, and in-store touchpoints. Fraud controls, balance visibility, and simplified checkout flows are becoming more important as gift cards move closer to everyday payments behavior.
Growth also reflects a broader shift toward flexible spending formats that help recipients choose across categories rather than being restricted to a single brand. This preference supports stronger momentum in open-loop formats and multi-merchant ecosystems, especially as consumers adopt wallet-based storage and app-centric shopping habits. Merchant-funded promotions, loyalty integrations, and seasonal campaigns continue to influence purchase peaks and channel mix. Within Australia, demand remains concentrated in the largest states where retail density, e-commerce penetration, and business activity are highest.
By Product Type Insights
Open Loop gift cards are positioned as the fastest-growing product category, supported by an 11.62% CAGR from 2026 to 2034, compared with 10.47% for Closed Loop gift cards over the same period. Open Loop formats benefit from wider acceptance, which aligns with “gift of choice” positioning and reduces the risk of non-redemption due to limited merchant relevance. Corporate and incentive programs also tend to favor broader usability, which increases the appeal of open-loop products for rewards, reimbursements, and controlled-spend use cases. Closed Loop cards remain important for retailers because they can drive repeat store visits and support loyalty outcomes, but growth is relatively slower due to narrower acceptance and higher substitution risk from multi-brand options.
By Form Insights
Form leadership was not specified in the available inputs, but demand is shifting toward digital issuance as consumers prioritize instant delivery, personalization, and ease of storage in mobile wallets and retailer apps. E-cards strengthen last-minute gifting suitability, reduce inventory and logistics constraints, and improve corporate distribution efficiency for multi-site workforces. Physical cards remain relevant for in-store impulse purchases and traditional gifting occasions, supported by rack visibility in high-traffic retail locations. Ongoing product innovation is increasingly focused on improving digital purchase flows and reducing friction at redemption.
Access crucial information at unmatched prices!
Request your sample report today & start making informed decisions powered by Credence Research Inc.!
Download Sample
By End-user Insights
End-user leadership was not specified in the available inputs, but market expansion is supported by both consumer gifting and business-led incentive demand. Business use cases typically emphasize budget control, standardized fulfillment, and the ability to deploy rewards quickly across employees, customers, or partners. Individual buyers continue to use gift cards for birthdays, seasonal gifting, and convenience-led “safe choice” purchases, particularly when recipient preferences are uncertain. Over time, the balance between business and individual demand is likely to be shaped by corporate program growth, macroeconomic conditions, and promotion intensity.
By Price Range Insights
Price-range leadership was not specified in the available inputs, but market dynamics typically reflect a mix of low-value cards for impulse and everyday gifting, mid-tier cards for mainstream occasions, and high-value cards for corporate awards or premium categories. Inflation and household budgeting behavior can shift the mix toward lower and mid values, while corporate programs and milestone gifting can increase demand for higher denominations. Retail promotions, loyalty offers, and bundle mechanics can also influence denomination preferences during peak seasons. Purchase channel matters because online flows can support higher-value purchases through personalization and delivery convenience, while in-store racks often support faster low-to-mid value decisions.
By Merchant Type Insights
Merchant-type leadership was not specified in the available inputs, but supermarkets and hypermarkets typically play an important role in discovery and impulse purchases due to high footfall and checkout adjacency. Discount stores capture value-led gifting behavior and can benefit during periods of consumer budget sensitivity. Restaurants and coffee shops benefit from experiential gifting and social occasions, where spend is linked to shared experiences rather than tangible goods. The “Others” category continues to expand as digital marketplaces and multi-brand platforms widen access to entertainment, gaming, mobility, and subscription-based gifting.
By Sales Channel Insights
Sales-channel leadership by generation was not specified in the available inputs, but cohort behavior tends to differ by purchase timing and preferred format. Millennials and Generation Z often show higher comfort with digital delivery, app-based discovery, and wallet storage, which supports faster adoption of e-cards and open-loop formats. Generation X may maintain a higher mix of planned purchases and may still rely on physical cards in traditional retail settings for convenience. The “Others” cohort includes older buyers and niche segments where preferences can vary by access to digital payment tools and comfort with online gifting.
Australia Gift Card Market Drivers
Expansion of digital gifting and frictionless fulfillment
Digital delivery reduces the time and effort required to purchase and send gift cards, improving suitability for both planned and last-minute gifting. E-commerce and app-based flows simplify discovery, enable personalization, and reduce physical inventory requirements. Faster fulfillment also supports corporate programs that need to distribute incentives quickly across multiple locations. As digital storage becomes more common, balance visibility and redemption convenience further reinforce repeat use.
Corporate rewards and incentive programs at scale
Businesses use gift cards as controlled-budget tools for employee recognition, customer retention, and partner incentives. Programmatic distribution reduces administrative burden and supports rapid deployment for campaigns and milestones. Gift cards can also provide flexibility compared with physical goods, while still allowing organizations to set value limits. This driver supports stable demand that is less seasonal than consumer gifting.
- For instance, Reward Gateway states that it supports more than 10 million employees and 6,000+ client organizations globally, while its Australian platform provides access to discounts from 1,000+ brands, demonstrating how digital rewards infrastructure can operate at enterprise scale
Preference for flexible spending options
Gift cards remain a widely accepted solution when buyer uncertainty about recipient preferences is high. Flexibility is increasing in importance as consumers seek choice across categories and merchants. Open-loop products and multi-brand ecosystems reduce constraints at redemption, which improves perceived value. Broader acceptance also increases the likelihood that gift cards are used as practical spending instruments.
Concentration of retail and demand in major states
Gift card demand in Australia is concentrated in major states where retail density, e-commerce penetration, and business activity are strongest. This concentration supports steady volumes and encourages retailers and platforms to prioritize omnichannel distribution, loyalty integration, and promotional execution in the largest demand hubs. Mature store networks and well-developed logistics also accelerate adoption of digital purchase and redemption features. At the same time, continued expansion across other states and territories adds incremental growth as regional retail footprints broaden and online access improves.
- For instance, Woolworths’ Delivery Now service was launched to offer Gold Coast shoppers grocery delivery in under two hours, illustrating how large retailers use faster fulfillment networks in dense demand locations to strengthen digital convenience.
Australia Gift Card Market Challenges
Fraud risk and chargeback exposure remain persistent constraints for issuers, retailers, and platforms, particularly as digital purchase volumes increase. Threat vectors include social engineering, unauthorized purchases, and resale marketplaces that complicate risk monitoring. Stronger verification can reduce losses, but excessive friction can lower conversion and weaken customer experience. Ensuring the right balance between security and seamless checkout remains a key operational challenge.
Competitive pressure also intensifies due to wide availability of similar products across retailers, marketplaces, and payment-linked ecosystems. Differentiation often depends on distribution reach, user experience, promotions, and partner integrations rather than on product structure alone. This can compress margins and increase marketing and platform investment requirements. Retailers also face execution complexity when integrating gifting into loyalty apps and ensuring consistent redemption across channels.
- For instance, Target said it added more than 13 million new Target Circle members in 2024, and Target Circle 360 now offers unlimited same-day delivery from Target plus Shipt’s curated marketplace of over 100 retailers, while the company also reported double-digit growth in same-day services such as Drive Up and same-day delivery with Target Circle 360.
Australia Gift Card Market Trends and Opportunities
Digital-first product ecosystems are expanding, with greater emphasis on app-based discovery, personalization, scheduled delivery, and wallet storage. These enhancements improve convenience, reduce “forgotten balance” issues, and support repeat engagement. Platforms that enable multi-brand choice and simplify program setup for businesses can capture higher share of corporate budgets. Open-loop growth leadership supports additional opportunities for payment-linked gifting formats and broader acceptance.
- For instance, Prezzee’s Smart eGift Card can be swapped across 400+ brands and stored in the Prezzee Wallet, while the company’s API can create an order in less than one second, retrieve one in 858 milliseconds, and operates with 99.98% API availability, highlighting how speed, wallet integration, and multi-brand flexibility can strengthen repeat usage and enterprise adoption.
State-level go-to-market optimization is also emerging as retailers and platforms focus investment on the largest demand centers while building scalable online distribution for regional customers. New South Wales, Victoria, and Queensland provide strong launch environments for new gifting features due to their retail density and digital adoption. Western Australia and smaller regions offer growth upside through targeted promotions, retail partnerships, and improved e-commerce reach. Better segmentation by cohort behavior and occasion-based marketing can further improve conversion.
Regional Insights
Australia Gift Card Market demand is concentrated in the country’s largest population and retail hubs, where higher consumer spending, dense store networks, and stronger e-commerce penetration support higher issuance and redemption volumes. This concentration shapes where retailers prioritize gift card racks, digital storefront improvements, and promotional intensity during peak gifting seasons. As gift cards increasingly function as both gifting and controlled-spend tools, the largest states typically see earlier adoption of new formats and delivery features.
New South Wales leads with 31.1% share, reflecting strong activity across metropolitan retail corridors and corporate incentive programs anchored in major business centers. The state’s high retail density and mature omnichannel ecosystems support both in-store discovery and online purchase behavior, keeping volumes resilient across consumer gifting occasions and business-led rewards. This positions NSW as the primary launch market for new gifting partnerships, loyalty integrations, and platform enhancements.
Victoria follows at 25.9% and Queensland at 20.1%, reinforcing a clear eastern-corridor demand cluster that accounts for the majority of national market activity. Victoria benefits from a large urban consumer base and extensive retailer presence, while Queensland’s scale is supported by its growing population and steady demand across mainstream retail categories. Together, NSW, Victoria, and Queensland remain the core regions where suppliers focus distribution coverage, marketing spend, and conversion optimization before scaling initiatives nationally.
Competitive Landscape
Australia Gift Card Market competition is shaped by retailer-led ecosystems, digital gifting platforms, and multi-merchant networks that compete on distribution reach, user experience, and partnerships. Differentiation increasingly depends on seamless purchase-to-redemption journeys, fraud controls, personalization capabilities, and the ability to support both consumer gifting and business incentive programs. Large retailers leverage high-traffic stores and loyalty programs, while specialist platforms focus on aggregation, multi-brand choice, and scalable corporate solutions. Entertainment, gaming, and mobility brands strengthen category depth by serving occasion-based and digital-native gifting needs.
Prezzee focuses on digital-first gifting experiences and platform-led distribution that can support both consumer purchases and enterprise reward programs. The company’s positioning emphasizes ease of selection across brands, digital delivery, and scalable program management for business users. Platform depth and partnerships are important to broaden merchant coverage and improve acceptance relevance across occasions. Continued investment in user experience and risk controls supports conversion and repeat usage in a competitive digital environment.
Shape Your Report to Specific Countries or Regions & Enjoy 30% Off!
The industry research and growth report includes detailed analyses of the competitive landscape of the market and information about key companies, including:
- Prezzee
- Coles Group Gift Cards
- Woolworths Group Gift Cards
- JB Hi-Fi Gift Cards
- Myer Gift Cards
- The Card Network (TCN)
- Big W Gift Cards
- Amazon
- Australia Post Gift Cards
- Bunnings Warehouse Gift Cards
- The Perfect Gift Card
- David Jones Gift Cards
- Apple
- Netflix Gift Cards
- Steam Gift Cards
- Uber Gift Cards
- Target
- Others
Qualitative and quantitative analysis of companies has been conducted to help clients understand the wider business environment as well as the strengths and weaknesses of key industry players. Data is qualitatively analyzed to categorize companies as pure play, category-focused, industry-focused, and diversified; it is quantitatively analyzed to categorize companies as dominant, leading, strong, tentative, and weak.
Recent Developments
- In Jan 2026, Australia Post adjusted online availability for third-party gift cards, influencing channel mix for digital purchases and redirecting demand toward other retailer and specialist online platforms.
- In December 2025, Blackhawk Network (BHN) partnered with BIG W to launch in-store Visa eGift Cards in Australia, with BIG W described as the first retailer in the country to offer the product nationwide ahead of the holiday season.
- In November 2025, Prezzee launched PrezzeePay in Sydney as an end-to-end global gift card platform, and the company said the platform would benefit from PrezzeePay’s Australian Financial Services licence and Prezzee’s partnership with UnionPay International.
Report Scope
| Report Attribute |
Details |
| Market size value in 2020 (Historical Year) |
USD 2766.2 million |
| Market size value in 2025 |
USD 5800.68 million |
| Revenue forecast in 2034 |
USD 14847.46 million |
| Growth rate (CAGR) |
10.98% (2025–2034) |
| Base year |
2025 |
| Forecast period |
2025–2034 |
| Quantitative units |
USD million |
| Segments covered |
By Product Type Outlook: Open Loop, Closed Loop; By Form Outlook: E-cards, Physical Cards; By End-user Outlook: Business, Individuals; By Price Range Outlook: High (Above 400 US$), Medium (200–400 US$), Low (0–200 US$); By Merchant Type Outlook: Supermarkets/Hypermarkets, Discount Stores, Restaurants, Coffee Shops, Others; By Sales Channel Outlook: Generation X, Millennials, Generation Z, Others |
| Regional scope |
New South Wales, Victoria, Queensland, Western Australia, Rest of Australia |
| Key companies profiled |
Prezzee, Coles Group Gift Cards, Woolworths Group Gift Cards, JB Hi-Fi Gift Cards, Myer Gift Cards, The Card Network (TCN), Big W Gift Cards, Amazon, Australia Post Gift Cards, Bunnings Warehouse Gift Cards, The Perfect Gift Card, David Jones Gift Cards, Apple, Netflix Gift Cards, Steam Gift Cards, Uber Gift Cards, Target, Others companies |
| No. of Pages |
329 |
Segmentation
By Product Type
By Form
By End-user
By Price Range
- High (Above 400 US$)
- Medium (200–400 US$)
- Low (0–200 US$)
By Merchant Type
- Supermarkets/Hypermarkets
- Discount Stores
- Restaurants
- Coffee Shops
- Others
By Sales Channel
- Generation X
- Millennials
- Generation Z
- Others


