| REPORT ATTRIBUTE |
DETAILS |
| Historical Period |
2020-2023 |
| Base Year |
2024 |
| Forecast Period |
2025-2032 |
| Autonomous Vehicle Market Size 2024 |
USD 67,775.52 Million |
| Autonomous Vehicle Market, CAGR |
18.8% |
| Autonomous Vehicle Market Size 2032 |
USD 2,67,560.06 Million |
Market Overview:
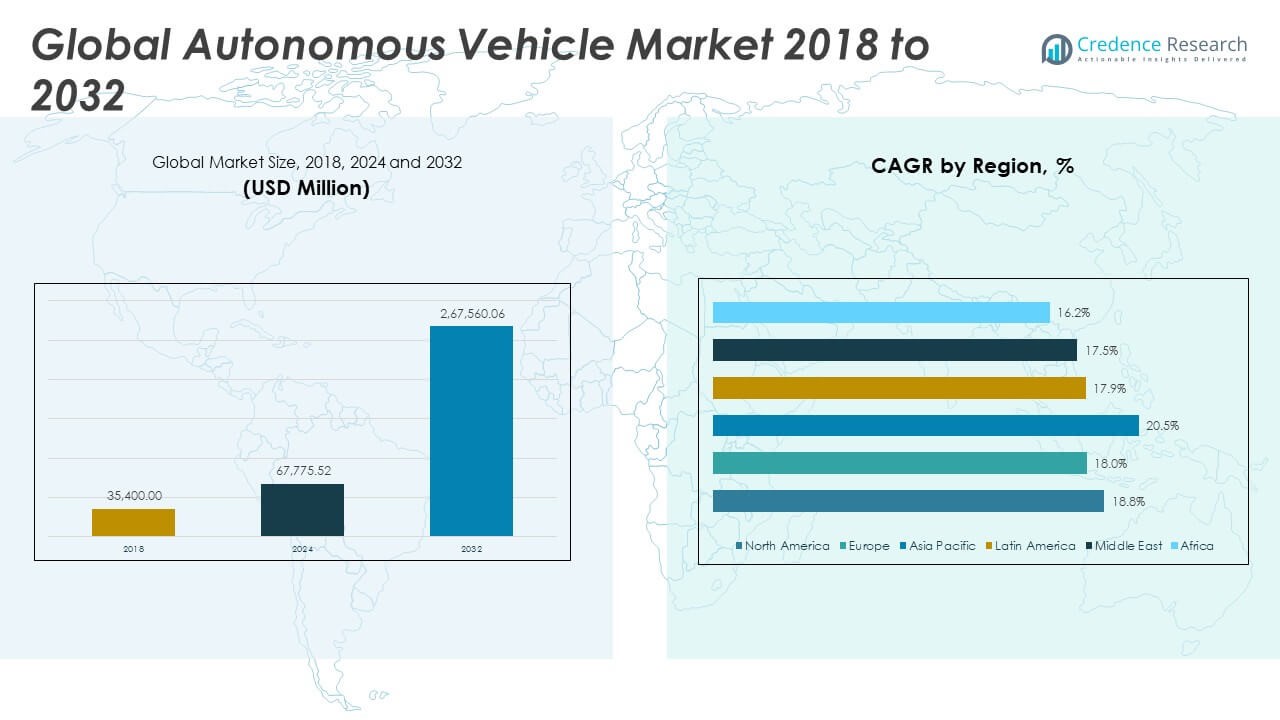
The Global Autonomous Vehicle Market size was valued at USD 35,400.00 million in 2018 to USD 67,775.52 million in 2024 and is anticipated to reach USD 2,67,560.06 million by 2032, at a CAGR of 18.8% during the forecast period.
Several factors are propelling the rapid expansion of the autonomous vehicle industry. One of the primary drivers is the push for enhanced road safety through the reduction of human error, which accounts for the majority of traffic accidents globally. Autonomous systems, equipped with real-time sensors, AI-driven decision-making, and adaptive control, promise more consistent driving behavior, quicker response times, and lower accident rates. Governments are increasingly supporting this shift by implementing regulatory policies, safety testing protocols, and incentives to accelerate technology adoption. Another significant driver is the economic and operational efficiency that autonomous vehicles offer, especially in the commercial and logistics sectors. Automated fleets reduce labor costs, optimize fuel usage, and allow for continuous operation without downtime. In urban areas, autonomous taxis and shuttles are seen as a solution to reduce congestion and enhance mobility access. Industry partnerships between OEMs, software developers, and chipmakers are further accelerating innovation, while public sentiment is gradually shifting toward acceptance of driverless technologies through increased exposure and education.
Regionally, North America currently leads the global autonomous vehicle market, accounting for the largest share due to robust R&D investments, well-defined regulatory support, and early deployment of autonomous fleets. The United States, in particular, is home to key players such as Waymo, Cruise, Tesla, and Aurora, who are actively testing and scaling autonomous driving systems. Several U.S. states, including California, Arizona, and Texas, have legalized full self-driving testing and operations, allowing commercial services like robotaxis and autonomous delivery to gain real-world traction. Europe follows closely, with strong emphasis on safety, sustainability, and data governance. Asia-Pacific is the fastest-growing regional market, driven by China’s aggressive deployment strategies and massive investments from companies like Baidu, WeRide, and Pony.ai. The Chinese government has incorporated autonomous mobility into its national strategy, enabling city-level testing and deployment zones. Japan and South Korea are also advancing rapidly, leveraging their strong automotive manufacturing bases and smart infrastructure initiatives. Meanwhile, emerging regions such as the Middle East, Southeast Asia, and Latin America are gradually adopting autonomous technologies, focusing initially on freight and public transportation applications as infrastructure and regulatory readiness improve.
Access crucial information at unmatched prices!
Request your sample report today & start making informed decisions powered by Credence Research Inc.!
Download Sample
Market Insights:
- The Global Autonomous Vehicle Market grew from USD 35,400.00 million in 2018 to USD 67,775.52 million in 2024 and is expected to reach USD 267,560.06 million by 2032, registering a CAGR of 18.8%.
- Rising demand for safer mobility and the need to minimize human error are accelerating the adoption of autonomous vehicles in both private and commercial segments.
- The integration of artificial intelligence, LiDAR, radar, and computer vision is enabling better decision-making and environmental perception in autonomous systems.
- Governments are supporting autonomous driving with legal frameworks, infrastructure investment, and mandates for advanced driver-assistance systems in new vehicles.
- Autonomous trucks, delivery vehicles, and ride-hailing fleets are improving logistics efficiency, lowering costs, and opening new revenue channels for operators.
- The market faces hurdles from inconsistent regulations and liability concerns across regions, delaying cross-border deployment and slowing commercialization.
- North America dominates the market with strong R&D and early commercial services, while Asia-Pacific shows the fastest growth led by China, Japan, and South Korea.
Market Drivers:
Rising Demand for Safer Mobility and Reduction in Human Error:
The Global Autonomous Vehicle Market is driven by the urgent need to enhance road safety by reducing human involvement in driving. Human error remains the primary cause of road accidents worldwide, prompting regulators and consumers to adopt automated driving technologies. Autonomous systems equipped with advanced sensors and real-time data processing can improve vehicle response and maintain consistent driving patterns. These capabilities reduce accident risks in urban traffic and long-distance highway operations. Governments are introducing stricter road safety mandates, pushing automakers to incorporate driver assistance and autonomy features. The demand for safer mobility is propelling the transition from Level 2 to Level 4 autonomy across various vehicle segments.
- For instance, Waymo reported that its autonomous fleet in Phoenix, Arizona, had driven over 20 million miles on public roads without any at-fault personal injury accidents, as documented in its October 2023 safety report, demonstrating improved safety performance compared to human drivers.
Accelerated Integration of AI and Sensor Technologies:
Artificial Intelligence (AI), machine learning, and sensor technologies are transforming autonomous driving capabilities. These innovations allow vehicles to interpret surroundings, make decisions, and respond to dynamic traffic conditions. LiDAR, radar, and computer vision systems offer precise detection, enabling safer lane changes, object avoidance, and adaptive cruise control. The integration of AI improves system accuracy and decision-making under diverse conditions, including low light and poor weather. Continuous software updates are enhancing performance and reducing the learning curve for real-world deployments. The Global Autonomous Vehicle Market benefits from this convergence of AI and hardware innovation.
- For instance, Tesla’s Full Self-Driving (FSD) Beta uses a camera suite and neural network system processing 360-degree video at 36 trillion operations per second on its Dojo supercomputer, enabling it to handle complex city and highway driving scenarios, as highlighted in Tesla’s 2023 AI Day.
Government Support and Evolving Regulatory Frameworks:
Policymakers are supporting the adoption of autonomous vehicles through funding, pilot programs, and regulatory alignment. Countries like the U.S., China, and Germany have introduced legal frameworks that enable testing and deployment of autonomous systems. Government-backed infrastructure upgrades, including intelligent transportation systems and 5G networks, are reinforcing market readiness. Regulations now mandate the inclusion of features such as lane-keeping assistance and emergency braking in new vehicles. Regulatory clarity reduces entry barriers for companies developing self-driving technologies. The Global Autonomous Vehicle Market is advancing steadily under this favorable policy environment.
Economic Efficiency and Emerging Commercial Applications:
Autonomous driving offers cost advantages for logistics, mobility services, and fleet operations. It eliminates driver-related expenses and minimizes operational downtime, leading to lower total cost of ownership. Autonomous trucks and delivery vehicles improve supply chain performance through continuous operation and route optimization. The ride-hailing and car-sharing industries are exploring fully autonomous fleets to increase availability and reduce fares. Companies are investing in robotaxis and delivery bots to gain early market leadership. The Global Autonomous Vehicle Market is expanding into commercial sectors where autonomy delivers immediate cost benefits.
Market Trends:
Adoption of Shared Autonomous Mobility Services:
The Global Autonomous Vehicle Market is experiencing strong interest in shared mobility services using driverless vehicles. Urbanization and congestion are encouraging the shift toward fleet-based transportation models like autonomous ride-hailing and shuttles. Companies such as Waymo, Cruise, and Baidu are deploying pilot fleets in major cities, targeting both passenger transport and logistics. These services help reduce private vehicle ownership while improving transportation efficiency. Consumers are engaging with app-based autonomous services due to convenience and cost advantages. The market is aligning with smart city strategies that emphasize mobility-as-a-service platforms.
- For instance, Cruise has operated over 5 million fully driverless miles in San Francisco and has achieved 94% on-time pickup rates with its autonomous ride-hailing service as of January 2024, as reported by Cruise and municipal transit authorities.
Advancement in V2X and Infrastructure Connectivity:
Vehicle-to-everything (V2X) communication is emerging as a core trend in supporting fully autonomous driving. It enables vehicles to interact with road infrastructure, traffic signals, and nearby vehicles to anticipate hazards and navigate complex environments. V2X supports real-time decision-making by extending sensor range and improving system awareness. Governments and city planners are investing in connected roadways to accelerate adoption. Smart intersections, cloud-based traffic management, and 5G networks are being integrated with vehicle platforms. The Global Autonomous Vehicle Market is leveraging this ecosystem to support higher levels of autonomy.
- For instance, Audi, in partnership with Traffic Technology Services (TTS), has deployed its “Traffic Light Information” V2I (Vehicle-to-Infrastructure) service.
Customization of Autonomous Features Across Vehicle Segments:
Automotive OEMs are segmenting autonomous capabilities based on use cases and customer needs. Luxury brands are focusing on Level 3 and 4 systems for highway cruising and urban driving, while commercial fleets prioritize last-mile automation. This trend allows automakers to roll out autonomy gradually, balancing cost, performance, and regulation. Passenger vehicles, delivery vans, and industrial transporters are receiving purpose-built autonomous features. The modular design of autonomy stacks supports adaptability across different platforms. The Global Autonomous Vehicle Market is moving toward scalable autonomy solutions tailored to each segment.
Increased Investment in Simulation and Digital Twin Technologies:
Companies are turning to advanced simulation platforms and digital twins to accelerate testing and validation of autonomous systems. Physical testing remains costly and time-consuming, especially for complex driving scenarios. Virtual environments allow for faster iteration, safer experimentation, and more robust software training. Simulation reduces risk and improves reliability before real-world deployment. It also helps meet regulatory requirements for system verification. The Global Autonomous Vehicle Market is increasingly integrating virtual development tools to shorten time-to-market and improve system robustness.
Market Challenges Analysis:
Regulatory Gaps and Legal Liabilities in Multi-Region Deployment:
The Global Autonomous Vehicle Market faces significant challenges in navigating fragmented regulatory environments across countries. Each region has distinct safety standards, liability frameworks, and approval processes for autonomous driving. These inconsistencies complicate cross-border operations and delay commercialization. Legal uncertainty around accidents involving autonomous systems raises concerns about insurance, data ownership, and manufacturer responsibility. It also slows down partnerships between automakers and tech firms. The market needs standardized regulations to streamline certification and facilitate global expansion.
Technical Limitations and Public Trust Deficit:
Despite technological advancements, autonomous systems still face limitations in decision-making under unpredictable conditions such as road construction, weather changes, and mixed traffic. Edge cases in driving scenarios are difficult to manage without extensive datasets and adaptive learning. System failures or misinterpretation of data can lead to safety incidents. Public skepticism remains high due to safety concerns and lack of trust in full automation. Consumer confidence is essential to support market adoption. The Global Autonomous Vehicle Market must address these reliability issues to build acceptance.
Market Opportunities:
Expansion of Autonomous Technology into Freight and Logistics Sectors:
The Global Autonomous Vehicle Market holds substantial opportunity in freight transportation, warehousing, and last-mile delivery. Companies are exploring driverless trucks and delivery robots to reduce labor dependency, increase operational uptime, and lower transportation costs. These sectors operate in structured environments, making them suitable for early-stage deployment of autonomous systems. Logistics operators are adopting autonomous solutions for route optimization and fuel efficiency. Regulatory bodies are showing greater flexibility for autonomous freight than passenger vehicles, accelerating pilot programs. It provides a scalable opportunity for automation across the global supply chain.
Integration with Electrification and Smart Infrastructure Initiatives:
The Global Autonomous Vehicle Market aligns with the global shift toward electric mobility and smart city development. Cities and governments are investing in intelligent transport systems, including 5G networks and connected traffic management, which support autonomous driving infrastructure. Electric autonomous vehicles address both emission reduction and safety goals, making them ideal for urban deployment. It enables integration with public transport, micro-mobility, and shared mobility platforms. OEMs and tech providers are forming partnerships to build ecosystem solutions that include software, infrastructure, and vehicle platforms. This cross-sector integration creates new revenue models and accelerates adoption.
Market Segmentation Analysis:
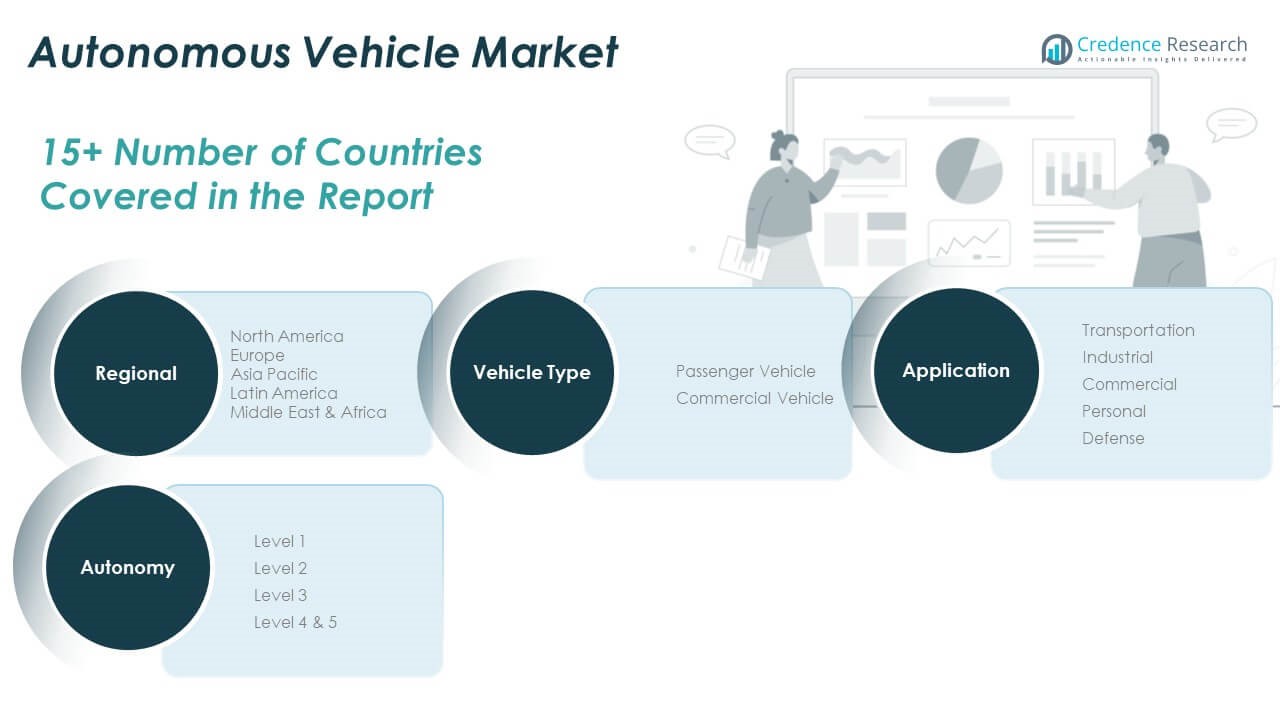
By Vehicle Type
The Global Autonomous Vehicle Market includes two primary vehicle types: passenger and commercial. Passenger vehicles dominate due to strong demand for safety, comfort, and autonomous features in private and shared mobility. Commercial vehicles are growing rapidly, supported by logistics firms and fleet operators seeking to optimize delivery and transportation efficiency through autonomy.
- For instance, TuSimple has demonstrated its autonomous trucks’ capabilities by completing over 10 million cumulative autonomous miles on U.S. highways for logistics partners, as officially reported in its Q1 2024 investor update.
By Application
The application segment covers transportation, industrial, commercial, personal, and defense uses. Transportation leads, driven by self-driving taxis, shuttles, and public transit automation. Industrial and commercial applications are scaling with warehouse automation and autonomous goods movement. Personal vehicle autonomy is gaining traction in premium models. Defense forces are adopting autonomous ground vehicles for reconnaissance and supply missions.
- For instance, Nuro’s purpose-built autonomous delivery vehicles have completed commercial deliveries for major retailers such as Kroger and Domino’s in multiple U.S. states, according to Nuro’s public progress reports and regulatory filings for 2024.
By Autonomy Level
Autonomy is categorized from Level 1 to Level 5. Level 1 and Level 2 vehicles currently dominate with basic automation like cruise control and lane assistance. Level 3 systems are emerging, enabling conditional automation under limited conditions. Level 4 and 5 vehicles, offering high to full autonomy without human intervention, represent the future growth area, with companies testing deployment in controlled environments.
Segmentation:
By Type:
- Passenger Vehicle
- Commercial Vehicle
By Application:
- Transportation
- Industrial
- Commercial
- Personal
- Defense
By Autonomy:
- Level 1
- Level 2
- Level 3
- Level 4 & 5
By Region:
- North America
- Europe
- UK
- France
- Germany
- Italy
- Spain
- Russia
- Rest of Europe
- Asia Pacific
- China
- Japan
- South Korea
- India
- Australia
- Southeast Asia
- Rest of Asia Pacific
- Latin America
- Brazil
- Argentina
- Rest of Latin America
- Middle East
- GCC Countries
- Israel
- Turkey
- Rest of Middle East
- Africa
- South Africa
- Egypt
- Rest of Africa
Regional Analysis:
North America
The North America Autonomous Vehicle Market size was valued at USD 13,770.60 million in 2018 to USD 26,066.06 million in 2024 and is anticipated to reach USD 1,02,770.30 million by 2032, at a CAGR of 18.8% during the forecast period. The Global Autonomous Vehicle Market sees North America as the leading region, primarily due to aggressive R&D spending, advanced infrastructure, and strong public-private partnerships. The U.S. dominates the region with multiple pilot projects across major states such as California, Texas, and Arizona. Companies like Waymo, Tesla, General Motors (Cruise), and Apple are headquartered here, contributing significantly to market leadership. Government agencies such as NHTSA and the U.S. Department of Transportation are actively shaping AV policies and safety frameworks, which facilitates faster deployment. Widespread adoption of autonomous freight systems and smart public transport further drives growth in the region. The presence of a well-established tech ecosystem and venture capital support positions North America as the global innovation hub for AVs.
Europe
The Europe Autonomous Vehicle Market size was valued at USD 9,097.80 million in 2018 to USD 16,725.15 million in 2024 and is anticipated to reach USD 62,275.31 million by 2032, at a CAGR of 18.0% during the forecast period. Europe holds the second-largest share in the Global Autonomous Vehicle Market due to its strong automotive industry and government-backed research initiatives. Countries such as Germany, France, the United Kingdom, and Sweden are investing in AV pilot zones, smart road infrastructure, and regulatory frameworks. The European Union is supporting cross-border testing and harmonization of standards across member states, improving scalability. Premium automakers like BMW, Mercedes-Benz, Volkswagen, and Volvo are integrating Level 3 and Level 4 technologies into luxury and commercial vehicles. Europe’s focus on sustainability and smart mobility is promoting integration of autonomous vehicles into public transport and last-mile delivery. The growing adoption of Mobility-as-a-Service (MaaS) platforms further supports long-term AV deployment strategies.
Asia Pacific
The Asia Pacific Autonomous Vehicle Market size was valued at USD 7,540.20 million in 2018 to USD 15,171.27 million in 2024 and is anticipated to reach USD 66,970.50 million by 2032, at a CAGR of 20.5% during the forecast period. Asia Pacific is the fastest-growing region in the Global Autonomous Vehicle Market, with China, Japan, and South Korea leading innovation and deployment. China’s Ministry of Industry and Information Technology (MIIT) has launched several pilot programs in cities such as Beijing, Shanghai, and Shenzhen, while companies like Baidu (Apollo), AutoX, and Pony.ai are scaling commercial AV services. Japan’s AV growth is driven by its aging population, creating demand for safe, autonomous mobility solutions. Automakers like Toyota, Nissan, and Honda are incorporating automation in passenger and logistics vehicles. South Korea is rapidly advancing AV testing, supported by companies such as Hyundai and Samsung. Government subsidies, tech-friendly regulations, and smart city expansion make Asia Pacific a critical driver of global AV adoption.
Latin America
The Latin America Autonomous Vehicle Market size was valued at USD 2,676.24 million in 2018 to USD 5,082.49 million in 2024 and is anticipated to reach USD 18,854.95 million by 2032, at a CAGR of 17.9% during the forecast period. The region is gradually emerging as a promising market, with Brazil and Mexico leading the charge. Government-backed urban mobility programs and rising interest in autonomous shuttles for public transport are fostering AV experimentation. Despite slower infrastructure development compared to other regions, Latin America benefits from growing partnerships between local governments and global AV players for pilot testing. Logistics and last-mile delivery services are adopting semi-autonomous vehicles to address inefficiencies and high labor costs. Smart city initiatives in São Paulo, Mexico City, and Bogotá are integrating automation into urban planning. However, regulatory clarity and technological readiness remain moderate, influencing a cautious but upward growth path.
Middle East
The Middle East Autonomous Vehicle Market size was valued at USD 1,529.28 million in 2018 to USD 2,764.80 million in 2024 and is anticipated to reach USD 9,981.46 million by 2032, at a CAGR of 17.5% during the forecast period. The Global Autonomous Vehicle Market in the Middle East is seeing momentum due to government-led initiatives focused on technology and sustainability. The UAE and Saudi Arabia are deploying autonomous taxis, buses, and last-mile shuttles in smart city zones such as NEOM and Masdar City. The Dubai Autonomous Transportation Strategy aims to make 25% of all transport autonomous by 2030. High investments in infrastructure, 5G networks, and AI integration provide a conducive environment for AV trials. Dubai’s Roads and Transport Authority (RTA) is working with global AV companies to implement autonomous fleets for tourism and public mobility. The region’s ambition to lead in futuristic transport models will continue driving AV market growth.
Africa
The Africa Autonomous Vehicle Market size was valued at USD 785.88 million in 2018 to USD 1,965.76 million in 2024 and is anticipated to reach USD 6,707.53 million by 2032, at a CAGR of 16.2% during the forecast period. Africa remains the least developed region in the Global Autonomous Vehicle Market, but opportunities are emerging in industrial sectors such as mining, construction, and agriculture. Countries like South Africa and Kenya are exploring the use of autonomous systems in restricted zones, including logistics hubs and industrial parks. Limited road infrastructure and connectivity challenges hinder urban AV adoption, though technology transfer from global companies is introducing semi-autonomous functions. Government focus on transport modernization and sustainability in select regions is slowly creating a foundation for future AV integration. Africa’s long-term AV potential lies in commercial and industrial applications rather than private mobility, especially in areas with predictable, enclosed operational domains.
Shape Your Report to Specific Countries or Regions & Enjoy 30% Off!
Key Player Analysis:
- AUDI AG
- Ford Motor Company
- Mercedes-Benz Group
- Nuro, Inc.
- ai
- Tesla
- Toyota Kirloskar Motor
- Volkswagen Group
- Waymo LLC
- Zoox, Inc.
Competitive Analysis:
The Global Autonomous Vehicle Market features intense competition among automotive OEMs, tech companies, and mobility service providers. Leading players include Tesla, Waymo, Baidu, NVIDIA, Mercedes-Benz, BMW, and General Motors. These companies focus on AI algorithms, sensor fusion, and autonomous driving software to gain a competitive edge. Tesla and Waymo lead in real-world testing and deployment of semi-autonomous and fully autonomous systems. Traditional automakers are collaborating with technology firms to accelerate development timelines and meet safety standards. Emerging startups such as Aurora and Pony.ai are attracting significant investments to scale pilot programs. It remains highly dynamic, with firms competing on innovation speed, regulatory compliance, and user safety. Partnerships, acquisitions, and joint ventures play a critical role in expanding capabilities and market reach. The ability to integrate advanced autonomy with vehicle platforms, secure regulatory approvals, and manage real-time data efficiently defines leadership in this evolving market.
Recent Developments:
- In July 2025, Pony.ai began mass production and real-world road testing of its seventh-generation Robotaxi, working closely with Guangzhou Automobile Group and Beijing Automotive Industry Corporation. The company aims to have over 1,000 vehicles commercially operating by year-end 2025, a milestone fueled by a 70% reduction in component costs and the integration of 100% automotive-grade hardware in its autonomous fleet.
- In July 2025, Tesla rolled out the 2025.26 software update across its fleet, debuting the Grok AI voice assistant in beta. This feature is designed to enhance in-car interaction but does not alter or control the primary autonomous driving features. The rollout began with a small group of early access owners and will expand in the coming months, further cementing Tesla’s focus on next-generation AI in vehicle interfaces.
- In June 2025, Volkswagen Group launched the ID. Buzz AD, its first fully autonomous production vehicle, through its MOIA mobility subsidiary in Hamburg. Built with Mobileye’s self-driving system and 27 sensors for Level 4 autonomy, the ID. Buzz AD is part of a bundled solution for ride-hailing, public transit, and fleet management, with plans to expand deployment across Europe and the US by 2026.
- In February 2025, Toyota Kirloskar Motor showcased its commitment to future mobility at India Energy Week, with new launches that included eco-friendly and autonomous-ready vehicles. The company also highlighted a partnership with NVIDIA, adopting the Drive AGX Orin platform to power its next-generation vehicles with AI and advanced driver assistance, as well as progress in its Woven City living lab and urban EV concepts.
Market Concentration & Characteristics:
The Global Autonomous Vehicle Market exhibits moderate to high market concentration, with a few major players dominating early-stage deployments and technological advancements. It is characterized by high capital intensity, rapid innovation cycles, and strong dependency on regulatory frameworks and safety validations. Leading firms control a significant share through proprietary software platforms, sensor integration, and real-world testing networks. Strategic alliances between automakers and tech firms are common, aimed at combining manufacturing scale with advanced AI capabilities. The market demands long development timelines, robust cybersecurity frameworks, and high-precision mapping infrastructure. It shows strong barriers to entry due to technological complexity, high R&D costs, and strict regulatory scrutiny.
Report Coverage:
The research report offers an in-depth analysis based on type, application, and autonomy level. It details leading market players, providing an overview of their business, product offerings, investments, revenue streams, and key applications. Additionally, the report includes insights into the competitive environment, SWOT analysis, current market trends, as well as the primary drivers and constraints. Furthermore, it discusses various factors that have driven market expansion in recent years. The report also explores market dynamics, regulatory scenarios, and technological advancements that are shaping the industry. It assesses the impact of external factors and global economic changes on market growth. Lastly, it provides strategic recommendations for new entrants and established companies to navigate the complexities of the market.
Future Outlook:
- Autonomous vehicle adoption will accelerate in urban mobility and ride-hailing fleets by 2032.
- Regulatory frameworks will evolve to support Level 4 and Level 5 deployment in controlled zones.
- AI and machine learning advancements will enhance real-time decision-making and vehicle safety.
- Investment in high-definition mapping and V2X infrastructure will expand across major markets.
- Fleet operators will integrate autonomous systems to reduce labor costs and improve logistics efficiency.
- Consumer acceptance will increase with improved reliability, lowering resistance to full autonomy.
- Emerging markets in Asia and the Middle East will become key growth zones due to smart city initiatives.
- Cybersecurity and data privacy solutions will become critical components of autonomous platforms.
- Partnerships between automakers and tech firms will intensify to accelerate commercialization.
- Government funding and smart transportation initiatives will drive pilot programs and regional trials.


