Overnight cycling trips generate USD 33.84 billion of traveler spending in 2025, heading for USD 59.62 billion by 2035
The cycle tourism market, covering traveler spending on overnight trips where cycling is the main purpose, was valued at USD 33.84 billion in 2025. Spending rises to USD 35.79 billion in 2026 and is projected to reach USD 59.62 billion by 2035, advancing at a 5.83% CAGR over 2025–2035. Spending spans lodging, food, local transport, bike hire, tour packages and event entry. Four forces support demand: e-bikes that open multi-day routes to older and less fit riders, signed long-distance routes, record tourist volumes and a preference for low-carbon outdoor holidays. Europe accounted for 50.0% of 2025 spending, the largest regional share, backed by the 17-route EuroVelo network and Germany's large base of cycle travelers. The main commercial change is the move from self-organized touring toward self-guided packages that bundle booked hotels, luggage transfer and e-bike hire, which raises spending per trip. Self-guided packages are the fastest-growing trip type at 7.51% a year, while e-bike trips grow at 9.25%.
Bike holiday spending rises about 76% from USD 33.84 billion in 2025 to USD 59.62 billion in 2035
All values are in USD billion and measure traveler spending on overnight cycling trips at current prices, not trip counts. The market adds USD 1.95 billion from 2025 to 2026 and USD 25.78 billion over 2025–2035, a 5.83% CAGR across 10 compounding years.
What do cycle tourists pay for, and who sells it?
Cycle tourism spending comes from households, not institutions. A typical trip combines 1 or more nights in hotels, guesthouses, holiday apartments or campsites with meals, train or shuttle transfers, bike hire and, for packaged trips, an operator fee that covers route notes, luggage transfer and support. Germany's ADFC survey of more than 17,300 people found that 34.1% of longer-trip cycle tourists stayed in guesthouses and 22.3% in holiday apartments.
The value chain runs from lodging, food and transport providers along a route, through bike hire and repair shops, to tour operators and destination bodies that market routes. The estimate excludes day rides without an overnight stay, everyday commuting, flights to the start of a trip and bike purchases, which sit in the electric bicycles market. Those exclusions keep cycle tourism separate from the much larger bicycle retail and general outdoor recreation economies.
Cycle Tourism Market Insights
- The cycle tourism market is projected to grow from USD 35.79 billion in 2026 to USD 59.62 billion by 2035, a 5.83% CAGR, as e-bikes widen the rider base.
- Europe accounted for 50.0% of 2025 spending, the largest regional share, because dense signed route networks and German riders anchor demand.
- Independent cycling trips accounted for 56.0% of 2025 spending, the largest trip type, because most riders plan routes and book rooms themselves.
- More than half of German cycle tourists on longer trips now ride an e-bike, according to 2025 survey results, shifting demand toward electric-assist hire fleets.
- Self-guided tour packages grow fastest at 7.51% a year from 2025 to 2035, rewarding operators that bundle hotels, luggage transfer and e-bike hire.
Self-planned trips carry the spending while self-guided packages and e-bikes supply the growth
Trip type: Independent riders spend the most, self-guided packages expand fastest
Based on trip type, the market is categorized into independent cycling trips, self-guided tour packages, guided group tours and cycling events and sportives. Independent trips led with 56.0% of 2025 spending, because most riders plan their own routes with apps and book rooms directly. Self-guided packages grow fastest at 7.51% a year, as travelers pay for booked hotels and luggage transfer while keeping their own pace. Multi-day events link this segment to the sports tourism market.
Bike type: Conventional touring bikes lead, e-bike trips grow fastest
Based on bike type, the market is categorized into conventional touring and trekking bikes, e-bikes, road bikes and mountain and gravel bikes. Conventional touring and trekking bikes led with 46.0% of 2025 spending, reflecting long-standing touring habits and owned bikes. E-bike trips grow fastest at 9.25% a year, because electric assist lets mixed-fitness couples and older riders cover hilly routes, which lifts demand for rental fleets and charging-ready hotels.
| Segment Group | Leading Sub-segment | Share, 2025 | Fastest-growing Sub-segment | CAGR, 2025–2035 |
|---|---|---|---|---|
| By Trip Type | Independent Cycling Trips | 56.0% | Self-Guided Tour Packages | 7.51% |
| By Bike Type | Conventional Touring & Trekking Bikes | 46.0% | E-Bikes | 9.25% |
Request a Free Sample
Fill in your details and we'll send you a free sample report.
- Sample data tables & charts
- Research methodology
Electric assist, signed long-distance routes and record tourist nights lift bike holiday budgets
Electric assist opens multi-day routes to older and less fit riders
E-bikes flatten hills and stretch daily distances, so couples and groups with mixed fitness can ride together. The ADFC travel bike analysis for 2025 found that more than 50% of German cycle tourists on longer trips rode an e-bike, and 10.1% bought one before setting off. Germany is the largest source market, so the shift spreads to routes across Austria, Italy and France. E-bike trips grow fastest among bike types at 9.25% a year, a long-term effect that runs through 2035 and steadily raises demand for rental fleets.
Signed long-distance routes lower the effort of planning a bike holiday
Signed, mapped routes with bike-friendly hotels turn a complex trip into a simple booking. EuroVelo lists 17 long-distance cycle routes that cross and connect Europe, and the U.S. Bicycle Route System counts more than 24,000 miles in 35 states and Washington, D.C. In January 2025, Adventure Cycling Association announced four new U.S. Bicycle Routes in Indiana, Missouri and Kansas. Each new signed corridor adds lodging and food spending in rural towns over the medium term.
Record EU tourist nights give cycle trips a larger travel base
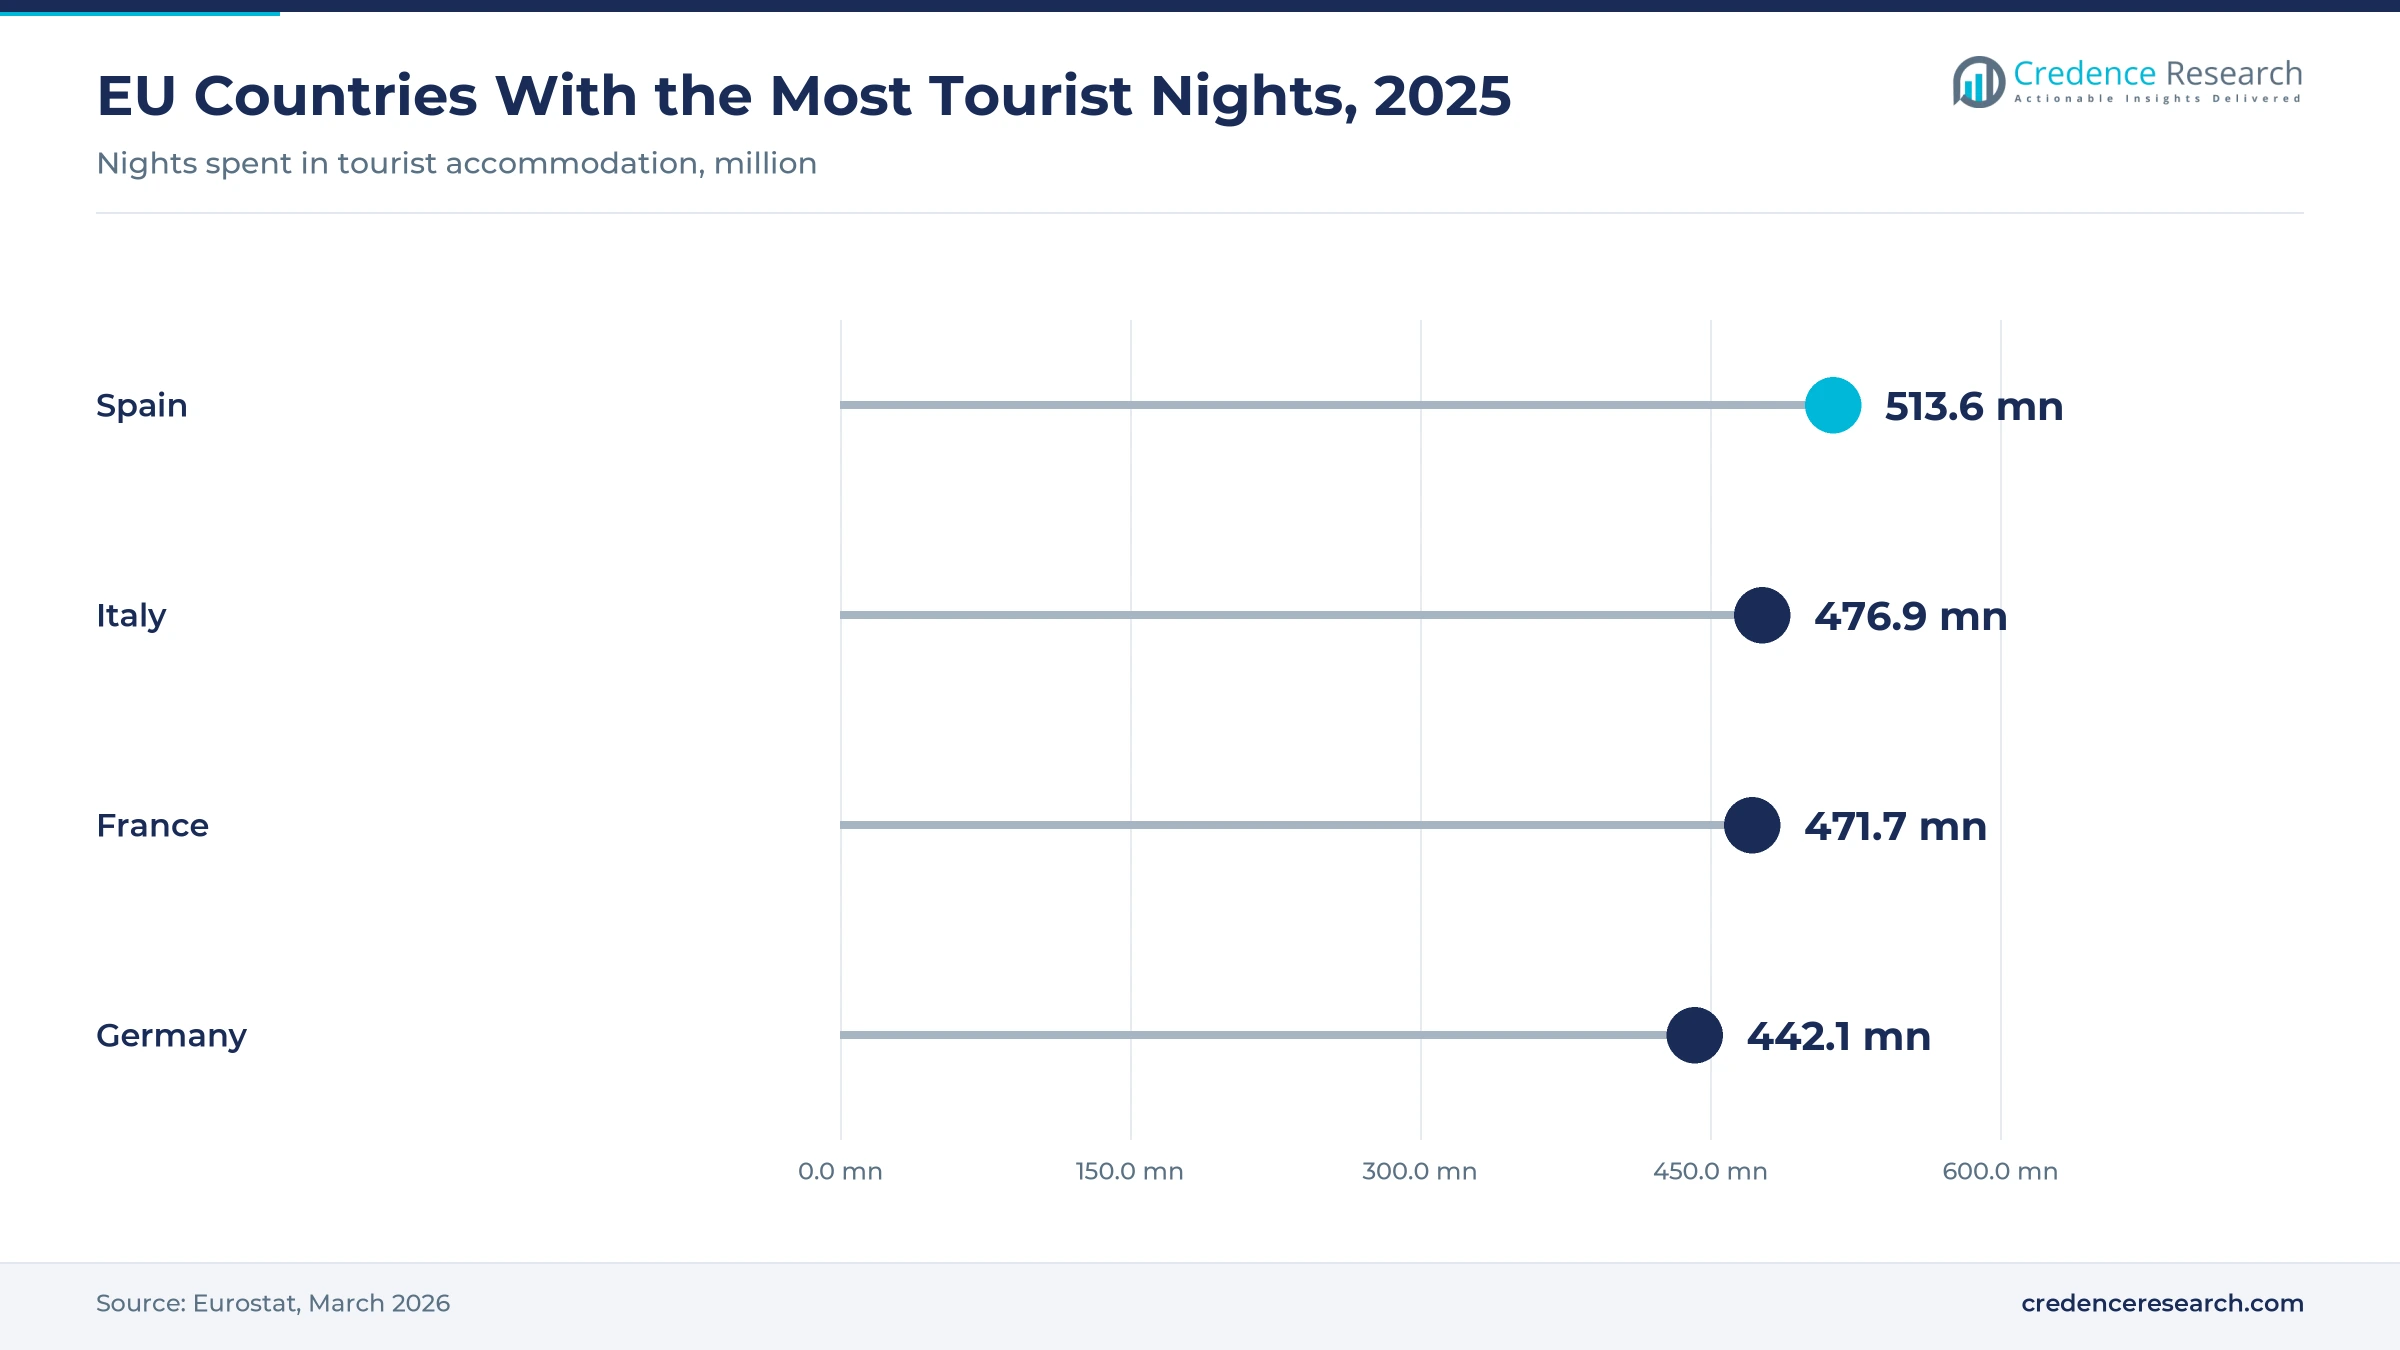
General travel demand remains strong. Eurostat reported nearly 3.1 billion nights in EU tourist accommodation in 2025, up 2.2% or 66.4 million nights from 2024, with nights by international guests up 3.4%. Spain, Italy, France and Germany each recorded more than 440 million nights. Cycle tourism rides on that base, because operators fill rooms in shoulder months and inland regions that coastal tourism misses, a near-term support that holds through 2026.
Slow, low-carbon holidays gain policy backing and longer stays
Cycle tourists stay several nights in each region, use small hotels and guesthouses, and spend on local food. In April 2024, the European Parliament, Council and Commission signed the European Declaration on Cycling, which places cycling, including cycle tourism, on the EU policy agenda. Regions use cycle routes to spread visitors away from crowded hotspots, tying the activity to sustainable tourism plans and to rural development budgets over the long term, particularly in Europe.
Luggage-transfer packages, shorter trips near home and e-bike hire change how cyclists travel
Trend: Self-guided packages replace do-it-yourself planning for many riders
Travelers want to ride at their own pace without arranging every hotel and bag transfer. Self-guided packages, with booked rooms, route notes, GPS tracks and luggage moved each day, grow fastest among trip types at 7.51% a year. The trend favors operators with dense hotel contracts along popular routes, and it shifts spending from independent bookings toward packaged fees. Central European specialists such as Eurobike and Austria Radreisen built their businesses on this format.
Trend: Shorter, spontaneous trips closer to home
ADFC's 2025 survey showed a slight decline in cycle trips overall, while nearly 60% of riders on trips of 3 or more nights stayed within Germany and 22.8% decided only a week before departure. Short trips of 1 to two nights carried the highest daily spending, at EUR 144 per person, against EUR 133 on longer trips and EUR 34 on day trips. Destinations near large cities and rail hubs gain, while long-haul tours compete harder for fewer weeks.
Opportunity: E-bike hire, charging and bundled rider services
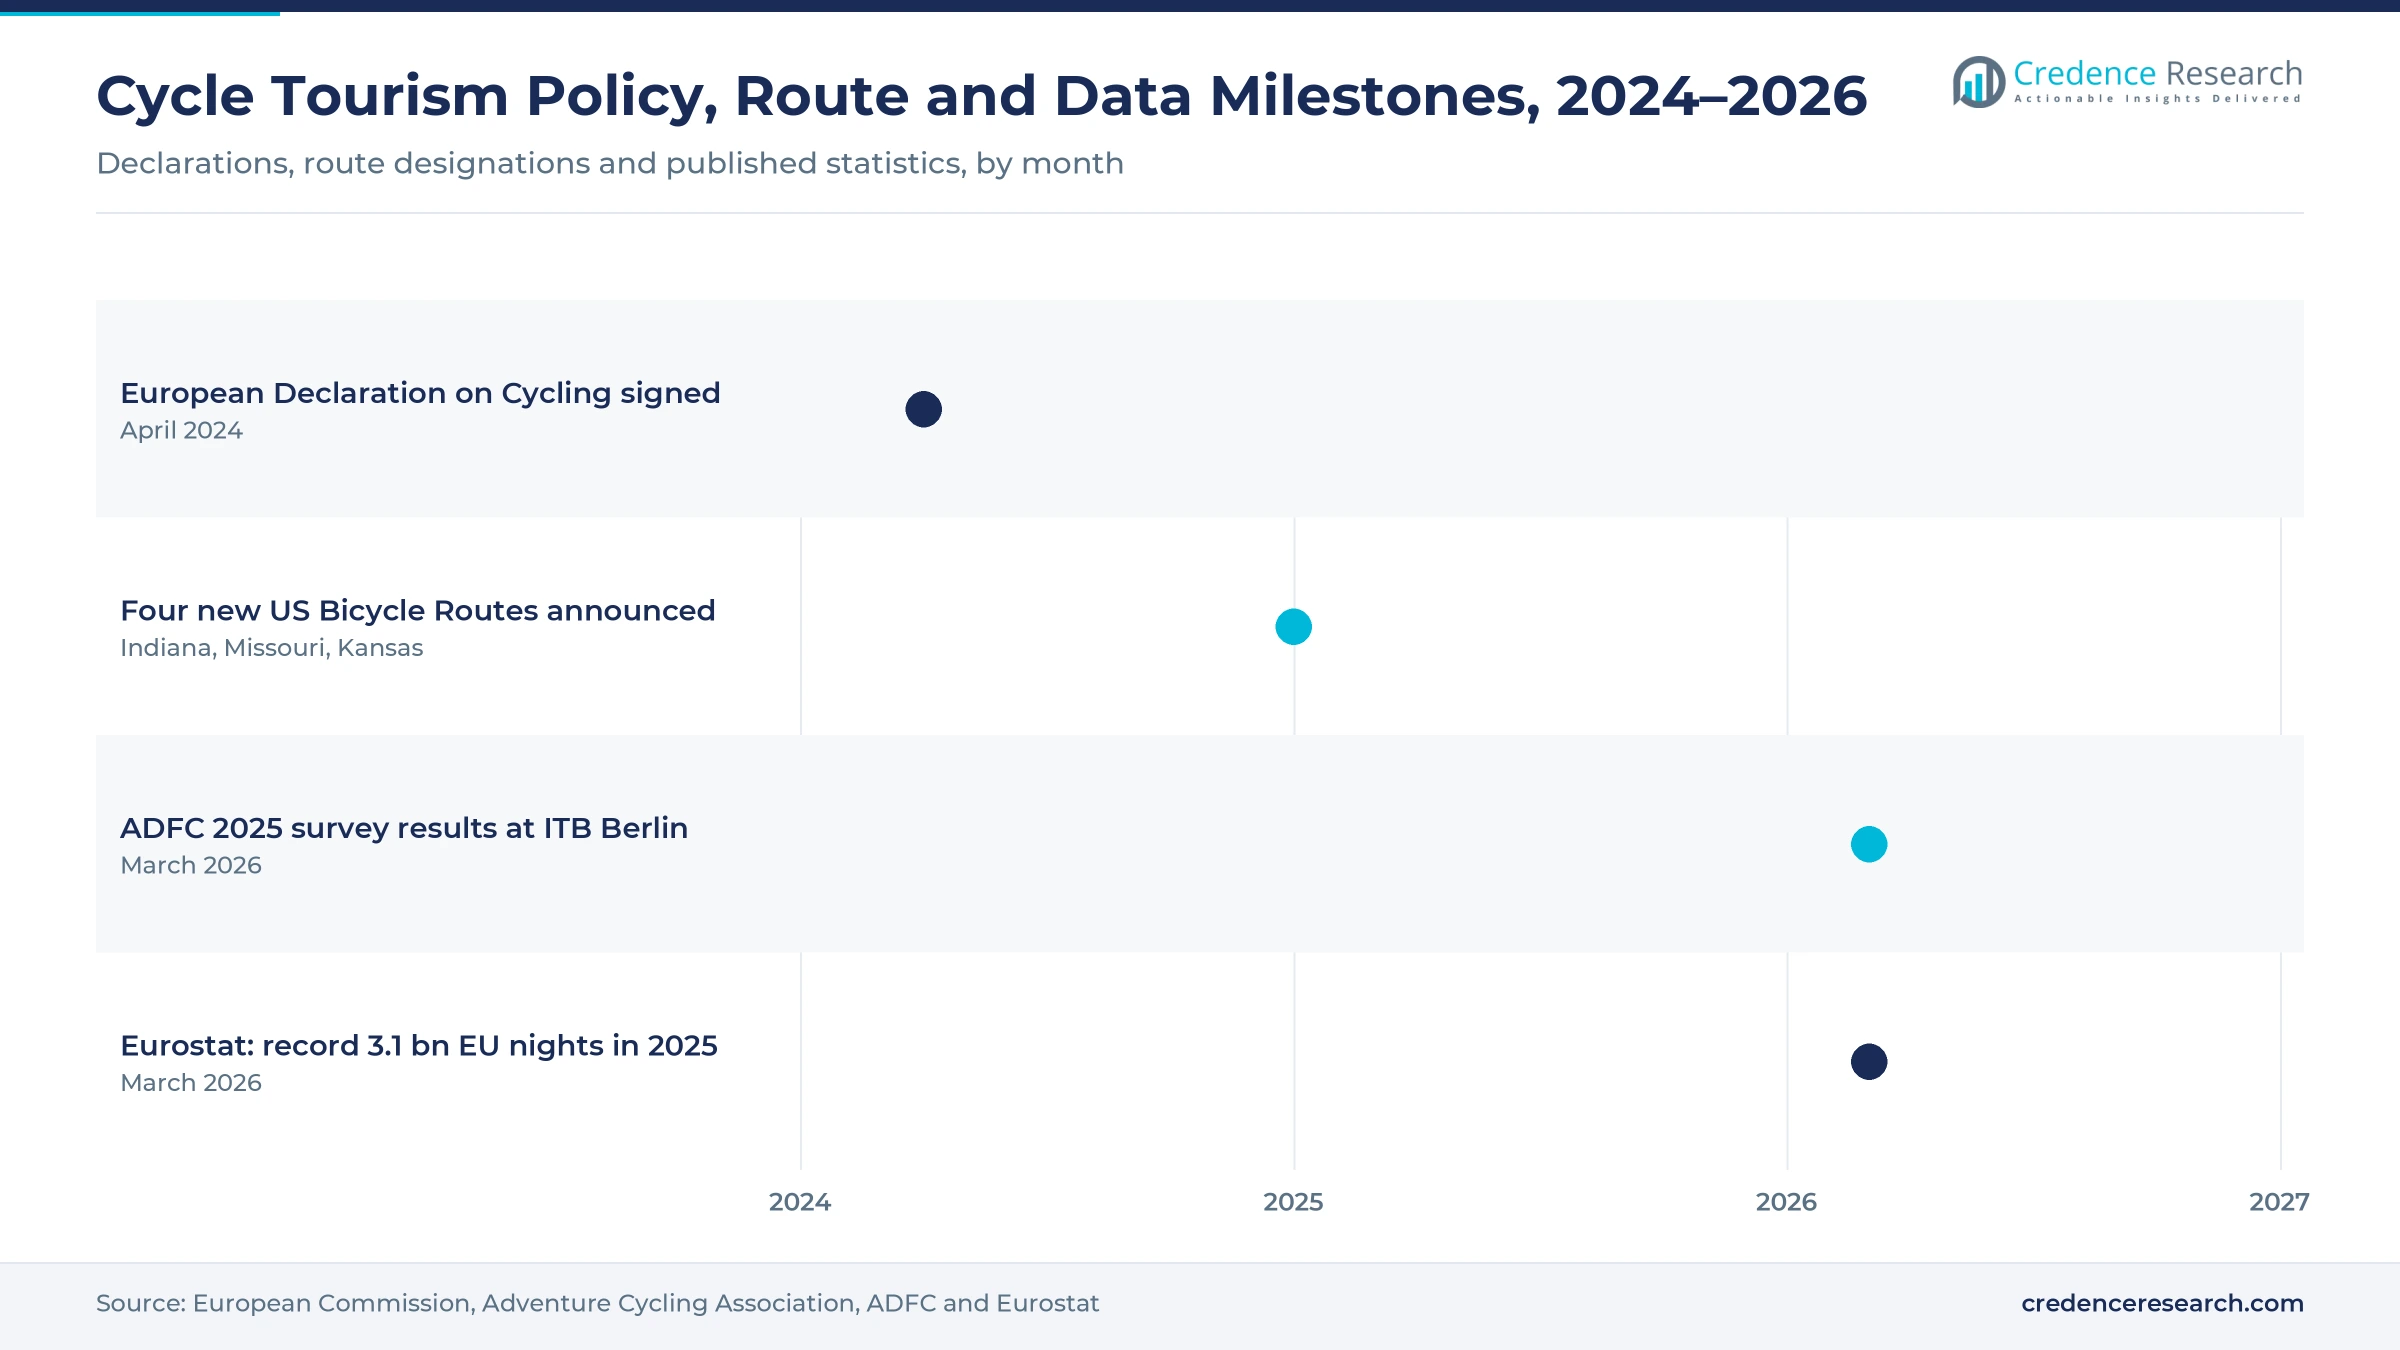
E-bike trips grow at 9.25% a year, yet many riders do not bring their own electric bike. Hire fleets at railway stations, in Alpine valleys and in wine regions fill that gap, and hotels that offer secure storage and charging win repeat bookings. Operators that bundle e-bike rental, luggage transfer and app navigation can capture a larger share of each traveler's budget, though fleets need steady battery and repair capacity.
Opportunity: Asia Pacific routes and gravel adventures
Asia Pacific is the fastest-growing region at 7.57% a year. Japan, Taiwan and South Korea promote national cycle routes, and Australia and New Zealand market rail-trails to domestic and international visitors. Gravel bikes also let riders combine quiet roads and unpaved tracks, overlapping with the adventure tourism market. Operators that translate the European self-guided model into these destinations can enter early, although local hotel and luggage networks take several seasons to build.
Traffic danger, patchy route quality and short riding seasons cap cycle holiday revenue
Mixed traffic on busy roads deters new riders
Many potential cycle tourists will not ride alongside fast traffic, and families and first-time riders are the most cautious. Routes with long mixed-traffic stretches lose visitors to destinations with separated paths, which cuts bookings for hotels and operators along those corridors. Regions mitigate the risk by converting old railway lines into traffic-free trails, adding signed detours and publishing route-quality ratings, which lets operators replace risky stages with safer itineraries and protect repeat bookings from cautious riders.
Uneven signage, surfaces and bike-friendly lodging outside leading regions
Route quality varies widely between countries. Gaps in signage, surfaces, secure parking and charging points, plus few hotels that welcome bikes, limit growth outside Europe's core networks. Operators face higher support costs and weaker reviews on such routes, which slows package launches. The fix lies in public route certification, of the kind EuroVelo applies across its 17 routes, and in hotel certification schemes that list bike storage, drying rooms and early breakfasts, which give riders confidence and help operators open new routes.
Short riding seasons and heat waves squeeze operator margins
Most cycle trips take place from spring to early autumn. Tour operators, hire shops and guesthouses carry fixed costs through the quiet months, which squeezes margins and makes it hard to keep trained guides. Heat waves in southern Europe also push riders to shift dates or destinations. Operators mitigate the risk with shoulder-season pricing, southern-hemisphere and winter-sun products, and routes at higher altitude, which spread bookings across more of the year.
Bike carriage rules and rising lodging prices add trip cost
Limited bike spaces on long-distance trains, airline fees for bike boxes and rising hotel prices add cost and friction to each trip. Independent riders, who account for 56.0% of 2025 spending, feel these costs most because they travel with their own bikes. Rail operators that reserve more bike spaces and destinations that provide hire fleets at arrival stations reduce the barrier and keep one-way, point-to-point trips viable for riders who prefer not to drive.
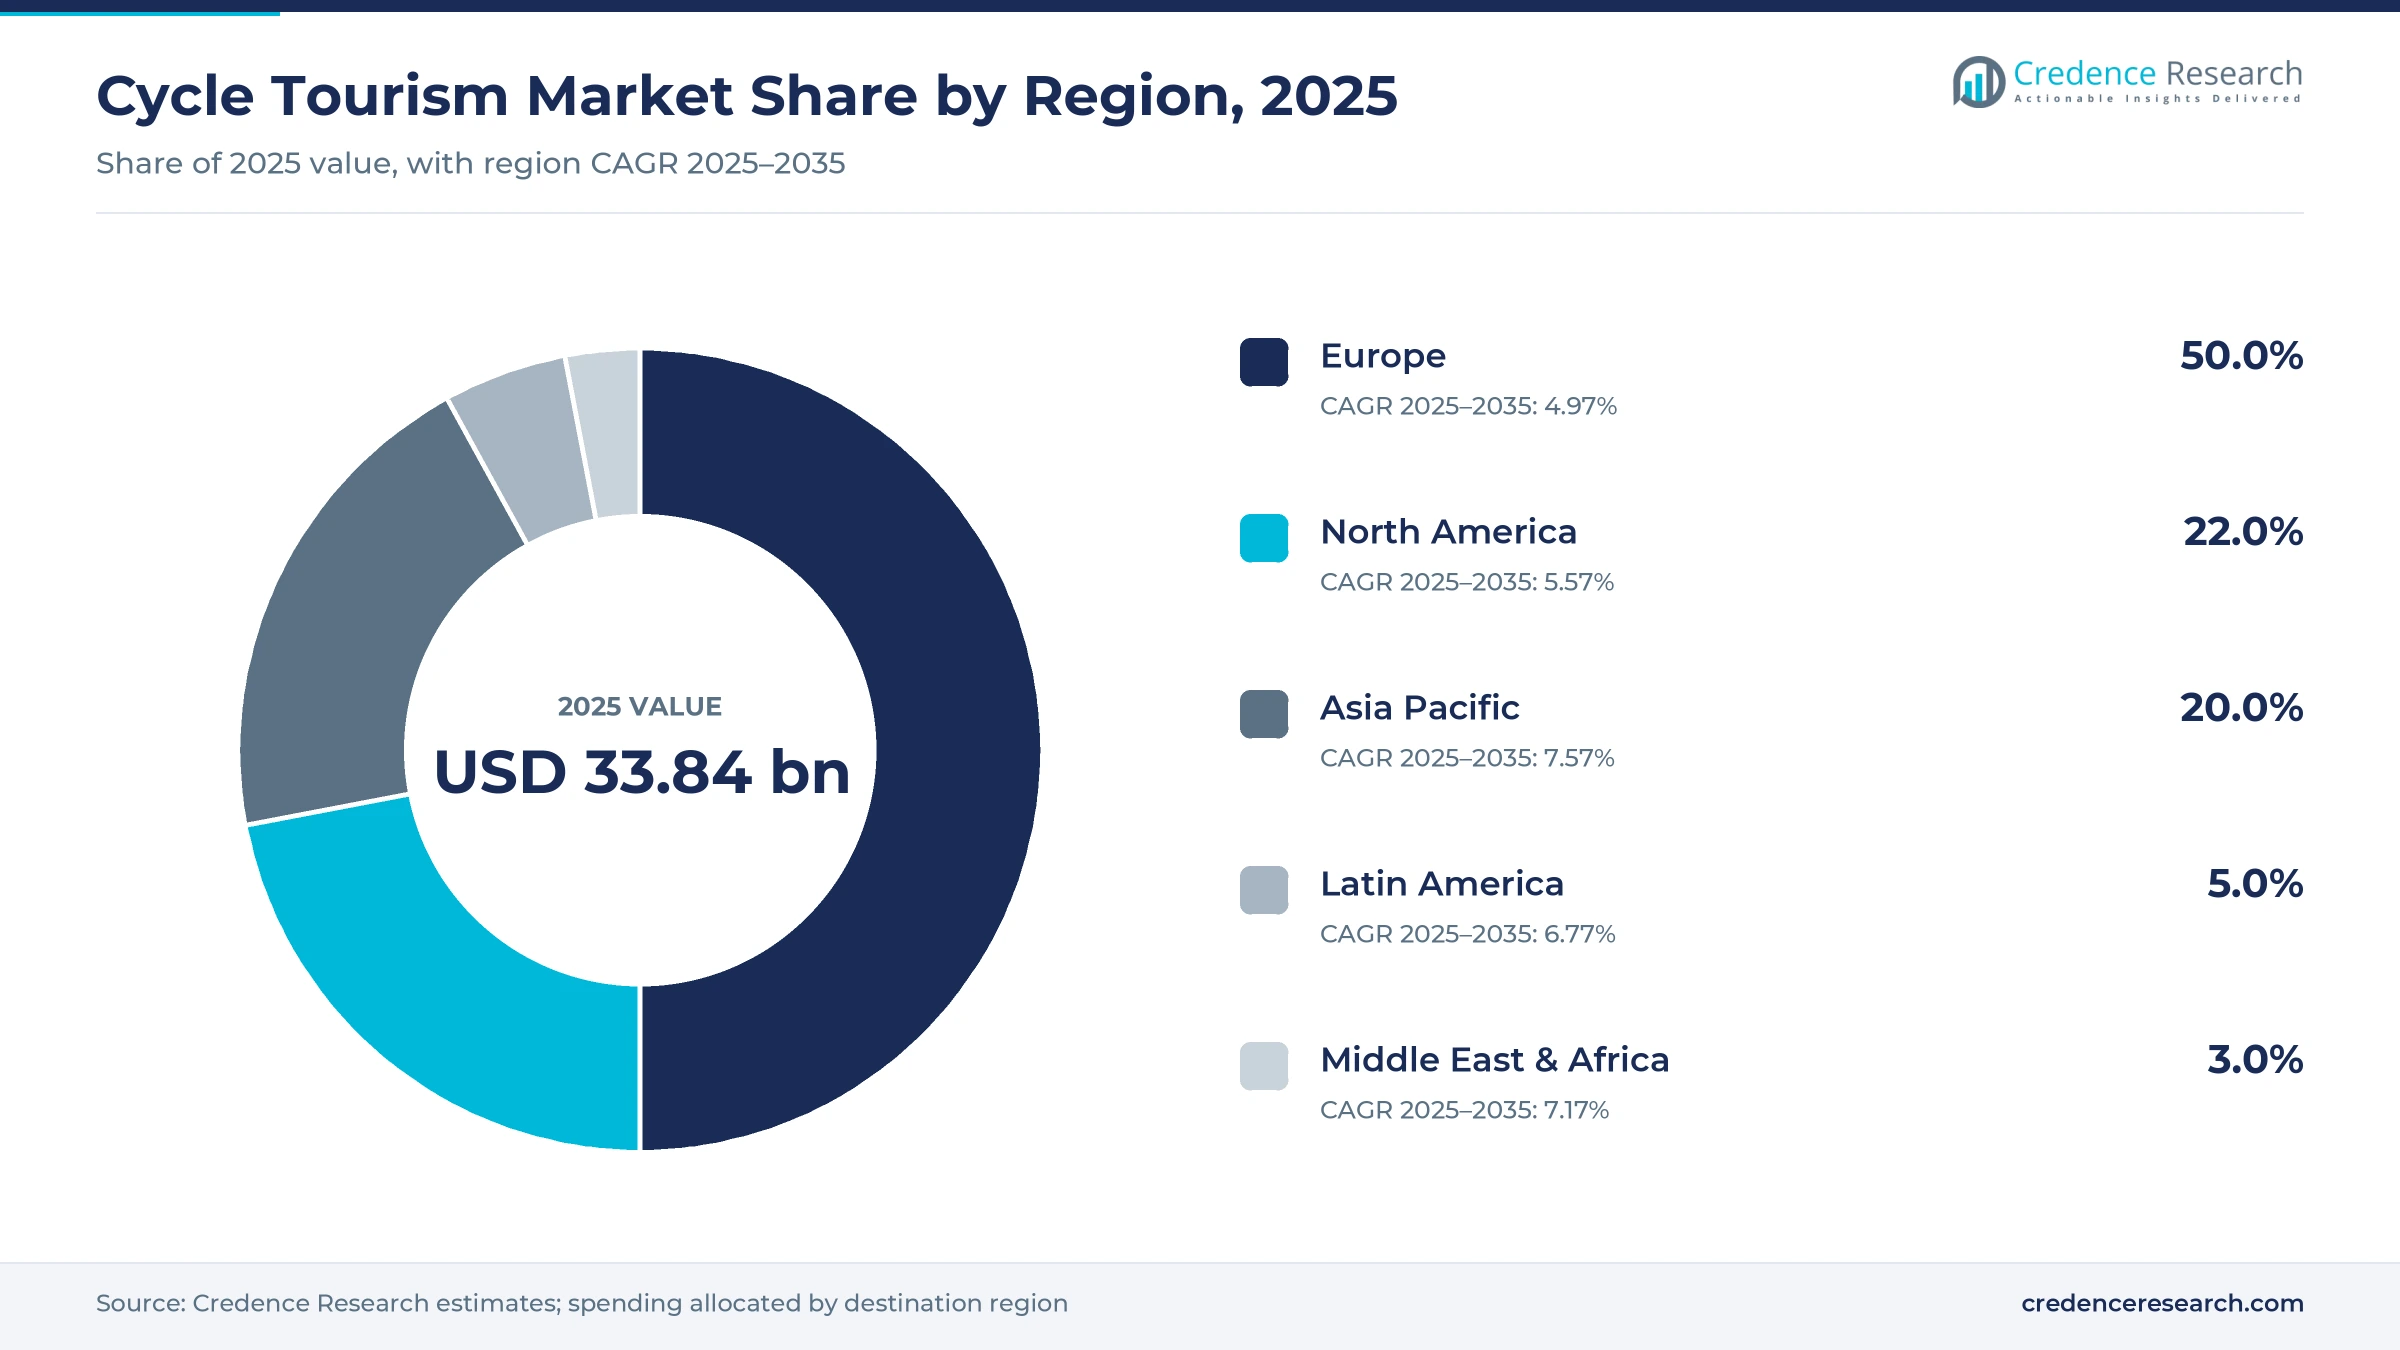
Europe anchors bike holiday spending on dense route networks while Asia Pacific expands fastest
| Region | Share, 2025 | CAGR, 2025–2035 |
|---|---|---|
| Europe | 50.0% | 4.97% |
| North America | 22.0% | 5.57% |
| Asia Pacific | 20.0% | 7.57% |
| Latin America | 5.0% | 6.77% |
| Middle East & Africa | 3.0% | 7.17% |
Europe: Dense networks and German riders anchor demand
Europe held 50.0% of 2025 spending and grows at 4.97% a year. Germany, the Netherlands, France, Austria and Italy have dense route networks, and EuroVelo's 17 routes link them across borders. Germany is the largest source market, and nearly 60% of its riders on longer trips stay in the country. Record EU tourist nights in 2025 support hotel capacity along routes. Slower growth reflects maturity, but e-bike adoption keeps spending per rider rising.
North America: National bicycle routes and rail-trails widen the map
North America held 22.0% of 2025 spending and grows at 5.57% a year. The U.S. Bicycle Route System spans more than 24,000 miles in 35 states and Washington, D.C., and four new routes in Indiana, Missouri and Kansas were announced in January 2025. Long rail-trails attract families, and Quebec's route network draws riders across Canada. Premium guided operators such as Backroads and Trek Travel serve riders from the region, and many long-haul trips to Europe start here.
Asia Pacific: National routes and rail-trails drive the fastest growth
Asia Pacific held 20.0% of 2025 spending and is the fastest-growing region at 7.57% a year. Japan, Taiwan and South Korea promote national cycle routes, and Australia and New Zealand have popular rail-trails that small towns market as destinations. Rising domestic travel and inbound tourism support self-guided and guided products, and the growth overlaps with nature-based ecotourism. Hotel and luggage networks remain thinner than in Europe, which leaves room for operators.
Latin America and Middle East & Africa: Guided adventures from a small base
Latin America held 5.0% of 2025 spending and grows at 6.77% a year, with guided tours in Patagonia, Peru and Costa Rica. The Middle East & Africa held 3.0% and grows at 7.17% a year, led by Morocco, South Africa and new routes in the Gulf. Both depend on long-haul visitors and guided formats, so operators carry more of the logistics.
Record EU tourist nights, a German rider survey and new U.S. Bicycle Routes, 2024–2026
| Development | Status and market relevance |
|---|---|
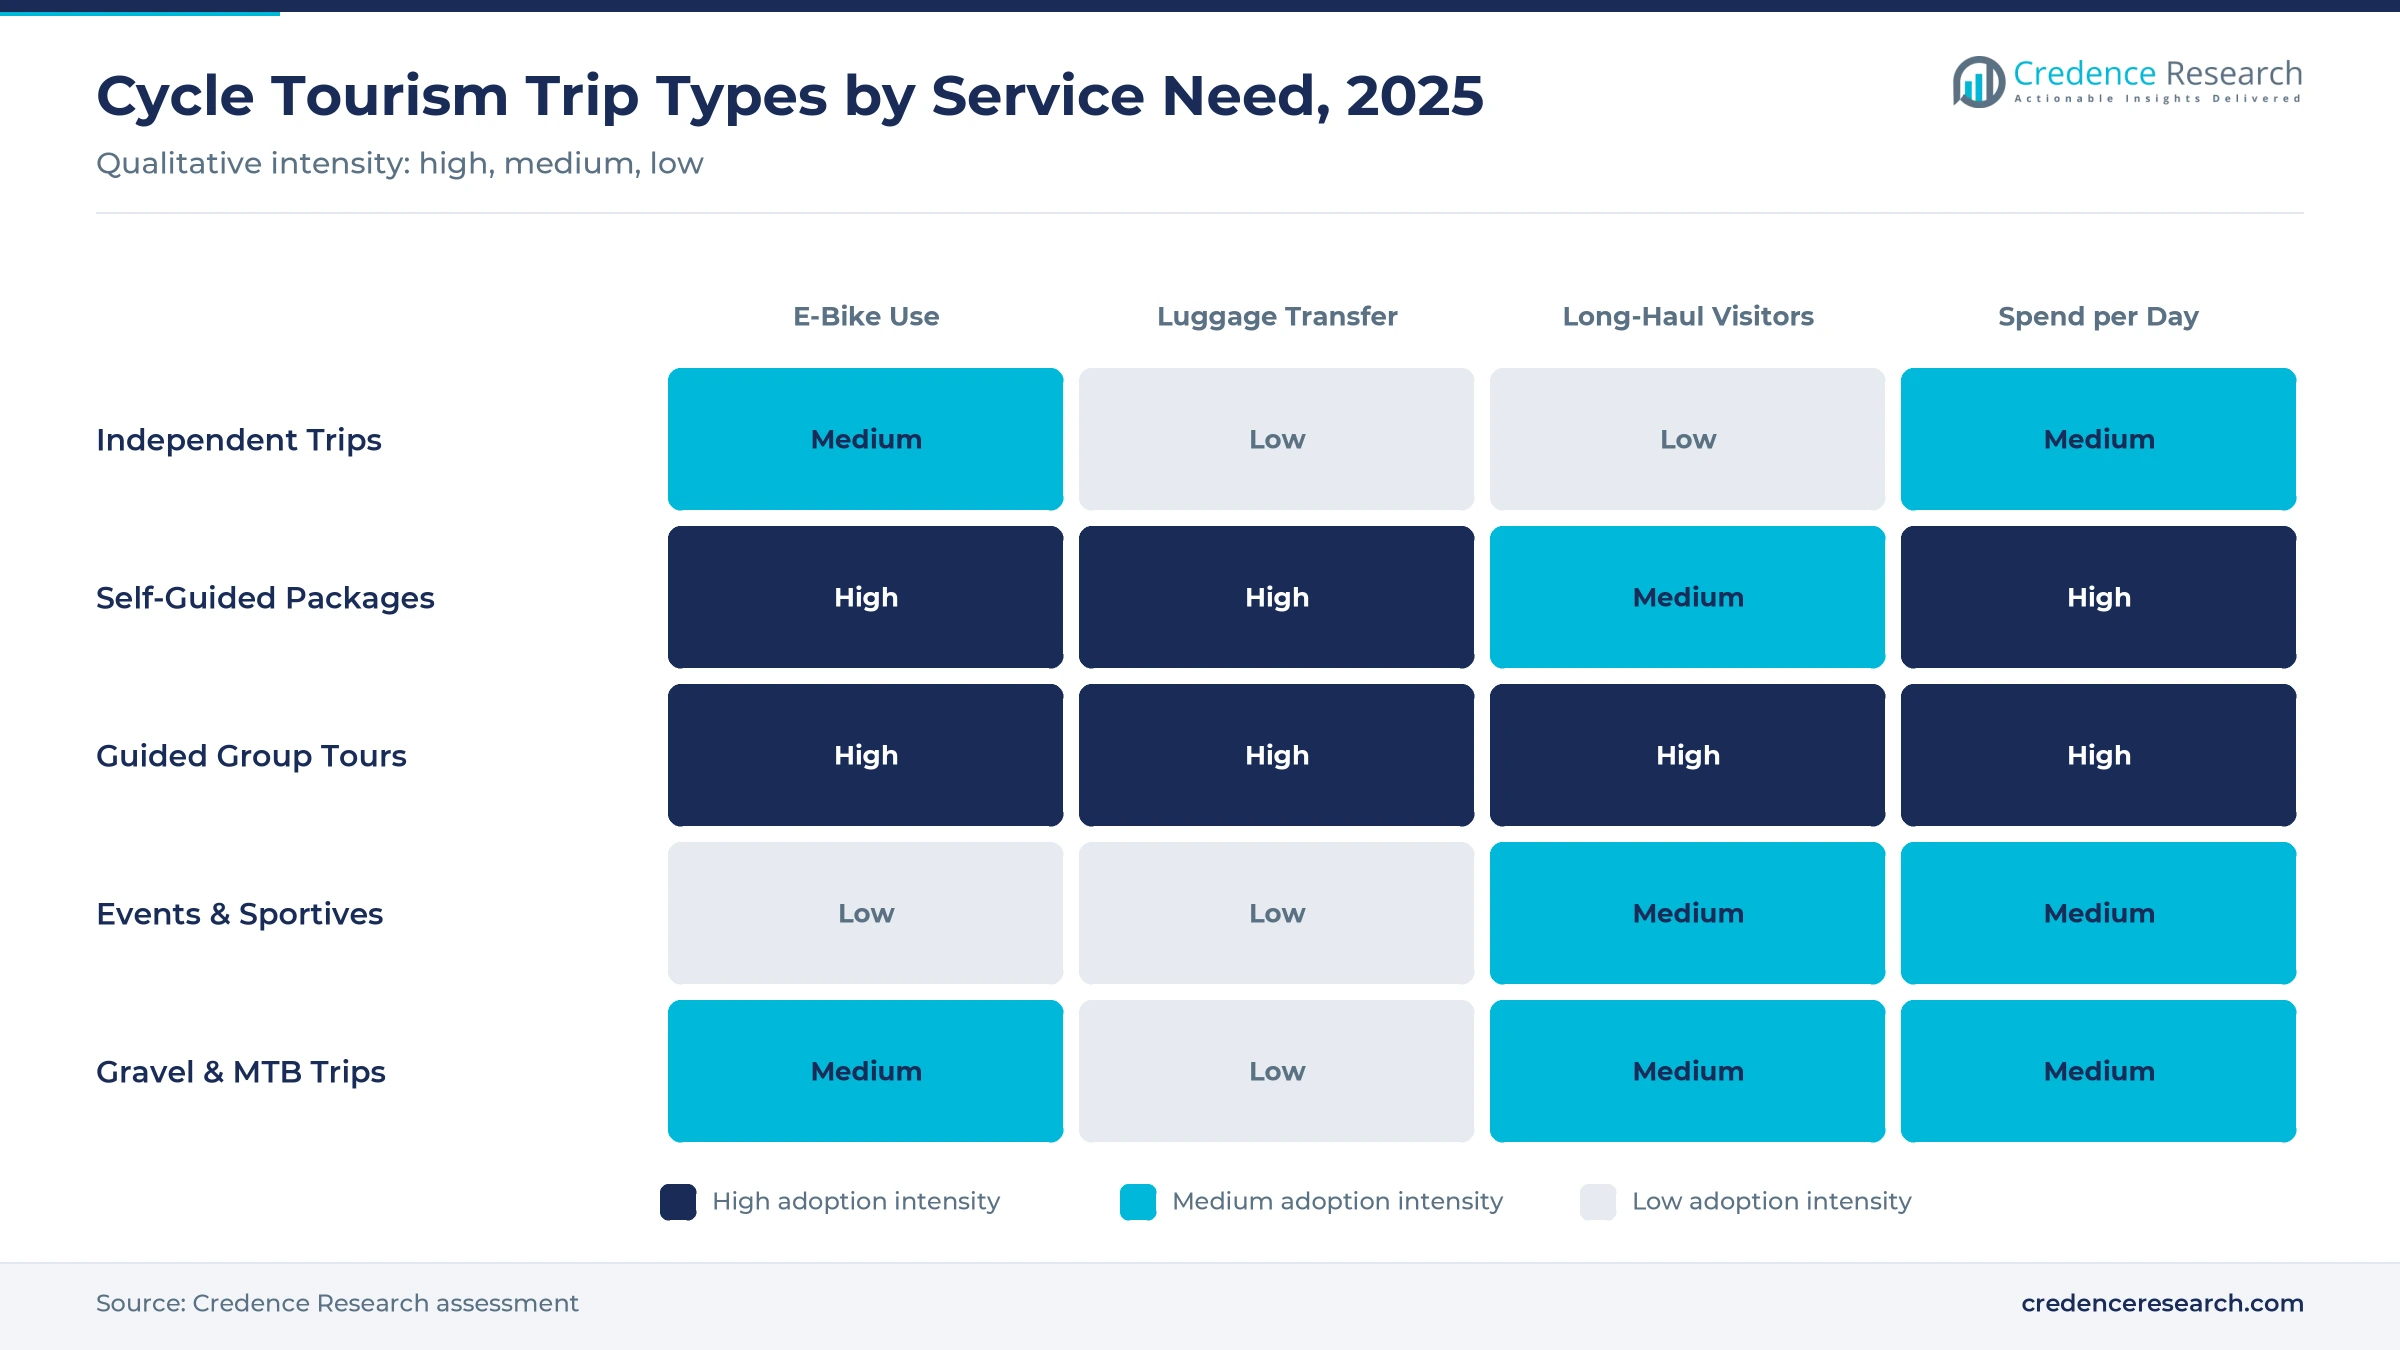
| In March 2026, Eurostat announced that 2025 was another record year for EU tourism, with nearly 3.1 billion nights in tourist accommodation, up 2.2% on 2024. | Published. Confirms the travel base behind cycle trips. |
| In March 2026, the German cyclists' federation ADFC unveiled its 2025 travel bike analysis at ITB Berlin, based on more than 17,300 responses. | Published. Shows more than half of longer-trip riders on e-bikes. |
| In January 2025, Adventure Cycling Association announced four new U.S. Bicycle Routes in Indiana, Missouri and Kansas. | Designated. Extends the signed network in North America. |
| In April 2024, the European Parliament, Council and Commission signed the European Declaration on Cycling. | Signed. Puts cycling, including cycle tourism, on the EU agenda. |
Pedal-assist drivetrains, route apps and rail-bike links shape bike travel to 2035
- Pedal-assist drivetrains: Longer-range batteries and lighter motors let riders cover longer daily stages on hilly routes, which widens the customer base for rental fleets.
- Route apps and GPS tracks: Navigation apps, downloadable tracks and live route-quality data make self-guided and independent trips easier to plan and change on the road.
- Booking and luggage platforms: Online platforms that combine hotels, bag transfer and bike hire turn multi-stop trips into a single booking.
- Rail-bike integration: Reserved bike spaces on long-distance trains support one-way trips and reduce car use to reach a route.
- Policy and certification: The European Declaration on Cycling and route certification schemes set quality standards that guide public investment.
Need a Custom Version of This Report?
Tailor the scope, geography, or segments to your exact requirements.
- Custom geography or segment scope
- Direct access to our analyst team
Premium tour brands, self-guided specialists and thousands of local hosts share the cycling traveler
Cycle tourism is fragmented. Thousands of small hotels, hire shops and local guides serve riders on the ground, while a smaller group of specialist tour operators sells packages across countries. Premium guided-tour operators such as Backroads and Trek Travel compete on service, support vans and curated hotels in North America and Europe. Intrepid Travel and Exodus Adventure Travels sell cycling trips alongside wider adventure catalogs. Eurobike and Austria Radreisen are self-guided specialists in Central Europe, while DuVine Cycling + Adventure Co. and Butterfield & Robinson target the luxury end. Route bodies, including the European Cyclists' Federation for EuroVelo and Adventure Cycling Association in the U.S., shape where riders go. Entry barriers are low for local firms but higher for operators that need hotel contracts on many routes. No operator publishes cycle tourism sales on a comparable basis, so no share ranking is given.
Companies profiled and their roles
| Company | Type | Role in the market |
|---|---|---|
| Backroads | Premium tour operator | Premium guided cycling tours in North America and Europe |
| Trek Travel | Premium tour operator | Premium guided cycling tours in North America and Europe |
| Intrepid Travel | Adventure tour operator | Cycling trips in many countries within a wider adventure catalog |
| Exodus Adventure Travels | Adventure tour operator | Cycling trips in many countries within a wider adventure catalog |
| Eurobike | Self-guided specialist | Self-guided cycle tours in Central Europe |
| Austria Radreisen | Self-guided specialist | Self-guided cycle tours in Central Europe |
| DuVine Cycling + Adventure Co. | Luxury tour operator | Luxury cycling tours |
| Butterfield & Robinson | Luxury tour operator | Luxury cycling tours |
Analyst viewpoint: Pedal assist turns bike holidays into mainstream slow travel
Credence Research's view is that electric assist has turned cycle tourism from a niche for fit enthusiasts into a mainstream form of slow travel, especially in Europe. The largest new spending sits in self-guided packages and e-bike trips, where operators can bundle hotels, luggage transfer and rental bikes. Firms that hold hotel contracts on popular routes and run reliable e-bike fleets are best positioned. The main risk is cost: rising lodging prices and heat waves could shorten trips. Operators and destinations should watch e-bike adoption, rail bike capacity and new route certifications.
Trip counts, nights and daily outlays behind the cycle holiday estimate
The report uses 2025 as the base year and forecasts to 2035, with CAGR calculated over 2025–2035. Values are in USD at current prices and allocated to the destination region. Market values come from Credence Research's market model, built from overnight cycle trips, nights and daily spending; segment and regional splits are Credence Research estimates. Supporting evidence comes from official tourism statistics such as Eurostat, national cycling surveys such as the ADFC analysis, route-network information and operator websites. Data on cycle trips outside Europe is thinner, which limits precision there.
Outlook to 2035: Packaged freedom and electric assist set the pace of bike holidays
Through 2035, cycle tourism will tilt toward self-guided packages and e-bike trips, as riders pay for convenience while keeping their own pace. Shorter trips close to home will become more common, and rail links will matter more for reaching routes. Europe will remain the largest destination, while Asia Pacific gains share as national routes mature. Investment will flow to hire fleets, charging-ready lodging and route signage. The pace will depend on lodging prices, summer heat and how quickly new routes outside Europe reach European quality.
Frequently Asked Questions
What was the size of the cycle tourism market in 2025?
What is the forecast value and CAGR of the cycle tourism market?
What counts as cycle tourism spending?
Which region leads the cycle tourism market?
Which trip type leads cycle tourism spending?
How important are e-bikes for cycle tourism?
Who are the major companies in the cycle tourism market?
What challenges could slow the cycle tourism market?
Table of Content
Chapter 1 Market Segmentation
- 1.1 Segmentation Framework
- 1.1.1 Product and Service Classification
- 1.1.2 Application and End-Use Classification
- 1.1.3 Technology and Solution Classification
- 1.1.4 Customer and Distribution Channel Classification
- 1.1.5 Geographic Segmentation
- 1.1.6 Market Segment Definitions and Boundaries
- 1.2 By Trip Type
- 1.2.1 Independent Cycling Trips
- 1.2.2 Self-Guided Tour Packages
- 1.2.3 Guided Group Tours
- 1.2.4 Cycling Events & Sportives
- 1.3 By Bike Type
- 1.3.1 Conventional Touring & Trekking Bikes
- 1.3.2 E-Bikes
- 1.3.3 Road Bikes
- 1.3.4 Mountain & Gravel Bikes
Chapter 2 Introduction
- 2.1 Report Objectives and Scope
- 2.2 Product Definition and Industry Terminology
- 2.3 Market Inclusions and Exclusions
- 2.4 Research Process
- 2.4.1 Primary Research and Expert Interviews
- 2.4.2 Secondary Research and Source Review
- 2.4.3 Top-Down and Bottom-Up Estimation
- 2.4.4 Data Triangulation and Verification
- 2.5 Market Size Measurement Basis
- 2.5.1 2025: USD 33.84 billion → 2035: USD 59.62 billion
- 2.6 Historical and Forecast Reference Periods
- 2.6.1 Historical Period: 2018-2025
- 2.6.2 Base Year: 2025
- 2.6.3 Forecast Period: 2025-2035
- 2.7 Research Assumptions and Limitations
Chapter 3 Executive Summary
- 3.1 Market Snapshot and Key Findings
- 3.2 Base-Year Market Size, 2025
- 3.3 Forecast Market Size, 2035
- 3.4 Revenue and Volume Growth Outlook
- 3.5 Key Demand and Supply Indicators
- 3.6 Leading Market Segments
- 3.7 Fastest-Growing Market Opportunities
- 3.8 Regional Performance Highlights
- 3.9 Technology and Industry Transformation
- 3.10 Competitive Landscape Summary
- 3.11 Analyst View and Strategic Implications
Chapter 4 Global Cycle Tourism Market Trends and Developments
- 4.1 Historical Industry Development, 2018-2025
- 4.2 Recent Market Trends and Developments
- 4.3 Demand and Customer Behavior Trends
- 4.4 Technology and Product Innovation
- 4.5 Artificial Intelligence, Automation and Digitalization
- 4.6 Local Manufacturing and Supply Chain Realignment
- 4.7 Industry Partnerships, Mergers and Acquisitions
- 4.8 Sustainability and Circular Economy Developments
- 4.9 Government and Private Sector Investment Trends
- 4.10 Emerging Business Models and Commercialization
- 4.11 Industry Developments and Announcements
Chapter 5 Global Cycle Tourism Market Supply and Demand Analysis
- 5.1 Demand Trend and Consumption Analysis, 2018-2025
- 5.2 Demand Forecast, 2025-2035
- 5.3 Supply Chain Structure and Procurement Trends
- 5.4 Supply-Demand Gap and Bottlenecks
- 5.5 Import Dependence and Sourcing Structure
- 5.6 Regional Supply and Demand Concentration
Chapter 6 Global Cycle Tourism Market Pricing Analysis
- 6.1 Pricing Structure and Measurement
- 6.2 Historical Pricing Trends, 2018-2025
- 6.3 Pricing Outlook, 2025-2035
- 6.4 Pricing by Product and Market Segment
- 6.5 Geographic Pricing Differences
- 6.6 Key Input, Energy, Labor and Logistics Costs
- 6.7 Contract Pricing and Purchasing Models
- 6.8 Pricing Sensitivity and Competitive Positioning
- 6.9 Price, Margin and Profitability Implications
Chapter 7 Global Cycle Tourism Market Dynamics
- 7.1 Market Growth Drivers
- 7.1.1 Demand-Side Drivers
- 7.1.2 Technology and Innovation Drivers
- 7.1.3 Infrastructure and Investment Drivers
- 7.1.4 Regulatory and Policy Drivers
- 7.2 Market Restraints
- 7.2.1 Cost and Affordability Constraints
- 7.2.2 Technology and Adoption Barriers
- 7.2.3 Supply Chain and Operational Constraints
- 7.3 Market Challenges
- 7.3.1 Competitive Pressure and Margin Erosion
- 7.3.2 Skills, Infrastructure and Implementation Gaps
- 7.4 Emerging Market Opportunities
- 7.5 Market Dynamics Impact and Time-Horizon Assessment
Chapter 8 Global Cycle Tourism Value Chain Analysis
- 8.1 Industry Value Chain Overview
- 8.2 Upstream Suppliers and Critical Inputs
- 8.3 Technology and Component Providers
- 8.4 Manufacturing or Service Delivery
- 8.5 Distribution, Channel Partners and Integrators
- 8.6 Downstream Applications and End Users
- 8.7 Value Addition and Profit Pools
- 8.8 Vertical Integration and Outsourcing
- 8.9 Supplier Concentration and Risk
- 8.10 Supply Chain Localization and Resilience
Chapter 9 Global Cycle Tourism Market Regulations and Policies
- 9.1 Relevant Laws, Standards and Compliance Frameworks
- 9.2 Product, Service, Safety and Quality Requirements
- 9.3 Government Policies, Incentives and Subsidies
- 9.4 Imports, Exports and Trade Barriers
- 9.5 Public Procurement and Local Content Requirements
- 9.6 Data Protection, AI and Cybersecurity Compliance
- 9.7 Upcoming Policy Changes and Market Implications
Chapter 10 Global Cycle Tourism Market Hotspots and Opportunities
- 10.1 Market Opportunity Mapping and Growth Hotspots
- 10.2 High-Growth Applications and Customer Groups
- 10.3 Underserved Markets and White-Space Opportunities
- 10.4 Emerging Technology and Product Opportunities
- 10.5 New Capacity and Investment Hotspots
- 10.6 Market Entry and Expansion Opportunities
- 10.7 Distribution and Partnership Opportunities
- 10.8 Near-Term and Long-Term Commercial Potential
- 10.9 Opportunity Attractiveness and Execution Risks
Chapter 11 Global Cycle Tourism Market Outlook, 2025-2035
- 11.1 Market Size and Analysis
- 11.1.1 Revenue (Market Measurement: 2025: USD 33.84 billion → 2035: USD 59.62 billion)
- 11.1.2 Historical Market Size, 2018-2025
- 11.1.3 Base-Year Market Size, 2025
- 11.2 Market Forecast, 2025-2035
- 11.2.1 Revenue Forecast to 2035
- 11.2.2 CAGR and Year-on-Year Growth
- 11.2.3 Incremental Revenue Opportunity
- 11.3 Forecast Assumptions and Scenario Analysis
- 11.3.1 Base-Case Forecast
- 11.3.2 Optimistic and Conservative Scenarios
- 11.3.3 Technology, Pricing and Policy Sensitivities
- 11.4 Market Attractiveness and Growth Outlook
Chapter 12 Global Cycle Tourism Market Segmentation and Outlook
- 12.1 Segmentation Summary and Market Shares, 2025
- 12.2 Largest and Fastest-Growing Segments
- 12.3 By Trip Type - Market Size and Forecast, 2025-2035
- 12.3.1 Segment Definition and Scope
- 12.3.2 Historical Market Size, 2018-2025
- 12.3.3 Revenue Forecast, 2025-2035
- 12.3.4 Base-Year Market Share, 2025
- 12.3.5 Segment CAGR and Growth Drivers
- 12.3.6 Subsegment Market Size and Forecast
- 12.3.6.1 Independent Cycling Trips
- 12.3.6.2 Self-Guided Tour Packages
- 12.3.6.3 Guided Group Tours
- 12.3.6.4 Cycling Events & Sportives
- 12.3.7 Subsegment Pricing and Adoption Trends
- 12.3.8 Leading Suppliers and Competition
- 12.3.9 Regional Demand and Opportunities
- 12.4 By Bike Type - Market Size and Forecast, 2025-2035
- 12.4.1 Segment Definition and Scope
- 12.4.2 Historical Market Size, 2018-2025
- 12.4.3 Revenue Forecast, 2025-2035
- 12.4.4 Base-Year Market Share, 2025
- 12.4.5 Segment CAGR and Growth Drivers
- 12.4.6 Subsegment Market Size and Forecast
- 12.4.6.1 Conventional Touring & Trekking Bikes
- 12.4.6.2 E-Bikes
- 12.4.6.3 Road Bikes
- 12.4.6.4 Mountain & Gravel Bikes
- 12.4.7 Subsegment Pricing and Adoption Trends
- 12.4.8 Leading Suppliers and Competition
- 12.4.9 Regional Demand and Opportunities
- 12.5 Segment Growth Comparison
- 12.6 Segment Attractiveness and Priority Matrix
Chapter 13 Global Cycle Tourism Geographic Market Outlook, 2025-2035
- 13.1 Regional Market Size and Share, 2025
- 13.2 Regional Market Forecast, 2025-2035
- 13.3 Regional Pricing, Production and Demand Differences
- 13.4 North America
- 13.4.1 United States
- 13.4.2 Canada
- 13.4.3 Mexico
- 13.5 Europe
- 13.5.1 Germany
- 13.5.2 France
- 13.5.3 Italy
- 13.5.4 United Kingdom
- 13.5.5 Spain
- 13.5.6 Poland
- 13.5.7 Russia
- 13.5.8 Netherlands
- 13.5.9 Belgium
- 13.5.10 Sweden
- 13.5.11 Denmark
- 13.5.12 Norway
- 13.5.13 Rest of Europe
- 13.6 Asia Pacific
- 13.6.1 China
- 13.6.2 India
- 13.6.3 Japan
- 13.6.4 South Korea
- 13.6.5 Thailand
- 13.6.6 Indonesia
- 13.6.7 Vietnam
- 13.6.8 Malaysia
- 13.6.9 Australia
- 13.6.10 Rest of Asia Pacific
- 13.7 Latin America
- 13.7.1 Brazil
- 13.7.2 Argentina
- 13.7.3 Colombia
- 13.7.4 Chile
- 13.7.5 Rest of Latin America
- 13.8 Middle East
- 13.8.1 Saudi Arabia
- 13.8.2 United Arab Emirates
- 13.8.3 Turkey
- 13.8.4 Israel
- 13.8.5 Iran
- 13.8.6 Rest of the Middle East
- 13.9 Africa
- 13.9.1 South Africa
- 13.9.2 Egypt
- 13.9.3 Nigeria
- 13.9.4 Morocco
- 13.9.5 Rest of Africa
- 13.10 Regional Investment, Policy and Supply Chain Differences
- 13.11 Regional Competitive Landscape
- 13.12 Geographic Growth Hotspots
Chapter 14 Global Cycle Tourism Technology, Innovation and Sustainability Outlook
- 14.1 Technology Landscape and Maturity
- 14.2 Product, Process and Service Innovation
- 14.3 AI, Automation and Digital Tools in the Industry
- 14.4 Technology Adoption and Performance Benchmarking
- 14.5 Innovation Pipeline and R&D Investment
- 14.6 Energy Efficiency and Resource Management
- 14.7 Sustainability, Recycling and Circularity
- 14.8 Technology Roadmap, 2025-2035
- 14.9 Risks of Obsolescence and Technology Substitution
Chapter 15 Global Cycle Tourism Market Key Strategic Imperatives
- 15.1 Growth and Market Entry Priorities
- 15.2 High-Return Products and Segments
- 15.3 Pricing, Profitability and Cost Optimization
- 15.4 Technology Investment and Product Differentiation
- 15.5 Supply Chain Localization and Resilience
- 15.6 Distribution and Customer Acquisition
- 15.7 Partnership, Acquisition and Capacity Strategy
- 15.8 Regional Expansion Priorities
- 15.9 Short-, Medium- and Long-Term Actions
Chapter 16 Competition Outlook
- 16.1 Industry Competition Characteristics
- 16.2 Market Structure and Concentration
- 16.3 Market Share and Competitive Positioning, 2025
- 16.4 Company-Wise Revenue and Product Benchmarking
- 16.5 Production and Service Capacity Benchmarking
- 16.6 Technology, Pricing and Differentiation
- 16.7 Regional Footprint and Distribution Strength
- 16.8 Mergers, Acquisitions and Strategic Alliances
- 16.9 New Entrants and Competitive Threats
- 16.10 Porter's Five Forces and Industry Attractiveness
- 16.11 Competitive Outlook, 2025-2035
Chapter 17 Company Profiles
- 17.1 Company Coverage and Selection Criteria
- 17.2 Backroads
- 17.2.1 Business Description
- 17.2.2 Company Ownership and Geographic Presence
- 17.2.3 Product and Service Portfolio
- 17.2.4 Manufacturing and Operating Footprint
- 17.2.5 Financial Performance and Investment
- 17.2.6 Market Share and Competitive Position
- 17.2.7 Technology and Innovation Capabilities
- 17.2.8 Strategic Alliances or Partnerships
- 17.2.9 Recent Developments
- 17.2.10 Growth Strategy and Outlook
- 17.3 Trek Travel
- 17.4 Intrepid Travel
- 17.5 Exodus Adventure Travels
- 17.6 Eurobike
- 17.7 Austria Radreisen
- 17.8 DuVine Cycling + Adventure Co.
- 17.9 Butterfield & Robinson
- 17.10 Other Relevant Market Participants
Note: Every listed company is profiled on the structure shown under the first company. The company list is preliminary and may change based on research findings, market developments, data availability and client requirements.
Chapter 18 Disclaimer
- 18.1 Research and Forecast Disclaimer
- 18.2 Data Source and Estimation Limitations
Note: The depth of individual sections depends on data availability for this market. Volume, capacity, trade and other unit-based metrics are included where applicable.