
Market Overview
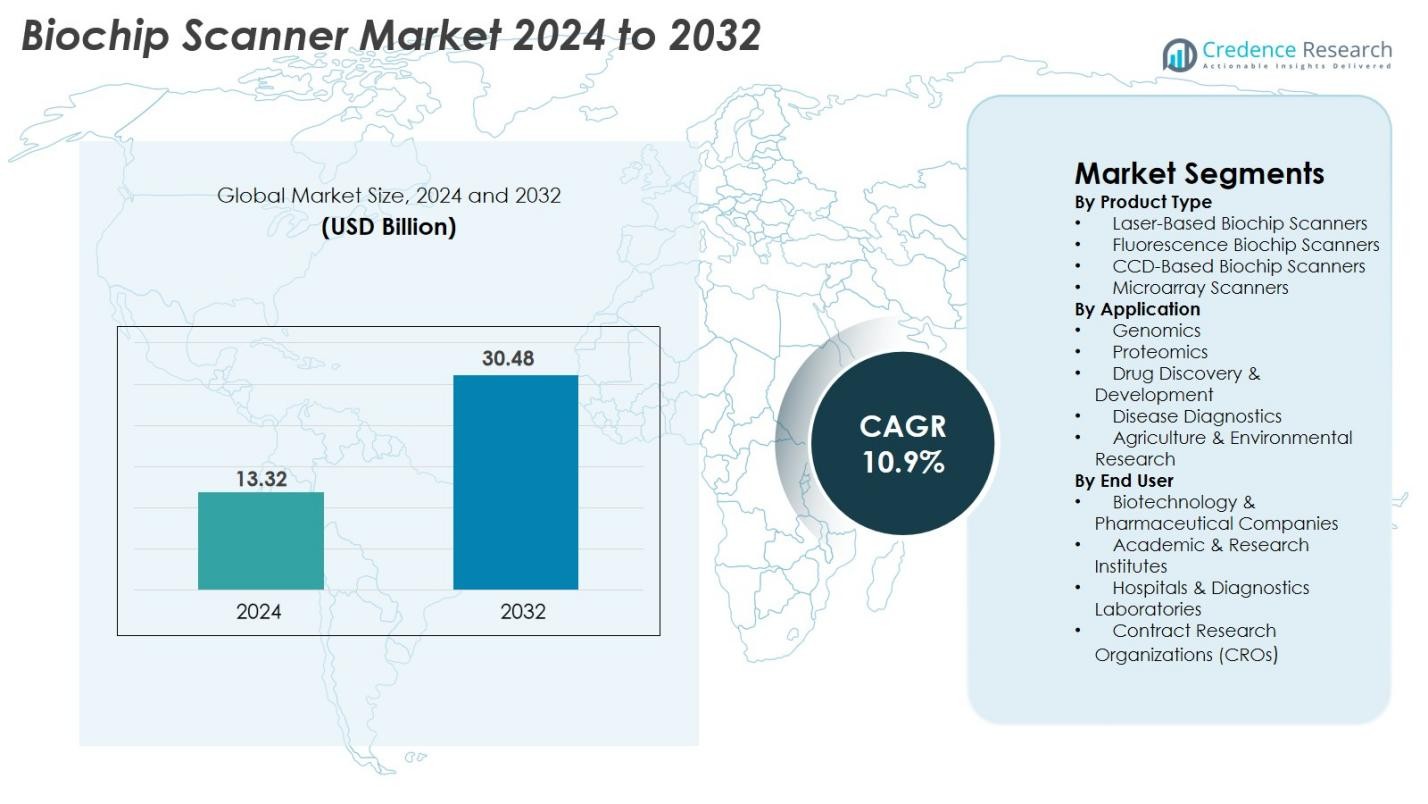
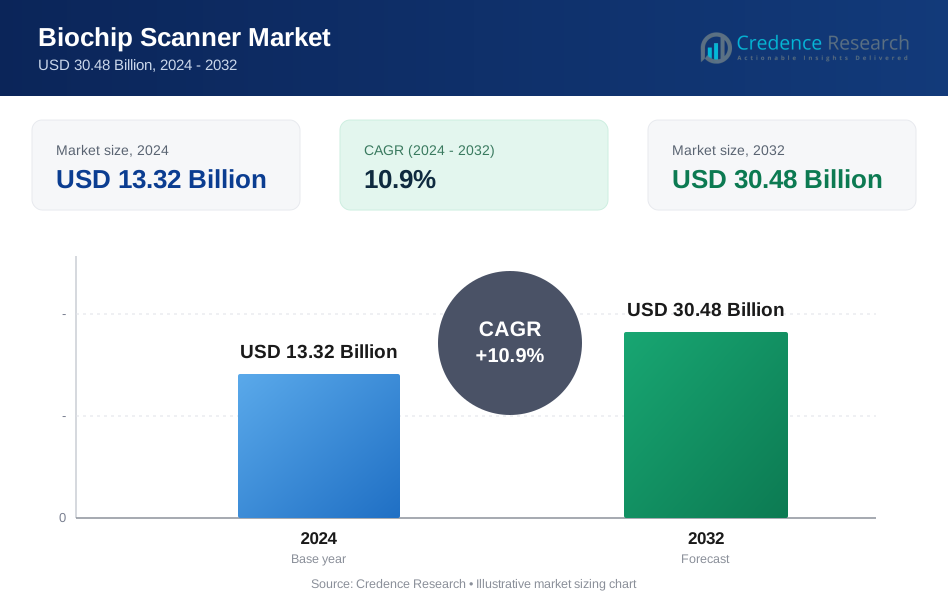
Biochip Scanner Market size was valued at USD 13.32 Billion in 2024 and is anticipated to reach USD 30.48 Billion by 2032, at a CAGR of 10.9% during the forecast period.
| REPORT ATTRIBUTE | DETAILS |
|---|---|
| Historical Period | 2020-2023 |
| Base Year | 2024 |
| Forecast Period | 2025-2032 |
| Biochip Scanner Market Size 2024 | USD 13.32 Billion |
| Biochip Scanner Market, CAGR | 10.9% |
| Biochip Scanner Market Size 2032 | USD 30.48 Billion |
The Biochip Scanner Market is shaped by major players such as Agilent Technologies, Illumina Inc., PerkinElmer Inc., Bio-Rad Laboratories Inc., GE HealthCare, Standard BioTools, Randox Laboratories Ltd., LI-COR Inc., IBIOCHIPS, and Cellix Ltd., all focusing on high-resolution imaging, automated fluorescence detection, and advanced microarray analysis. North America leads the market with a 38.4% share, supported by strong genomic research infrastructure and rapid adoption of precision medicine. Europe follows with 29.7%, driven by proteomics expansion and robust clinical diagnostics programs. Asia-Pacific holds 22.8%, emerging as the fastest-growing region due to rising biotechnology investments.
Market Insights
- The Biochip Scanner Market was valued at USD 13.32 Billion in 2024 and is projected to reach USD 30.48 Billion by 2032, expanding at a CAGR of 10.9% during the forecast period.
- Rising demand for genomics, proteomics, and diagnostic microarrays drives strong market growth, with increasing adoption across biotechnology companies, hospitals, and research institutes.
- AI-enabled image analytics, automation, and expanding use of microarrays in precision medicine represent major trends accelerating technology upgrades and workflow efficiencies.
- Key players such as Agilent Technologies, Illumina Inc., PerkinElmer Inc., Bio-Rad Laboratories Inc., GE HealthCare, and Standard BioTools strengthen competitiveness through innovation in fluorescence detection, high-resolution scanning, and advanced software integration.
- North America leads with 38.4% share, followed by Europe at 29.7% and Asia-Pacific at 22.8%, while Laser-Based Biochip Scanners dominate the product segment with a 38.6% share, supported by high-performance imaging capabilities.
Market Segmentation Analysis
By Product Type
The Biochip Scanner Market is led by Laser-Based Biochip Scanners, commanding 38.6% share in 2024, driven by their high-resolution imaging, rapid scanning capabilities, and suitability for high-density microarrays. Fluorescence biochip scanners also show strong adoption due to growing use in genomics and proteomics assays, while CCD-based scanners gain traction for cost-efficient applications. Microarray scanners maintain steady demand across academic and clinical environments. Increasing R&D investments, the rise of multiplexed detection platforms, and expanding use of microarray analysis in precision medicine collectively support product-level growth.
- For instance, Agilent Technologies’ SureScan Microarray Scanner delivers 3-micron resolution, enabling reliable detection across over 1 million probes on high-density arrays, supporting global adoption in translational genomics workflows.
By Application
The Genomics segment dominates the Biochip Scanner Market with 41.3% share in 2024, primarily fueled by expanding use of microarray analysis, gene expression profiling, and SNP genotyping in research and clinical diagnostics. Proteomics applications continue to grow due to rising interest in protein interaction studies and biomarker discovery. Drug discovery and development benefit from accelerated screening workflows, while disease diagnostics witness increased adoption in oncology, infectious diseases, and personalized medicine. Agriculture and environmental research segments expand gradually as biochips support pathogen detection and crop-trait analysis.
- For instance, Illumina’s Infinium Global Screening Array supports over 700,000 markers per sample, enabling high-resolution SNP genotyping widely used in population genetics and clinical genomics programs worldwide.
By End User
Biotechnology & Pharmaceutical Companies hold the largest share of the Biochip Scanner Market at 44.7% in 2024, driven by rising investments in drug discovery, biomarker validation, and advanced genomic analysis. Academic & research institutes remain strong contributors, supported by government-funded genomic programs and expanding translational research. Hospitals and diagnostics laboratories increasingly adopt biochip scanners for early disease detection and precision diagnostics. Contract Research Organizations (CROs) gain momentum as outsourcing of genomics and proteomics studies rises. Growing demand for high-throughput platforms and rapid analytical workflows further strengthens end-user adoption.
Key Growth Drivers
Rising Demand for Genomics and Precision Medicine
The rapid expansion of genomics research and precision medicine strongly accelerates the growth of the Biochip Scanner Market. Increasing adoption of gene expression profiling, SNP genotyping, and whole-genome biomarker studies drives high utilization of advanced biochip scanners across pharmaceutical companies, academic centers, and diagnostics labs. Governments and private organizations continue to invest heavily in large-scale genome sequencing programs to support personalized healthcare strategies, further boosting demand. The rising prevalence of cancer, neurological disorders, and cardiovascular diseases fuels the need for early detection tools enabled by microarray and biochip-based technologies. Biochip scanners deliver high-throughput analysis, enhanced resolution, and rapid data interpretation, aligning with the growing need for disease stratification and tailored therapies. As genomic testing becomes more integrated into routine clinical care, biochip scanners remain instrumental in supporting scalable, accurate, and cost-efficient genetic analysis workflows.
- For instance, the Prosigna™ PAM50 breast cancer prognostic gene signature test uses data from 50 genes to assess a postmenopausal woman's 10-year risk of distant recurrence for early-stage, hormone receptor-positive, HER2-negative breast cancer.
Expansion of Proteomics, Drug Discovery, and Biomarker Research
Proteomics and drug discovery applications are significantly contributing to market growth as pharmaceutical and biotechnology companies increase reliance on biochip platforms for high-throughput screening and protein interaction studies. Biochip scanners enable rapid analysis of protein expression patterns, post-translational modifications, and disease-related biomarkers, accelerating the development of targeted therapeutics. The growing emphasis on biomarker validation in oncology, infectious diseases, and autoimmune disorders enhances scanner adoption across research and clinical settings. Drug developers utilize these systems to streamline lead identification and toxicology assessments, reducing R&D timelines. As the pipeline of biologics, peptide drugs, and gene therapies expands, researchers require more advanced, sensitive, and automated scanning technologies. This shift toward data-rich, multiplexed analytical techniques strengthens the essential role of biochip scanners in modern drug discovery workflows.
- For instance, RayBiotech’s antibody microarray platforms, paired with high-resolution scanners, allow simultaneous quantification of over 1,000 cytokines and growth factors, providing drug-discovery groups with biomarker signatures for candidate screening.
Increasing Adoption of Diagnostic Microarrays for Disease Detection
The rise in molecular diagnostics, especially for cancer, infectious diseases, and genetic disorders, is driving extensive use of diagnostic microarrays, thereby boosting demand for biochip scanners. Hospitals and clinical laboratories increasingly prefer microarray-based diagnostics for their ability to detect multiple biomarkers simultaneously with high precision. The growing need for rapid, early-stage disease detection supports wider implementation of biochip platforms in clinical workflows. Infectious disease outbreaks and rising antimicrobial resistance encourage the use of microarray panels for pathogen identification and resistance profiling. Developments in point-of-care microarrays, immunoassay chips, and lab-on-chip diagnostic devices are expanding the clinical utility of biochip scanners. As healthcare systems shift toward predictive and preventive health models, the role of biochip scanners in delivering fast, accurate, and multiplexed diagnostic insights becomes indispensable.
Key Trends & Opportunities
Integration of AI, Automation, and Advanced Image Analytics
Artificial intelligence (AI), machine learning (ML), and automated image-processing technologies are transforming the capabilities of biochip scanners, creating new opportunities for efficiency and accuracy. AI-driven algorithms enhance data interpretation, pattern recognition, and biomarker identification, enabling researchers to derive deeper insights from complex genomic and proteomic datasets. Automation in scanner operation minimizes manual handling errors while improving sample throughput in high-volume testing environments. Cloud-based platforms now support remote data sharing, collaborative analysis, and real-time decision-making. As AI-enabled bioinformatics becomes more sophisticated, biochip scanners integrated with automated workflows and intelligent software offer laboratories improved reproducibility, standardized reporting, and accelerated research timelines.
- For instance, Illumina’s DRAGEN Bio-IT platform uses FPGA-accelerated algorithms that process a whole human genome in under 25 minutes, enabling rapid downstream interpretation of array and sequencing data used with high-throughput scanner workflows.
Growing Application of Biochip Scanners in Agriculture and Environmental Monitoring
Biochip scanners are increasingly used beyond biomedical sectors, creating new opportunities in agricultural genomics, livestock quality assessment, and environmental pathogen surveillance. Microarray-based analysis supports crop improvement by identifying desirable genetic traits, detecting plant pathogens, and enabling rapid screening of soil or water contaminants. As climate change affects food production, agricultural biotechnology companies are adopting biochip systems to accelerate breeding programs and strengthen research on crop resilience. Environmental agencies utilize microarray scanners for pollution monitoring, toxin detection, and microbial population analysis in ecosystems. This diversification into non-medical applications widens the market potential and reduces dependency on healthcare-driven demand cycles.
- For instance, Affymetrix (Thermo Fisher Scientific) Axiom plant genotyping arrays analyze over 600,000 variants in crops such as maize, wheat, and soybean, enabling breeders to rapidly identify drought-tolerance and high-yield traits using high-resolution microarray scanning.
Key Challenges
High Cost of Equipment and Operational Complexities
A major challenge in the Biochip Scanner Market is the high cost associated with acquiring, maintaining, and operating advanced scanning systems. These devices often require sophisticated imaging components, high-precision optics, and specialized software, significantly increasing initial investments. Smaller laboratories and institutions in developing regions face budget limitations, preventing adoption despite rising scientific needs. Operational complexities add further constraints, as trained personnel are needed for calibration, sample preparation, data analysis, and system maintenance. Consumable costs, including microarrays and reagents, elevate total operational expenditure. These financial and technical barriers restrict widespread deployment, particularly in cost-sensitive research environments and emerging markets.
Data Interpretation Challenges and Lack of Standardization
Biochip scanners generate large volumes of complex genomic and proteomic data, making accurate and consistent interpretation a significant challenge. Variations in scanning parameters, microarray fabrication quality, and image-processing techniques often result in inconsistent datasets across laboratories. The absence of global standardization in assay protocols, calibration methods, and reporting formats complicates data harmonization and reduces reproducibility. Limited interoperability between scanner software and downstream bioinformatics tools further contributes to inefficiencies. These issues pose major hurdles for clinical diagnostics, where precision and reliability are essential for patient decision-making. Ensuring standardized workflows remains a critical priority for market stability and regulatory alignment.
Regional Analysis
North America
North America dominates the Biochip Scanner Market with a 38.4% share in 2024, driven by strong investments in genomics, precision medicine, and advanced diagnostic platforms. The U.S. leads due to its well-established biotech ecosystem, high adoption of microarray-based diagnostics, and expanding clinical genomics programs. Major manufacturers, academic research institutions, and pharmaceutical companies actively integrate high-throughput scanning technologies to accelerate drug discovery and biomarker development. Government funding through NIH and large genome sequencing initiatives further strengthen regional growth. Canada’s rising molecular diagnostics adoption also contributes to sustained market expansion.
Europe
Europe holds a significant 29.7% share of the Biochip Scanner Market, supported by robust biomedical research infrastructure, strong university networks, and widespread adoption of genomic testing. Germany, the U.K., and France lead demand due to advanced healthcare systems and large investments in proteomics, personalized therapy, and molecular pathology. EU-funded research programs and growing biotechnology clusters drive broader adoption of high-resolution scanner technologies. Regulatory focus on early disease detection and increased cancer screening initiatives also fuel scanner utilization. Rising research collaborations between academia and industry accelerate innovation across microarray and lab-on-chip applications.
Asia-Pacific
Asia-Pacific emerges as the fastest-growing region with 22.8% market share in 2024, driven by rapid advancements in biotechnology, expanding diagnostic infrastructure, and rising investments in genomic research. China, Japan, South Korea, and India are leading contributors, supported by government-backed genome sequencing programs and growing demand for cancer diagnostics. Pharmaceutical outsourcing activities and CRO expansion strengthen scanner adoption across drug discovery workflows. The region’s growing clinical research ecosystem, coupled with increasing healthcare digitalization, supports strong adoption of automated and AI-enabled biochip scanning platforms. Increasing affordability and investment in precision medicine further accelerate growth.
Latin America
Latin America accounts for a modest 5.6% share of the Biochip Scanner Market, but rising adoption of molecular diagnostics and expanding biotech research capabilities are supporting regional progress. Brazil and Mexico lead due to growing investments in clinical genomics, infectious disease testing, and academic research. The need for rapid diagnostic tools during recent public health challenges has increased the demand for microarray-based pathogen detection. Limited funding and unequal access to advanced laboratory infrastructure remain constraints, though gradual modernization of healthcare systems and partnerships with global biotech firms are improving technology availability.
Middle East & Africa (MEA)
The Middle East & Africa region holds a 3.5% market share, supported by increasing adoption of molecular testing technologies and expanding healthcare modernization efforts. Gulf countries, particularly the UAE and Saudi Arabia, invest heavily in precision medicine and genomic initiatives, driving demand for high-performance biochip scanners. Research facilities are steadily integrating microarray platforms for oncology and infectious disease studies. However, limited research funding, skilled workforce shortages, and uneven access to advanced laboratory technologies restrain broader market growth. Emerging diagnostic laboratories and government healthcare transformation programs are gradually improving regional adoption.
Market Segmentations
By Product Type
- Laser-Based Biochip Scanners
- Fluorescence Biochip Scanners
- CCD-Based Biochip Scanners
- Microarray Scanners
By Application
- Genomics
- Proteomics
- Drug Discovery & Development
- Disease Diagnostics
- Agriculture & Environmental Research
By End User
- Biotechnology & Pharmaceutical Companies
- Academic & Research Institutes
- Hospitals & Diagnostics Laboratories
- Contract Research Organizations (CROs)
By Geography
- North America
- U.S.
- Canada
- Mexico
- Europe
- Germany
- France
- U.K.
- Italy
- Spain
- Rest of Europe
- Asia Pacific
- China
- Japan
- India
- South Korea
- South-east Asia
- Rest of Asia Pacific
- Latin America
- Brazil
- Argentina
- Rest of Latin America
- Middle East & Africa
- GCC Countries
- South Africa
- Rest of the Middle East and Africa
Competitive Landscape
The Biochip Scanner Market exhibits a moderately consolidated competitive landscape, with leading companies focusing on technological advancements, high-resolution imaging capabilities, and expanded application coverage across genomics, proteomics, and diagnostics. Key players such as Agilent Technologies, Illumina Inc., PerkinElmer Inc., Bio-Rad Laboratories Inc., Standard BioTools, GE HealthCare, Randox Laboratories Ltd., LI-COR Inc., IBIOCHIPS, and Cellix Ltd. compete by offering enhanced fluorescence detection, automation, and AI-driven image analysis. These companies prioritize strategic partnerships, software upgrades, and product innovations to strengthen market presence. Continuous investment in microarray scanning, multiplex assay platforms, and precision medicine tools drives competitive differentiation. Expanding adoption across pharmaceutical R&D, clinical laboratories, and academic research institutions further intensifies competition, while emerging players introduce cost-efficient solutions to target developing markets.
Key Player Analysis
- IBIOCHIPS
- GE HealthCare
- Randox Laboratories Ltd.
- Standard BioTools
- Cellix Ltd
- LI-COR, Inc.
- Illumina, Inc.
- PerkinElmer, Inc
- Bio-Rad Laboratories, Inc.
- Agilent Technologies
Recent Developments
- In October 2025, Thermo Fisher Scientific launched its “SwiftArrayStudio Microarray Analyzer” platform in conjunction with the Axiom PharmacoPro and Axiom PangenomePro arrays.
- In September 2025, Fluidic Sciences Ltd acquired the business and assets of Sphere Bio Ltd (formerly Sphere Fluidics) to combine single-cell microfluidic screening and in-solution biophysics capabilities.
- In February 2025, Sphere Bio Ltd rebranded from Sphere Fluidics to reflect its transition to a broader life-sciences tools provider
Report Coverage
The research report offers an in-depth analysis based on Product Type, Application, End-User and Geography. It details leading market players, providing an overview of their business, product offerings, investments, revenue streams, and key applications. Additionally, the report includes insights into the competitive environment, SWOT analysis, current market trends, as well as the primary drivers and constraints. Furthermore, it discusses various factors that have driven market expansion in recent years. The report also explores market dynamics, regulatory scenarios, and technological advancements that are shaping the industry. It assesses the impact of external factors and global economic changes on market growth. Lastly, it provides strategic recommendations for new entrants and established companies to navigate the complexities of the market.
Future Outlook
- The market will experience strong growth as genomics and precision medicine become standard in clinical and research settings.
- Adoption of AI-driven image analysis will enhance data accuracy, speed, and automation across biochip scanning workflows.
- High-throughput microarray technologies will expand in oncology, infectious disease detection, and genetic screening applications.
- Pharmaceutical and biotechnology companies will increasingly rely on biochip scanners for biomarker research and drug development.
- Advancements in fluorescence detection and high-resolution imaging will improve performance in multiplexed analyses.
- Integration of cloud-based data platforms will support collaborative research and remote diagnostics.
- Emerging economies will adopt biochip scanners faster due to expanding diagnostic infrastructure and biotechnology investments.
- Miniaturized and portable biochip scanning systems will gain traction for point-of-care applications.
- Partnerships between scanner manufacturers and genomics companies will accelerate innovation and product development.
- Standardization of microarray protocols and improved data interoperability will strengthen adoption in clinical diagnostics.
Request a Free Sample
Fill in your details and we'll send you a free sample report.
- Sample data tables & charts
- Research methodology
Need a Custom Version of This Report?
Tailor the scope, geography, or segments to your exact requirements.
- Custom geography or segment scope
- Direct access to our analyst team
Frequently Asked Questions
What is the current market size for the Biochip Scanner Market, and what is its projected size in 2032?
At what Compound Annual Growth Rate is the Biochip Scanner Market projected to grow between 2025 and 2032?
Which Biochip Scanner Market segment held the largest share in 2024?
What are the primary factors fueling the growth of the Biochip Scanner Market?
Who are the leading companies in the Biochip Scanner Market?
Which region commanded the largest share of the Biochip Scanner Market in 2024?
Table of Content
Chapter 1. Report Introduction
- 1.1 Report Description & Purpose
- 1.1.1 Report Title & Market Definition
- 1.1.2 Unique Selling Propositions (USP) & Key Differentiators
- 1.1.3 Value Proposition for Stakeholders
- 1.2 Research Objectives
- 1.2.1 Market Sizing Objectives (Volume & Revenue)
- 1.2.2 Segmentation Objectives
- 1.2.3 Competitive Intelligence Objectives
- 1.2.4 Forecast & Scenario Objectives
- 1.3 Report Scope
- 1.3.1 Biochip Scanner Scope – Types & Subtypes Covered
- 1.3.2 Geographic Scope – Regions & Countries Covered
- 1.3.3 Historical Period, Base Year & Forecast Period (2024; forecast to 2032)
- 1.3.4 Inclusions & Exclusions
- 1.4 HS Code & Classification Framework
- 1.5 Currency, Units & Pricing Basis
- 1.6 Target Stakeholders
- 1.7 Limitations & Assumptions
Chapter 2. Executive Summary
- 2.1 Global Biochip Scanner Market Snapshot
- 2.1.1 Market Size – Historical (2024) & Forecast (2024-2032) (2024: USD 13.32 Billion → 2032: USD 30.48 Billion)
- 2.1.2 Volume & Revenue – Global Totals
- 2.1.3 Key Market Highlights – Top Five Facts
- 2.2 Biochip Scanner Market Segmentation Snapshot
- 2.2.1 Market Split by Region – 2024 vs. 2032
- 2.3 Competitive Snapshot
- 2.3.1 Top 10 Players by Revenue Share – 2024
- 2.3.2 Top 10 Players by Volume Share – 2024
- 2.3.3 Recent Strategic Developments (18-Month Summary)
- 2.4 Key Investment Highlights & Strategic Conclusions
Chapter 3. Biochip Scanner Market Dynamics & Industry Analysis
- 3.1 Market Overview & Context
- 3.1.1 Biochip Scanner Market Position in the Broader Automotive Value Chain
- 3.1.2 OEM vs. Replacement Market Dynamics
- 3.1.3 Market Maturity & Development Stage by Region
- 3.2 Biochip Scanner Market Drivers
- 3.3 Biochip Scanner Market Restraints & Challenges
- 3.4 Biochip Scanner Market Opportunities
- 3.5 Porter's Five Forces Analysis
- 3.5.1 Threat of New Entrants
- 3.5.2 Bargaining Power of Suppliers
- 3.5.3 Bargaining Power of Buyers
- 3.5.4 Threat of Substitutes
- 3.5.5 Competitive Rivalry – Intensity Assessment
- 3.6 Biochip Scanner Value Chain Analysis
- 3.6.1 Upstream – Raw Material/Input Suppliers
- 3.6.1.1 Raw Material/Input 1
- 3.6.1.2 Raw Material/Input 2
- 3.6.1.3 Raw Material/Input 3
- 3.6.2 Midstream – Production/Manufacturing/Service Delivery
- 3.6.2.1 Production/Process Overview
- 3.6.2.2 Key Facility Locations & Capacity by Manufacturer
- 3.6.3 Downstream – Distribution & End Consumer
- 3.6.3.1 Primary Channel – B2B/OEM
- 3.6.3.2 Secondary Channels – Dealer, Retail, Online, Direct
- 3.6.4 Value Chain Profitability Analysis
- 3.6.1 Upstream – Raw Material/Input Suppliers
- 3.7 PESTEL Analysis
- 3.7.1 Political Factors
- 3.7.2 Economic Factors
- 3.7.3 Social Factors
- 3.7.4 Technological Factors
- 3.7.5 Environmental Factors
- 3.7.6 Legal Factors
- 3.8 Biochip Scanner Supply Chain Analysis
- 3.8.1 Raw Material/Input Supply Risk Assessment
- 3.8.2 Manufacturing Concentration Risk (Geographic Exposure)
- 3.8.3 Trade Disruption Impact Analysis
- 3.9 Regulatory & Policy Landscape
Note: The regulatory and policy landscape section covers regulations based on their applicability to the market, Biochip Scanner category, geography, and scope of the study. Only regulatory frameworks with a material impact on operations, compliance, trade, sustainability, or market access are analyzed in detail.
Chapter 4. Key Investment Pockets & Opportunity Analysis
- 4.1 Biochip Scanner Market Attractiveness Analysis
- 4.1.1 By Region – Investment Attractiveness Matrix (Volume × CAGR)
- 4.2 Absolute Revenue Growth Opportunity
- 4.2.1 By Region – Absolute USD Growth Through 2032
- 4.3 Incremental Volume Opportunity
- 4.3.1 By Region – Incremental Volume Through 2032
- 4.3.2 Segment – Incremental Volume
- 4.4 Emerging Submarket Opportunity Deep Dive (Subject to Applicability)
- 4.5 Emerging Market Opportunity Scorecards
- 4.5.1 United States
- 4.5.2 Europe
- 4.5.3 Asia
- 4.5.4 Middle East & Africa
Note: Emerging Market Opportunity Scorecards will be included based on relevance and strategic importance. Regions listed are indicative and may vary depending on data availability and market dynamics.
Chapter 5. Biochip Scanner Import-Export Analysis & Trade Flows
- 5.1 Global Trade Overview
- 5.1.1 Global Export Value by Country (2024)
- 5.1.2 Global Export Volume by Country (2024)
- 5.1.3 Global Import Value by Country (2024)
- 5.1.4 Global Import Volume by Country (2024)
- 5.1.5 Net Trade Balance by Country (2024)
- 5.2 Export Analysis – Segment
- 5.2.1 Type 1 (HS Code)
- 5.2.2 Type 2 (HS Code)
- 5.2.3 Type 3 (HS Code)
- 5.2.4 Type 4 (HS Code)
- 5.2.5 Type 5 (HS Code)
- 5.3 Import Analysis – Segment
- 5.3.1 Type 1 (HS Code)
- 5.3.2 Type 2 (HS Code)
- 5.3.3 Type 3 (HS Code)
- 5.3.4 Type 4 (HS Code)
- 5.3.5 Type 5 (HS Code)
- 5.4 Average Unit Trade Prices
- 5.4.1 Average Export Price – Segment & Country
- 5.4.2 Average Import Price – Segment & Source Country
- 5.4.3 Price Trends (2024)
- 5.5 Key Trade Route Analysis
- 5.5.1 Trade Route 1
- 5.5.2 Trade Route 2
- 5.5.3 Trade Route 3
- 5.5.4 Trade Route 4
- 5.5.5 Trade Route 5
- 5.6 Trade Policy Impact Assessment
- 5.6.1 US Anti-Dumping & Section 301 Tariffs
- 5.6.2 EU Customs Union Impact
- 5.6.3 Major Free Trade Agreements
- 5.6.4 USMCA Rules of Origin
Note: Trade policy analysis will be included only where relevant to the Biochip Scanner market.
Chapter 6. Competitive Landscape & Company Benchmarking
- 6.1 Biochip Scanner Market Concentration & Structure
- 6.1.1 Herfindahl-Hirschman Index (HHI) – vs. 2024
- 6.1.2 Tier 1, Tier 2 & Tier 3 Market Structure
- 6.1.3 Global, Regional & Local Player Dynamics
- 6.2 Biochip Scanner Market Share Analysis – 2024
- 6.2.1 Global Revenue Share by Company
- 6.2.2 Global Volume Share by Company
- 6.2.3 Regional Revenue Share
- 6.2.4 Market Share Evolution ( vs. 2024)
- 6.2.5 OEM Segment Share by Company
- 6.2.6 Replacement Segment Share by Company
- 6.3 Production/Delivery Capacity & Facility Analysis
- 6.3.1 Global Installed Capacity
- 6.3.2 Capacity Utilization Rates
- 6.3.3 Production/Output Volume
- 6.3.4 Facility Locations & Capacity Map
- 6.3.5 Planned Capacity Additions
- 6.4 Biochip Scanner Competitive Benchmarking Matrix
- 6.4.1 Revenue, Volume, CAGR & Profitability Comparison
- 6.4.2 Channel Revenue Mix
- 6.4.3 Geographic Revenue Exposure
- 6.4.4 R&D Intensity
- 6.4.5 Sustainability Maturity
- 6.5 Strategic Developments in Biochip Scanner (Last 24 Months)
- 6.5.1 Mergers, Acquisitions & Divestments
- 6.5.2 New Biochip Scanner Launches
- 6.5.3 Facility Expansions
- 6.5.4 Strategic Alliances, Joint Ventures & Partnerships
- 6.5.5 Distribution Expansion & Market Entry
- 6.5.6 Sustainability & ESG Initiatives
- 6.6 Competitive Strategy Mapping
- 6.6.1 Leader, Challenger, Follower & Niche Classification
- 6.6.2 Pricing Strategy Comparison
- 6.6.3 Channel Strategy Matrix
Note: Strategic developments are included based on their materiality and the availability of reliable information.
Chapter 7. Global Biochip Scanner Market – By Distribution Channel
- 7.1 Segment Overview
- 7.1.1 Volume & Revenue Split by Channel (2024 & 2032)
- 7.1.2 Channel Mix Evolution (2024-2032)
Chapter 8. Regional Market Analysis – Global Overview
- 8.1 Global Regional Overview
- 8.1.1 Regional Volume Share
- 8.1.2 Regional Revenue Share
- 8.1.3 Regional Volume by Region
- 8.1.4 Regional Revenue by Region
- 8.1.5 Regional Forecast Through 2032
- 8.2 Cross-Regional Segment Analysis
- 8.2.1 By Distribution Channel
- 8.2.2 By Brand/Price Tier
Chapter 9. North America Biochip Scanner Market
- 9.1 United States
- 9.2 Canada
- 9.3 Mexico
Chapter 10. Europe Biochip Scanner Market
- 10.1 Germany
- 10.2 France
- 10.3 Italy
- 10.4 United Kingdom
- 10.5 Spain
- 10.6 Poland
- 10.7 Russia
- 10.8 Netherlands
- 10.9 Belgium
- 10.10 Sweden
- 10.11 Denmark
- 10.12 Norway
- 10.13 Rest of Europe
Chapter 11. Asia Pacific Biochip Scanner Market
- 11.1 China
- 11.2 India
- 11.3 Japan
- 11.4 South Korea
- 11.5 Thailand
- 11.6 Indonesia
- 11.7 Vietnam
- 11.8 Malaysia
- 11.9 Australia
- 11.10 Rest of Asia Pacific
Chapter 12. Latin America Biochip Scanner Market
- 12.1 Brazil
- 12.2 Argentina
- 12.3 Colombia
- 12.4 Chile
- 12.5 Rest of Latin America
Chapter 13. Middle East Biochip Scanner Market
- 13.1 Saudi Arabia
- 13.2 United Arab Emirates
- 13.3 Turkey
- 13.4 Israel
- 13.5 Iran
- 13.6 Rest of the Middle East
Chapter 14. Africa Biochip Scanner Market
- 14.1 South Africa
- 14.2 Egypt
- 14.3 Nigeria
- 14.4 Morocco
- 14.5 Rest of Africa
Chapter 15. Biochip Scanner Company Profiles
- 15.1 [Company 01]
- 15.1.1 Company Overview
- 15.1.2 Key Management Personnel
- 15.1.3 Products & Services Portfolio
- 15.1.4 Financial Performance
- 15.1.5 Key Market Focus & Geographic Presence
- 15.1.6 Recent Developments & Strategic Initiatives
Note: The company profile list is preliminary and may change based on research findings, market developments, data availability, and client requirements.
Chapter 16. Appendices
- Appendix A – List of Abbreviations & Acronyms
- Appendix B – Industry Classification Code Reference – Full Series
- Appendix C – Production & Capacity Data Tables
- Appendix D – End-Use & Demand Base Tables
- Appendix E – Consumption & Replacement Rate Assumptions
- Appendix F – ASP Reference Tables
- Appendix G – Manufacturing & Facility Database
- Appendix H – Import-Export Data Tables
- Appendix I – Regulatory Summary Tables
- Appendix J – Primary Research Participant List (Anonymized)
- Appendix K – Primary Research Questionnaire Framework
- Appendix L – Data Sources & Bibliography
- Appendix M – Market Size Divergence & Source Comparison
Chapter 17. Research Methodology
- 17.1 Research Framework & Philosophy
- 17.2 Secondary Research – Sources, Hierarchy & Data Extraction
- 17.3 Data Modeling – Bottom-Up & Top-Down Market Sizing
- 17.4 Primary Research – Stakeholder Framework, LOI & Sample Sizes
- 17.5 Forecast Methodology – Regression, Scenario & Sensitivity Analysis
- 17.6 Quality Control – Four-Layer Validation Framework
- 17.7 Limitations & Standard Assumptions
- 17.8 Disclaimer
