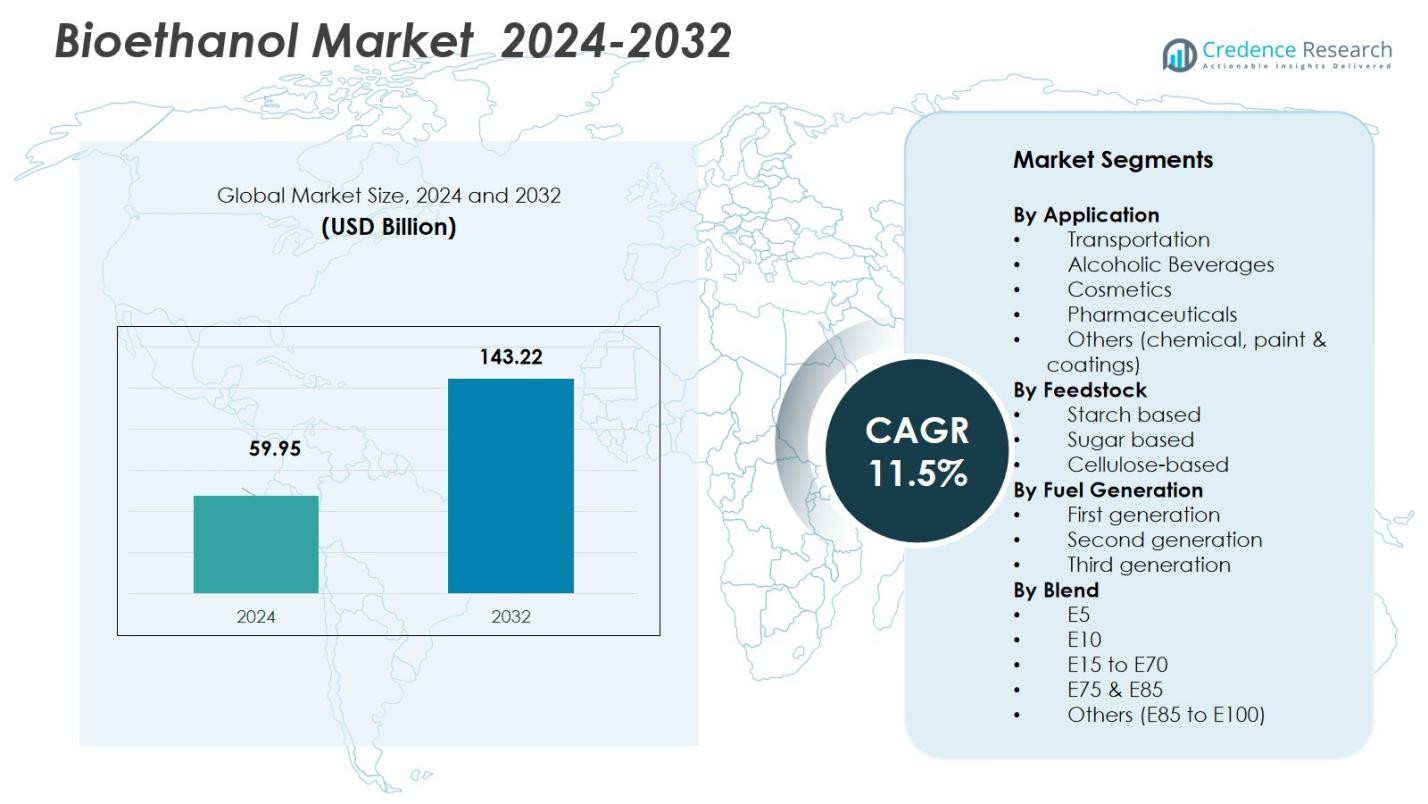
Home » Energy » Bioethanol Market

Bioethanol Market By Fuel Blend (E5, E10, E15 to E70, E75 & E85, Others) By Feedstock (Starch-based, Sugar-based, Cellulose-based) By End-Use Industry(Transportation, Alcoholic Beverages, Cosmetics, Pharmaceuticals, Others) – Growth, Future Prospects & Competitive Analysis, 2016 – 2028

Price: $4999

Published: | Report ID: 3273 | Report Format : PDF

About this report

The global Bioethanol Market report explores the critical analysis of the bioethanol industry using key parameters. The report consists of investment strategies, the need for investments in the bioethanol industry, and the multiple benefits for the investors. Importantly, this report sets out major changes in the bioethanol industry’s global technical regulations and how economic and non-economic barriers are helping the market grow. Moreover, the report examines historical and projected global, regional, and country market sizes. The report also examines key investment propositions, the demand and supply gap, competitor positioning, SRC analysis, STAR analysis, and Tornado analysis. Key technological advancements and other analyses, including Value Chain, Porter’s Five Forces, PESTEL, etc.


Key Highlights of the report

How are the major segments performing in the Global Bioethanol Market?

The E10 fuel blend segment led the market in 2021 and is expected to continue throughout the projection period. Blending bioethanol with conventional fuels improves their renewability; E10 is a gasoline blend that contains 90% regular unleaded gasoline and 10% ethanol. Bioethanol is a low-carbon fuel that can help with transportation decarbonization. Most new cars and light-duty diesel vehicles can have this installed without requiring engine or fuel system modifications. Bioethanol demand in the E10 segment is expected to rise due to increased use in the vehicle industry. Many countries in Europe and other regions have mandated using E-10 fuel blends in automobiles to reduce global greenhouse gas (GHG) emissions. As a result, demand for E-10 gasoline blends is increasing in various end-use industries, bolstering segment growth.

The sugar-based feedstock segment dominated the market in 2021 as the ethanol derived from sugarcane is a sustainable fuel source with direct emissions up to 90% lower than diesel or gasoline. Since the invention of the automobile, bioethanol from biomass has been regarded as an adequate fuel, especially for cars with spark-ignition engines. Ethanol production is now primarily conducted at sugar mills across the globe. Emerging nations are leading the way in accepting molasses-based ethanol on a global scale. The disinfectant and coalescing properties are driving demand. Adopting low-carbon fuel standards will accelerate the use of sugar-based feedstock for ethanol production.

Design Element 2

Access crucial information at unmatched prices!

Request your free sample report today & start making informed decisions powered by Credence Research!

Download Free Sample
CTA Design Element 3

The transportation end-use industry segment dominated the market in 2021 due to increasing bioethanol adoption as a transportation fuel and biofuel blending mandates imposed by several regulatory bodies. Bioethanol is less expensive and environmentally friendly than other fuels, encouraging people to use it in automobiles. With increased automotive production, demand for bioethanol is expected to rise, resulting in a prospering transportation bioethanol industry during the forecast period.

Which region dominated the Global Bioethanol Market?

In 2021, North America held a dominant position in the global market for bioethanol due to rising acceptance and government subsidies for developing environmentally viable and renewable fuel sources. North America uses a variety of ethanol fuel blends and is one of the world’s largest fuel consumers. The U.S. is the world’s largest consumer and producer of bioethanol, followed by China, Brazil, Canada, and India. Countries in this region have mandated the use of higher blends in vehicles. The growth in domestic motor gasoline consumption, which is now blended with 10% ethanol by volume, and higher renewable fuel standard targets, have contributed to an increase in regional bio-ethanol production. The enormous amount of maize grown in North America has made the region’s bioethanol market attractive and fertile.

What is the competitive environment of the Global Bioethanol Market?

Players in the bioethanol market primarily use key strategies such as technology launches, acquisitions, and R&D activities. Players in the bioethanol market have recently expanded their operations overseas to gain a dominant position. For instance, ADM and BioUrja Group signed a contract in October 2021 to sell the ethanol production facility in Peoria, Illinois. Their strategic review of dry mill ethanol assets included selling their Peoria facility. Similarly, Raizen purchased areas in the ports of Miramar and Vila do Conde for liquid bulk storage in April 2019, which will aid in expanding its distribution network throughout Brazil.

Executive Summary

What are all technical developments being developed in the Global Bioethanol Market?

Market technological advancements have led to the development of second and third-generation bioethanol, which is predicted to remain a viable potential in the global market. Moreover, rapid technological advancements and increased R&D budgets to produce ethanol from algae are expected to drive demand due to its faster rate of production and natural occurrence in water bodies, which is anticipated to lower production costs. For instance, Coca-Cola Company announced the launch of its first beverage bottle made entirely of plastic derived from plants in October 2021. Coca-technology, Cola’s, which it co-owns with Changchun Meihe Science & Technology, accelerates bMEG production while allowing for a broader range of renewable materials. bMEG is produced by converting sugarcane or corn to bioethanol and then to bio ethylene glycol. Similarly, Blue Biofuels Inc announced in May 2022 that its fifth generation Cellulose-to-Sugar (CTS) machine is on schedule and that testing and further engineering toward larger volumes have begun. Blue Biofuels has also laid out a plan for the future and hired K.R. Komarek Inc to build the successors of the fifth generation CTS machine through commercialization.

Which are the key investments by the players in the Global Bioethanol Market?

As bioethanol produces fewer volatile emissions, it may eventually replace fossil fuels in the transportation and energy sectors. As a result, the bioethanol market is currently seeing investments from many companies. The increase in investments in bio-based energy production is driving up market demand. Several companies plan to expand their operations by opening new facilities, establishing bio-based energy operations, or looking into new acquisition or joint venture opportunities to meet the rising demand for bioethanol in their geographic presence. For instance, Serbia’s Bionex, one of the leading enterprises, plans to invest USD 6.1 billion in building a bioethanol factory in Apatin in March 2021. Bionex has maintained a contract to acquire a land plot in the Apatin Free Zone for 64 million dollars. Also, Shree Renuka Sugars Ltd (SRSL), a subsidiary of Wilmar International Ltd in Singapore, received a five-year Rs 1.75 billion (SGD 31 million) transition finance loan from DBS in May 2022. The funds will support SRSL’s sustainable bioethanol business in India.

Some major players in the market are POET LLC, Green Plains, Tereos, Valero Energy Corporation, Archer Daniels Midland, Raizen, Flint Hills Resources, Pacific Ethanol, Sekab Biofuels & Chemicals AB, and The Andersons Inc.

What are the Major Driving Factors for the Global Bioethanol Market?

Government regulatory bodies encouraging production are the primary drivers for the global bioethanol market. Growing market growth is driven by rising government initiatives to produce and use greener fuels like bio-ethanol and rising consumer demand for blending in gasoline. Implementing strict regulations has motivated businesses to concentrate on developing better, cleaner, and more affordable energy. The market’s technological developments have led to the creation of second and third-generation bioethanol, which is anticipated to continue to be competitive on the global market.

What are the Major Risks for the Global Bioethanol Market?

The market’s growth is hampered by a shift toward bio-butanol and less mileage. The decline in automotive sales and production and the increased use of electric vehicles affect the bioethanol market’s growth. A sizable amount of fertile cultivable land must be set aside to grow the crops used to produce ethanol, which is expected to restrain market expansion over the forecast period. In addition, conventional farmers are less likely to switch from growing food to growing fuel crops, which could also result in a global shortage of food crops.

Which is the key End-Use Industry in the Global Bioethanol Market?

The transportation end-use industry segment dominated the global market in 2021 and is expected to continue throughout the projection period. Due to the increased use of bioethanol as a transportation fuel and blending requirements imposed by various regulatory bodies, such as the Renewable Energy Directive (EU RED) and the Renewable Fuel Standard (EPA RFS), transportation is anticipated to be the most profitable investment sector. Moreover, the number of vehicles increases in tandem with disposable income. The Energy Information Administration (EIA) predicts that by 2035, there will be 1.7 million vehicles on the road. The International Organization of Motor Vehicle Manufacturers (OICA) reports that the production of automobiles increased by 10% in the first nine months of 2021, from 52.15 million units in the same period the previous year to 57.26 million vehicles. The demand for bioethanol will increase with rising auto production, leading to a booming transportation bioethanol market throughout the forecast period.

How is the Bioethanol Market performing in regions?

North America dominated the global bioethanol market in 2021 and is expected to continue this dominant position over the forecast period. The region is a major consumer of vehicle fuel and utilizes different ethanol fuel blends. Higher bioethanol blends have been mandated in vehicles in some nations, including the U.S. and Canada. The U.S. is also the world’s leading producer of bioethanol. This region is anticipated to be the main regional market for bioethanol owing to the expansion of the transportation sector and growing environmental mandates to restart the industry more practically. Furthermore, technological advancements and the rapidly expanding automotive sector are expected to grow significantly over the forecast period.

Besides, due to increased government support for bioethanol and the accessibility of arable land with greater soil fertility in Columbia and Brazil, Latin America is expected to be the fastest-growing regional market during the forecast period. The high sugarcane production in Brazil boosts the production of these fuels in the region. Brazil was among the first to experiment with blending ethanol into gasoline. Many automobile manufacturers in the country made changes to accommodate the change. The country has raised the tax on imported ethanol, which is expected to enhance the regional market growth.

What is the regulatory landscape for the Global Bioethanol Market?

Government regulatory agencies supporting production are the key factors driving global market growth. Many governments around the world have made bioethanol fuel blends mandatory. Bioethanol also improves fuel efficiency and lowers vehicles’ greenhouse gas (GHG) emissions. European Union environmental and government regulations and mandatory biofuel blending obligations in Germany enhance the market growth. For instance, in August 2019, the state of Maharashtra, India, requested permission from the federal government so that sugar factories there could convert their stock of sugar into the market for bioethanol.

Shape Your Report to Specific Countries or Regions & Enjoy 30% Off!

What is the Market Size of Bioethanol regarding value?

The global bioethanol market is anticipated to grow at a substantial CAGR of 13.6% in the upcoming years. The global bioethanol industry was estimated to be worth USD 34.1 billion in 2021 and was expected to be worth USD 73.28 million by 2028.

Bioethanol Market
 

What are the major players planning for the future of the Bioethanol Market?

Increased adoption of eco-friendly products is expected to open up new growth opportunities for market participants. Recent global market developments have caused changes in the value chain. Initially, manufacturers relied on two to three suppliers for raw materials, which poses a risk because contingency plans do not always work. Manufacturers are now considering ways to mitigate risk, such as acquiring stakes in raw material companies or entering forwarding agreements. For instance, Argentina’s energy division and corn bioethanol producers partnered in January 2021 to produce biofuels and raise oil prices. The goal of this agreement is to break the industry’s semi-stagnation. Likewise, CropEnergies tests new bioethanol fuel for Stuttgart Airport in October 2021. Stuttgart Airport, CropEnergies, and mineral oil company Mabanaft Deutschland are testing a 20 percent renewable ethanol fuel.

Segmentation of Global Bioethanol Market –

Global Bioethanol Market – By Fuel Blend

  • E5
  • E10
  • E15 to E70
  • E75 & E85
  • Others (E85 to E100)

Global Bioethanol Market – By Feedstock

  • Starch-based
  • Sugar-based
  • Cellulose-based

Global Bioethanol Market – By End-Use Industry

  • Transportation
  • Alcoholic Beverages
  • Cosmetics
  • Pharmaceuticals
  • Others (chemical, paint & coatings)

Global Bioethanol Market – By Region

  • North America
    • The U.S.
    • Canada
  • Europe
    • Germany
    • France
    • The U.K.
    • Italy
    • Spain
    • Rest of Europe
  • Asia Pacific
    • China
    • Japan
    • India
    • South Korea
    • South-east Asia
    • Rest of Asia Pacific
  • Latin America
    • Brazil
    • Mexico
    • Rest of Latin America
  • Middle East & Africa
    • GCC Countries
    • South Africa
    • Rest of the Middle East and Africa

1. Preface
1.1. Report Description
1.1.1. Purpose of the Report
1.1.2. Target Audience
1.1.3. USP and Key Offerings
1.2. Research Scope
1.3. Research Methodology
1.3.1. Phase I – Secondary Research
1.3.2. Phase II – Primary Research
1.3.3. Phase III – Expert Panel Review
1.3.4. Approach Adopted
1.3.4.1. Top-Down Approach
1.3.4.2. Bottom-Up Approach
1.3.5. Assumptions
1.4. Market Segmentation

2. Executive Summary
2.1. Market Snapshot: Global Bioethanol Market
2.2. Global Bioethanol Market, By Fuel Blend
2.3. Global Bioethanol Market, By Feedstock
2.4. Global Bioethanol Market, By End-Use Industry
2.5. Global Bioethanol Market, By Region

3. Market Dynamics & Factors Analysis
3.1. Introduction
3.1.1. Global Bioethanol Market Value, 2016-2028, (US$ Bn)
3.2. Market Dynamics
3.2.1. Key Growth Trends
3.2.2. Market Drivers
3.2.3. Market Restraints
3.2.4. Market Opportunities
3.2.5. Major Industry Challenges
3.3. Attractive Investment Proposition,2021
3.3.1. Fuel Blend
3.3.2. Feedstock
3.3.3. End-Use Industry
3.3.4. Geography

4. Premium Insights
4.1. STAR (Situation, Task, Action, Results) Analysis
4.2. Porter’s Five Forces Analysis
4.2.1. Threat of New Entrants
4.2.2. Bargaining Power of Buyers/Consumers
4.2.3. Bargaining Power of Suppliers
4.2.4. Threat of Substitute Types
4.2.5. Intensity of Competitive Rivalry
4.3. Value Chain Analysis
4.4. Technology Analysis
4.5. Marketing Strategy Analysis
4.5.1. Direct Marketing
4.5.2. Indirect Marketing
4.5.3. Marketing Channel Development Trend

5. Market Positioning of Key Players, 2021
5.1. Company market share of key players, 2021
5.2. Competitive Benchmarking
5.3. Market Positioning of Key Vendors
5.4. Geographical Presence Analysis
5.5. Major Strategies Adopted by Key Players
5.5.1. Key Strategies Analysis
5.5.2. Mergers and Acquisitions
5.5.3. Partnerships
5.5.4. Fuel Blend Launch
5.5.5. Geographical Expansion
5.5.6. Others

6. COVID 19 Impact Analysis
6.1. Global Bioethanol Market Pre Vs Post COVID 19, 2019 – 2028
6.2. Impact on Import & Export
6.3. Impact on Demand & Supply

7. Global Bioethanol Market
7.1. Global Bioethanol Market, by Fuel Blend, 2016-2028(US$ Bn)
7.1.1. Overview
7.1.2. Global Bioethanol Market, By Fuel Blend, 2021 vs 2028 (in%)
7.1.3. Global Bioethanol Market, By E5, 2016-2028 (US$ Bn)
7.1.4. Global Bioethanol Market, By E10, 2016-2028 (US$ Bn)
7.1.5. Global Bioethanol Market, By E15 to E70, 2016-2028 (US$ Bn)
7.1.6. Global Bioethanol Market, By E75 & E85, 2016-2028 (US$ Bn)
7.1.7. Global Bioethanol Market, By Others (E85 to E100), 2016-2028 (US$ Bn)
7.2. Global Bioethanol Market, by Feedstock, 2016-2028(US$ Bn)
7.2.1. Overview
7.2.2. Global Bioethanol Market, By Feedstock, 2021 vs 2028 (in%)
7.2.3. Global Bioethanol Market, By Starch based, 2016-2028 (US$ Bn)
7.2.4. Global Bioethanol Market, By Sugar based, 2016-2028 (US$ Bn)
7.2.5. Global Bioethanol Market, By Cellulose-based, 2016-2028 (US$ Bn)
7.3. Global Bioethanol Market, by End-Use Industry, 2016-2028(US$ Bn)
7.3.1. Overview
7.3.2. Global Bioethanol Market, By End-Use Industry, 2021 vs 2028 (in%)
7.3.3. Global Bioethanol Market, By Transportation, 2016-2028 (US$ Bn)
7.3.4. Global Bioethanol Market, By Alcoholic Beverages, 2016-2028 (US$ Bn)
7.3.5. Global Bioethanol Market, By Cosmetics, 2016-2028 (US$ Bn)
7.3.6. Global Bioethanol Market, By Pharmaceuticals, 2016-2028 (US$ Bn)
7.3.7. Global Bioethanol Market, By Others (chemical, paint & coatings), 2016-2028 (US$ Bn)

8. North America Bioethanol Market Analysis
8.1. North America Bioethanol Market, by Fuel Blend, 2016-2028(US$ Bn)
8.1.1. Overview
8.1.2. SRC Analysis
8.2. North America Bioethanol Market, by Feedstock, 2016-2028(US$ Bn)
8.2.1. Overview
8.2.2. SRC Analysis
8.3. North America Bioethanol Market, by End-Use Industry, 2016-2028(US$ Bn)
8.3.1. Overview
8.3.2. SRC Analysis
8.4. North America Bioethanol Market, by Country, 2016-2028 (US$ Bn)
8.4.1. U.S.
8.4.1.1. U.S. Bioethanol Market Estimates and Forecast, 2016-2028 (US$ Bn)
8.4.1.2. U.S. Bioethanol, By Fuel Blend, 2016-2028 (US$ Bn)
8.4.1.3. U.S. Bioethanol, By Feedstock, 2016-2028 (US$ Bn)
8.4.1.4. U.S. Bioethanol, By End-Use Industry, 2016-2028 (US$ Bn)
8.4.2. Canada
8.4.2.1. Canada Bioethanol Market Estimates and Forecast, 2016-2028 (US$ Bn)
8.4.2.2. Canada Bioethanol, By Fuel Blend, 2016-2028 (US$ Bn)
8.4.2.3. Canada Bioethanol, By Feedstock, 2016-2028 (US$ Bn)
8.4.2.4. Canada Bioethanol, By End-Use Industry, 2016-2028 (US$ Bn)

9. Europe Bioethanol Market Analysis
9.1. Europe Bioethanol Market, by Fuel Blend, 2016-2028(US$ Bn)
9.1.1. Overview
9.1.2. SRC Analysis
9.2. Europe Bioethanol Market, by Feedstock, 2016-2028(US$ Bn)
9.2.1. Overview
9.2.2. SRC Analysis
9.3. Europe Bioethanol Market, by End-Use Industry, 2016-2028(US$ Bn)
9.3.1. Overview
9.3.2. SRC Analysis
9.4. Europe Bioethanol Market, by Country, 2016-2028 (US$ Bn)
9.4.1. Germany
9.4.1.1. Germany Bioethanol Market Estimates and Forecast, 2016-2028 (US$ Bn)
9.4.1.2. Germany Bioethanol, By Fuel Blend, 2016-2028 (US$ Bn)
9.4.1.3. Germany Bioethanol, By Feedstock, 2016-2028 (US$ Bn)
9.4.1.4. Germany Bioethanol, By End-Use Industry, 2016-2028 (US$ Bn)
9.4.2. France
9.4.2.1. France Bioethanol Market Estimates and Forecast, 2016-2028 (US$ Bn)
9.4.2.2. France Bioethanol, By Fuel Blend, 2016-2028 (US$ Bn)
9.4.2.3. France Bioethanol, By Feedstock, 2016-2028 (US$ Bn)
9.4.2.4. France Bioethanol, By End-Use Industry, 2016-2028 (US$ Bn)
9.4.3. UK
9.4.3.1. UK Bioethanol Market Estimates and Forecast, 2016-2028 (US$ Bn)
9.4.3.2. UK Bioethanol, By Fuel Blend, 2016-2028 (US$ Bn)
9.4.3.3. UK Bioethanol, By Feedstock, 2016-2028 (US$ Bn)
9.4.3.4. UK Bioethanol, By End-Use Industry, 2016-2028 (US$ Bn)
9.4.4. Italy
9.4.4.1. Italy Bioethanol Market Estimates and Forecast, 2016-2028 (US$ Bn)
9.4.4.2. Italy Bioethanol, By Fuel Blend, 2016-2028 (US$ Bn)
9.4.4.3. Italy Bioethanol, By Feedstock, 2016-2028 (US$ Bn)
9.4.4.4. Italy Bioethanol, By End-Use Industry, 2016-2028 (US$ Bn)
9.4.5. Spain
9.4.5.1. Spain Bioethanol Market Estimates and Forecast, 2016-2028 (US$ Bn)
9.4.5.2. Spain Bioethanol, By Fuel Blend, 2016-2028 (US$ Bn)
9.4.5.3. Spain Bioethanol, By Feedstock, 2016-2028 (US$ Bn)
9.4.5.4. Spain Bioethanol, By End-Use Industry, 2016-2028 (US$ Bn)
9.4.6. Rest of Europe
9.4.6.1. Rest of Europe Bioethanol Market Estimates and Forecast, 2016-2028 (US$ Bn)
9.4.6.2. Rest of Europe Bioethanol, By Fuel Blend, 2016-2028 (US$ Bn)
9.4.6.3. Rest of Europe Bioethanol, By Feedstock, 2016-2028 (US$ Bn)
9.4.6.4. Rest of Europe Bioethanol, By End-Use Industry, 2016-2028 (US$ Bn)

10. Asia Pacific Bioethanol Market Analysis
10.1. Asia Pacific Bioethanol Market, by Fuel Blend, 2016-2028(US$ Bn)
10.1.1. Overview
10.1.2. SRC Analysis
10.2. Asia Pacific Bioethanol Market, by Feedstock, 2016-2028(US$ Bn)
10.2.1. Overview
10.2.2. SRC Analysis
10.3. Asia Pacific Bioethanol Market, by End-Use Industry, 2016-2028(US$ Bn)
10.3.1. Overview
10.3.2. SRC Analysis
10.4. Asia Pacific Bioethanol Market, by Country, 2016-2028 (US$ Bn)
10.4.1. China
10.4.1.1. China Bioethanol Market Estimates and Forecast, 2016-2028 (US$ Bn)
10.4.1.2. China Bioethanol, By Fuel Blend, 2016-2028 (US$ Bn)
10.4.1.3. China Bioethanol, By Feedstock, 2016-2028 (US$ Bn)
10.4.1.4. China Bioethanol, By End-Use Industry, 2016-2028 (US$ Bn)
10.4.2. Japan
10.4.2.1. Japan Bioethanol Market Estimates and Forecast, 2016-2028 (US$ Bn)
10.4.2.2. Japan Bioethanol, By Fuel Blend, 2016-2028 (US$ Bn)
10.4.2.3. Japan Bioethanol, By Feedstock, 2016-2028 (US$ Bn)
10.4.2.4. Japan Bioethanol, By End-Use Industry, 2016-2028 (US$ Bn)
10.4.3. India
10.4.3.1. India Bioethanol Market Estimates and Forecast, 2016-2028 (US$ Bn)
10.4.3.2. India Bioethanol, By Fuel Blend, 2016-2028 (US$ Bn)
10.4.3.3. India Bioethanol, By Feedstock, 2016-2028 (US$ Bn)
10.4.3.4. India Bioethanol, By End-Use Industry, 2016-2028 (US$ Bn)
10.4.4. South Korea
10.4.4.1. South Korea Bioethanol Market Estimates and Forecast, 2016-2028 (US$ Bn)
10.4.4.2. South Korea Bioethanol, By Fuel Blend, 2016-2028 (US$ Bn)
10.4.4.3. South Korea Bioethanol, By Feedstock, 2016-2028 (US$ Bn)
10.4.4.4. South Korea Bioethanol, By End-Use Industry, 2016-2028 (US$ Bn)
10.4.5. South-East Asia
10.4.5.1. South-East Asia Bioethanol Market Estimates and Forecast, 2016-2028 (US$ Bn)
10.4.5.2. South-East Asia Bioethanol, By Fuel Blend, 2016-2028 (US$ Bn)
10.4.5.3. South-East Asia Bioethanol, By Feedstock, 2016-2028 (US$ Bn)
10.4.5.4. South-East Asia Bioethanol, By End-Use Industry, 2016-2028 (US$ Bn)
10.4.6. Rest of Asia Pacific
10.4.6.1. Rest of Asia Pacific Bioethanol Market Estimates and Forecast, 2016-2028 (US$ Bn)
10.4.6.2. Rest of Asia Pacific Bioethanol, By Fuel Blend, 2016-2028 (US$ Bn)
10.4.6.3. Rest of Asia Pacific Bioethanol, By Feedstock, 2016-2028 (US$ Bn)
10.4.6.4. Rest of Asia Pacific Bioethanol, By End-Use Industry, 2016-2028 (US$ Bn)

11. Latin America Bioethanol Market Analysis
11.1. Latin America Bioethanol Market, by Fuel Blend, 2016-2028(US$ Bn)
11.1.1. Overview
11.1.2. SRC Analysis
11.2. Latin America Bioethanol Market, by Feedstock, 2016-2028(US$ Bn)
11.2.1. Overview
11.2.2. SRC Analysis
11.3. Latin America Bioethanol Market, by End-Use Industry, 2016-2028(US$ Bn)
11.3.1. Overview
11.3.2. SRC Analysis
11.4. Latin America Bioethanol Market, by Country, 2016-2028 (US$ Bn)
11.4.1. Brazil
11.4.1.1. Brazil Bioethanol Market Estimates and Forecast, 2016-2028 (US$ Bn)
11.4.1.2. Brazil Bioethanol, By Fuel Blend, 2016-2028 (US$ Bn)
11.4.1.3. Brazil Bioethanol, By Feedstock, 2016-2028 (US$ Bn)
11.4.1.4. Brazil Bioethanol, By End-Use Industry, 2016-2028 (US$ Bn)
11.4.2. Mexico
11.4.2.1. Mexico Bioethanol Market Estimates and Forecast, 2016-2028 (US$ Bn)
11.4.2.2. Mexico Bioethanol, By Fuel Blend, 2016-2028 (US$ Bn)
11.4.2.3. Mexico Bioethanol, By Feedstock, 2016-2028 (US$ Bn)
11.4.2.4. Mexico Bioethanol, By End-Use Industry, 2016-2028 (US$ Bn)
11.4.3. Rest of Latin America
11.4.3.1. Rest of Latin America Bioethanol Market Estimates and Forecast, 2016-2028 (US$ Bn)
11.4.3.2. Rest of Latin America Bioethanol, By Fuel Blend, 2016-2028 (US$ Bn)
11.4.3.3. Rest of Latin America Bioethanol, By Feedstock, 2016-2028 (US$ Bn)
11.4.3.4. Rest of Latin America Bioethanol, By End-Use Industry, 2016-2028 (US$ Bn)

12. Middle East and Africa Bioethanol Market Analysis
12.1. Middle East and Africa Bioethanol Market, by Fuel Blend, 2016-2028(US$ Bn)
12.1.1. Overview
12.1.2. SRC Analysis
12.2. Middle East and Africa Bioethanol Market, by Feedstock, 2016-2028(US$ Bn)
12.2.1. Overview
12.2.2. SRC Analysis
12.3. Middle East and Africa Bioethanol Market, by End-Use Industry, 2016-2028(US$ Bn)
12.3.1. Overview
12.3.2. SRC Analysis
12.4. Middle East and Africa Bioethanol Market, by Country, 2016-2028 (US$ Bn)
12.4.1. GCC Countries
12.4.1.1. GCC Countries Bioethanol Market Estimates and Forecast, 2016-2028 (US$ Bn)
12.4.1.2. GCC Countries Bioethanol, By Fuel Blend, 2016-2028 (US$ Bn)
12.4.1.3. GCC Countries Bioethanol, By Feedstock, 2016-2028 (US$ Bn)
12.4.1.4. GCC Countries Bioethanol, By End-Use Industry, 2016-2028 (US$ Bn)
12.4.2. South Africa
12.4.2.1. South Africa Bioethanol Market Estimates and Forecast, 2016-2028 (US$ Bn)
12.4.2.2. South Africa Bioethanol, By Fuel Blend, 2016-2028 (US$ Bn)
12.4.2.3. South Africa Bioethanol, By Feedstock, 2016-2028 (US$ Bn)
12.4.2.4. South Africa Bioethanol, By End-Use Industry, 2016-2028 (US$ Bn)
12.4.3. Rest of Middle East and Africa
12.4.3.1. Rest of Middle East and Africa Bioethanol Market Estimates and Forecast, 2016-2028 (US$ Bn)
12.4.3.2. Rest of Middle East and Africa Bioethanol, By Fuel Blend, 2016-2028 (US$ Bn)
12.4.3.3. Rest of Middle East and Africa Bioethanol, By Feedstock, 2016-2028 (US$ Bn)
12.4.3.4. Rest of Middle East and Africa Bioethanol, By End-Use Industry, 2016-2028 (US$ Bn)

13. Company Profiles
13.1. POET LLC (US)
13.1.1. Company Overview
13.1.2. Fuel Blends/Services Portfolio
13.1.3. Geographical Presence
13.1.4. Financial Summary
13.1.4.1. Market Revenue and Net Profit (2019-2021)
13.1.4.2. Business Segment Revenue Analysis
13.1.4.3. Geographical Revenue Analysis
13.2. Green Plains (US)
13.3. Tereos (France)
13.4. Valero Energy Corporation (US)
13.5. Archer Daniels Midland (US)
13.6. Raizen (Brazil)
13.7. Flint Hills Resources (US)
13.8. Pacific Ethanol (US)
13.9. Sekab Biofuels & Chemicals AB (Sweden)
13.10. The Andersons Inc (US)
13.11. Others


List of Figures

FIG. 1 Global Bioethanol Market: Research Methodology
FIG. 2 Market Size Estimation – Top Down & Bottom up Approach
FIG. 3 Global Bioethanol Market Segmentation
FIG. 4 Global Bioethanol Market, by Fuel Blend, 2021 (US$ Bn)
FIG. 5 Global Bioethanol Market, by Feedstock, 2021 (US$ Bn)
FIG. 6 Global Bioethanol Market, by End-Use Industry, 2021 (US$ Bn)
FIG. 7 Global Bioethanol Market, by Geography, 2021 (US$ Bn)
FIG. 8 Attractive Investment Proposition, by Fuel Blend, 2021
FIG. 9 Attractive Investment Proposition, by Feedstock, 2021
FIG. 10 Attractive Investment Proposition, by End-Use Industry, 2021
FIG. 11 Attractive Investment Proposition, by Geography, 2021
FIG. 12 Global Market Share Analysis of Key Bioethanol Market Manufacturers, 2021
FIG. 13 Global Market Positioning of Key Bioethanol Market Manufacturers, 2021
FIG. 14 Global Bioethanol Market Value Contribution, By Fuel Blend, 2021 & 2028 (Value %)
FIG. 15 Global Bioethanol Market, by E5, Value, 2016-2028 (US$ Bn)
FIG. 16 Global Bioethanol Market, by E10, Value, 2016-2028 (US$ Bn)
FIG. 17 Global Bioethanol Market, by E15 to E70, Value, 2016-2028 (US$ Bn)
FIG. 18 Global Bioethanol Market, by E75 & E85, Value, 2016-2028 (US$ Bn)
FIG. 19 Global Bioethanol Market, by Others (E85 to E100), Value, 2016-2028 (US$ Bn)
FIG. 20 Global Bioethanol Market Value Contribution, By Feedstock, 2021 & 2028 (Value %)
FIG. 21 Global Bioethanol Market, by Starch based, Value, 2016-2028 (US$ Bn)
FIG. 22 Global Bioethanol Market, by Sugar based, Value, 2016-2028 (US$ Bn)
FIG. 23 Global Bioethanol Market, by Cellulose-based, Value, 2016-2028 (US$ Bn)
FIG. 24 Global Bioethanol Market Value Contribution, By End-Use Industry, 2021 & 2028 (Value %)
FIG. 25 Global Bioethanol Market, by Transportation, Value, 2016-2028 (US$ Bn)
FIG. 26 Global Bioethanol Market, by Alcoholic Beverages, Value, 2016-2028 (US$ Bn)
FIG. 27 Global Bioethanol Market, by Cosmetics, Value, 2016-2028 (US$ Bn)
FIG. 28 Global Bioethanol Market, by Pharmaceuticals, Value, 2016-2028 (US$ Bn)
FIG. 29 Global Bioethanol Market, by Others (chemical, paint & coatings), Value, 2016-2028 (US$ Bn)
FIG. 30 U.S. Bioethanol Market, 2016-2028 (US$ Bn)
FIG. 31 Canada Bioethanol Market, 2016-2028 (US$ Bn)
FIG. 32 Germany Bioethanol Market, 2016-2028 (US$ Bn)
FIG. 33 France Bioethanol Market, 2016-2028 (US$ Bn)
FIG. 34 U.K. Bioethanol Market, 2016-2028 (US$ Bn)
FIG. 35 Italy Bioethanol Market, 2016-2028 (US$ Bn)
FIG. 36 Spain Bioethanol Market, 2016-2028 (US$ Bn)
FIG. 37 Rest of Europe Bioethanol Market, 2016-2028 (US$ Bn)
FIG. 38 China Bioethanol Market, 2016-2028 (US$ Bn)
FIG. 39 Japan Bioethanol Market, 2016-2028 (US$ Bn)
FIG. 40 India Bioethanol Market, 2016-2028 (US$ Bn)
FIG. 41 South Korea Bioethanol Market, 2016-2028 (US$ Bn)
FIG. 42 Southeast Asia Bioethanol Market, 2016-2028 (US$ Bn)
FIG. 43 Rest of Asia Pacific Bioethanol Market, 2016-2028 (US$ Bn)
FIG. 44 Latin America Bioethanol Market, 2016-2028 (US$ Bn)
FIG. 45 Brazil Bioethanol Market, 2016-2028 (US$ Bn)
FIG. 46 Mexico Bioethanol Market, 2016-2028 (US$ Bn)
FIG. 47 Rest of Latin America Bioethanol Market, 2016-2028 (US$ Bn)
FIG. 48 Middle East & Africa Bioethanol Market, 2016-2028 (US$ Bn)
FIG. 49 GCC Countries Bioethanol Market, 2016-2028 (US$ Bn)
FIG. 50 South Africa Bioethanol Market, 2016-2028 (US$ Bn)
FIG. 51 Rest of Middle East and Africa Bioethanol Market, 2016-2028 (US$ Bn)

List of Tables

TABLE 1 Market Snapshot: Global Bioethanol Market
TABLE 2 Global Bioethanol Market, by Competitive Benchmarking, 2021
TABLE 3 Global Bioethanol Market, by Geographical Presence Analysis, 2021
TABLE 4 Global Bioethanol Market, by Key Strategies Analysis, 2021
TABLE 5 Global Bioethanol Market, by Fuel Blend, 2016-2028 (US$ Bn)
TABLE 6 Global Bioethanol Market, by Feedstock, 2016-2028 (US$ Bn)
TABLE 7 Global Bioethanol Market, by End-Use Industry, 2016-2028 (US$ Bn)
TABLE 8 Global Bioethanol Market, by Geography, 2016-2028 (US$ Bn)
TABLE 9 North America Bioethanol Market, by Fuel Blend, 2016-2028 (US$ Bn)
TABLE 10 North America Bioethanol Market, by Feedstock, 2016-2028 (US$ Bn)
TABLE 11 North America Bioethanol Market, by End-Use Industry, 2016-2028 (US$ Bn)
TABLE 12 North America Bioethanol Market, by Country, 2016-2028 (US$ Bn)
TABLE 13 US Bioethanol Market, by Fuel Blend, 2016-2028 (US$ Bn)
TABLE 14 US Bioethanol Market, by Feedstock, 2016-2028 (US$ Bn)
TABLE 15 US Bioethanol Market, by End-Use Industry, 2016-2028 (US$ Bn)
TABLE 16 Canada Bioethanol Market, by Fuel Blend, 2016-2028 (US$ Bn)
TABLE 17 Canada Bioethanol Market, by Feedstock, 2016-2028 (US$ Bn)
TABLE 18 Canada Bioethanol Market, by End-Use Industry, 2016-2028 (US$ Bn)
TABLE 19 Europe Bioethanol Market, by Fuel Blend, 2016-2028 (US$ Bn)
TABLE 20 Europe Bioethanol Market, by Feedstock, 2016-2028 (US$ Bn)
TABLE 21 Europe Bioethanol Market, by End-Use Industry, 2016-2028 (US$ Bn)
TABLE 22 Europe Bioethanol Market, by Country, 2016-2028 (US$ Bn)
TABLE 23 Germany Bioethanol Market, by Fuel Blend, 2016-2028 (US$ Bn)
TABLE 24 Germany Bioethanol Market, by Feedstock, 2016-2028 (US$ Bn)
TABLE 25 Germany Bioethanol Market, by End-Use Industry, 2016-2028 (US$ Bn)
TABLE 26 France Bioethanol Market, by Fuel Blend, 2016-2028 (US$ Bn)
TABLE 27 France Bioethanol Market, by Feedstock, 2016-2028 (US$ Bn)
TABLE 28 France Bioethanol Market, by End-Use Industry, 2016-2028 (US$ Bn)
TABLE 29 UK Bioethanol Market, by Fuel Blend, 2016-2028 (US$ Bn)
TABLE 30 UK Bioethanol Market, by Feedstock, 2016-2028 (US$ Bn)
TABLE 31 UK Bioethanol Market, by End-Use Industry, 2016-2028 (US$ Bn)
TABLE 32 Italy Bioethanol Market, by Fuel Blend, 2016-2028 (US$ Bn)
TABLE 33 Italy Bioethanol Market, by Feedstock, 2016-2028 (US$ Bn)
TABLE 34 Italy Bioethanol Market, by End-Use Industry, 2016-2028 (US$ Bn)
TABLE 35 Spain Bioethanol Market, by Fuel Blend, 2016-2028 (US$ Bn)
TABLE 36 Spain Bioethanol Market, by Feedstock, 2016-2028 (US$ Bn)
TABLE 37 Spain Bioethanol Market, by End-Use Industry, 2016-2028 (US$ Bn)
TABLE 38 Rest of Europe Bioethanol Market, by Fuel Blend, 2016-2028 (US$ Bn)
TABLE 39 Rest of Europe Bioethanol Market, by Feedstock, 2016-2028 (US$ Bn)
TABLE 40 Rest of Europe Bioethanol Market, by End-Use Industry, 2016-2028 (US$ Bn)
TABLE 41 Asia Pacific Bioethanol Market, by Fuel Blend, 2016-2028 (US$ Bn)
TABLE 42 Asia Pacific Bioethanol Market, by Feedstock, 2016-2028 (US$ Bn)
TABLE 43 Asia Pacific Bioethanol Market, by End-Use Industry, 2016-2028 (US$ Bn)
TABLE 44 Asia Pacific Bioethanol Market, by Country, 2016-2028 (US$ Bn)
TABLE 45 China Bioethanol Market, by Fuel Blend, 2016-2028 (US$ Bn)
TABLE 46 China Bioethanol Market, by Feedstock, 2016-2028 (US$ Bn)
TABLE 47 China Bioethanol Market, by End-Use Industry, 2016-2028 (US$ Bn)
TABLE 48 Japan Bioethanol Market, by Fuel Blend, 2016-2028 (US$ Bn)
TABLE 49 Japan Bioethanol Market, by Feedstock, 2016-2028 (US$ Bn)
TABLE 50 Japan Bioethanol Market, by End-Use Industry, 2016-2028 (US$ Bn)
TABLE 51 India Bioethanol Market, by Fuel Blend, 2016-2028 (US$ Bn)
TABLE 52 India Bioethanol Market, by Feedstock, 2016-2028 (US$ Bn)
TABLE 53 India Bioethanol Market, by End-Use Industry, 2016-2028 (US$ Bn)
TABLE 54 South Korea Bioethanol Market, by Fuel Blend, 2016-2028 (US$ Bn)
TABLE 55 South Korea Bioethanol Market, by Feedstock, 2016-2028 (US$ Bn)
TABLE 56 South Korea Bioethanol Market, by End-Use Industry, 2016-2028 (US$ Bn)
TABLE 57 South East Asia Bioethanol Market, by Fuel Blend, 2016-2028 (US$ Bn)
TABLE 58 South East Asia Bioethanol Market, by Feedstock, 2016-2028 (US$ Bn)
TABLE 59 South East Asia Bioethanol Market, by End-Use Industry, 2016-2028 (US$ Bn)
TABLE 60 Rest of Asia Pacific Bioethanol Market, by Fuel Blend, 2016-2028 (US$ Bn)
TABLE 61 Rest of Asia Pacific Bioethanol Market, by Feedstock, 2016-2028 (US$ Bn)
TABLE 62 Rest of Asia Pacific Bioethanol Market, by End-Use Industry, 2016-2028 (US$ Bn)
TABLE 63 Latin America Bioethanol Market, by Fuel Blend, 2016-2028 (US$ Bn)
TABLE 64 Latin America Bioethanol Market, by Feedstock, 2016-2028 (US$ Bn)
TABLE 65 Latin America Bioethanol Market, by End-Use Industry, 2016-2028 (US$ Bn)
TABLE 66 Latin America Bioethanol Market, by Country, 2016-2028 (US$ Bn)
TABLE 67 Brazil Bioethanol Market, by Fuel Blend, 2016-2028 (US$ Bn)
TABLE 68 Brazil Bioethanol Market, by Feedstock, 2016-2028 (US$ Bn)
TABLE 69 Brazil Bioethanol Market, by End-Use Industry, 2016-2028 (US$ Bn)
TABLE 70 Mexico Bioethanol Market, by Fuel Blend, 2016-2028 (US$ Bn)
TABLE 71 Mexico Bioethanol Market, by Feedstock, 2016-2028 (US$ Bn)
TABLE 72 Mexico Bioethanol Market, by End-Use Industry, 2016-2028 (US$ Bn)
TABLE 73 Rest of Latin America Bioethanol Market, by Fuel Blend, 2016-2028 (US$ Bn)
TABLE 74 Rest of Latin America Bioethanol Market, by Feedstock, 2016-2028 (US$ Bn)
TABLE 75 Rest of Latin America Bioethanol Market, by End-Use Industry, 2016-2028 (US$ Bn)
TABLE 76 Middle East and Africa Bioethanol Market, by Fuel Blend, 2016-2028 (US$ Bn)
TABLE 77 Middle East and Africa Bioethanol Market, by Feedstock, 2016-2028 (US$ Bn)
TABLE 78 Middle East and Africa Bioethanol Market, by End-Use Industry, 2016-2028 (US$ Bn)
TABLE 79 Middle East and Africa Bioethanol Market, by Country, 2016-2028 (US$ Bn)
TABLE 80 GCC Countries Bioethanol Market, by Fuel Blend, 2016-2028 (US$ Bn)
TABLE 81 GCC Countries Bioethanol Market, by Feedstock, 2016-2028 (US$ Bn)
TABLE 82 GCC Countries Bioethanol Market, by End-Use Industry, 2016-2028 (US$ Bn)
TABLE 83 South Africa Bioethanol Market, by Fuel Blend, 2016-2028 (US$ Bn)
TABLE 84 South Africa Bioethanol Market, by Feedstock, 2016-2028 (US$ Bn)
TABLE 85 South Africa Bioethanol Market, by End-Use Industry, 2016-2028 (US$ Bn)
TABLE 86 Rest of Middle East and Africa Bioethanol Market, by Fuel Blend, 2016-2028 (US$ Bn)
TABLE 87 Rest of Middle East and Africa Bioethanol Market, by Feedstock, 2016-2028 (US$ Bn)
TABLE 88 Rest of Middle East and Africa Bioethanol Market, by End-Use Industry, 2016-2028 (US$ Bn)

Frequently Asked Questions:

How has COVID-19 impacted the global bioethanol market?

The global bioethanol market also suffered from the COVID-19 pandemic, which resulted in a decline of over 7.1% in revenue generated in 2020.

Which is the leading market for bioethanol market?

North America accounted for the highest share in the global bioethanol market regarding value and volume.

What are the key drivers for the growth of the bioethanol market?

Rising environmental concerns that push manufacturers to produce bioethanol, blending requirements from regulatory bodies like the EPA (Environmental Protection Agency), and an abundance of raw material supply are the key factors propelling the global market growth.

Which is the major segment in the bioethanol market by Feedstock?

The sugar-based segment had a major share in 2021, with more than 52% of the market revenue. Besides, starch-based are projected to witness the fastest growth.

Which is the major segment in the bioethanol market by End-Use Industry?

Transportation had a major share in the global market in 2021 and is projected to continue its dominance over the forecast period.

Power Distribution Unit Market

Published:
Report ID: 11062

Smart Grid Market

Published:
Report ID: 6144

Hydraulic Fracturing Market

Published:
Report ID: 7544

Coal Bed Methane Market

Published:
Report ID: 3595

Solar Water Pump Market

Published:
Report ID: 36797

Artificial Lift Systems Market

Published:
Report ID: 2043

U.S. Ground Power Unit Market

Published:
Report ID: 36528

Germany Ground Power Unit Market

Published:
Report ID: 36282

Solar Generator Market

Published:
Report ID: 36226

Drilling Fluids Market

Published:
Report ID: 5398

Gas Engines Market

Published:
Report ID: 6044

Purchase Options

$2999
Delivery Format: Excel.
$4999
Designed for the individual purchaser.
$6999
Users located at a single corporate site or regional office.
$7999
Allowed for unlimited sharing globally within one company.
Smallform of Sample request

Have a question?

User Profile

Don’t settle for less – trust Mitul to help you find the best solution.

Report delivery within 24 to 48 hours

– Other Info –

What people say?-

User Review

I am very impressed with the information in this report. The author clearly did their research when they came up with this product and it has already given me a lot of ideas.

Jana Schmidt
CEDAR CX Technologies

– Connect with us –

Phone

+91 6232 49 3207


support

24/7 Research Support


sales@credenceresearch.com

– Research Methodology –

Going beyond the basics: advanced techniques in research methodology

– Trusted By –

Pepshi, LG, Nestle
Motorola, Honeywell, Johnson and johnson
LG Chem, SIEMENS, Pfizer
Unilever, Samsonite, QIAGEN