Market Overview:
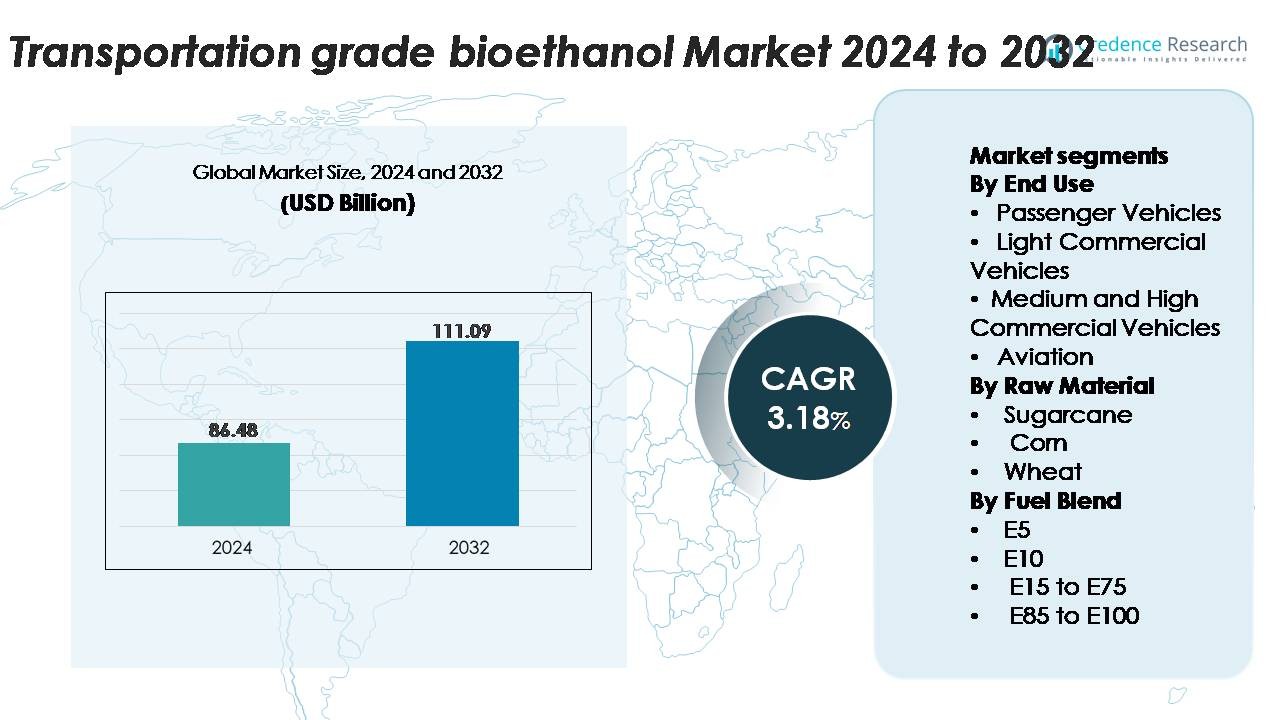
The global transportation-grade bioethanol market was valued at USD 86.48 billion in 2024 and is anticipated to reach USD 111.09 billion by 2032, advancing at a CAGR of 3.18% during the forecast period.
| REPORT ATTRIBUTE |
DETAILS |
| Historical Period |
2020-2023 |
| Base Year |
2024 |
| Forecast Period |
2025-2032 |
| Transportation-Grade Bioethanol Market Size 2024 |
USD 86.48 Billion |
| Transportation-Grade Bioethanol Market, CAGR |
3.18% |
| Transportation-Grade Bioethanol Market Size 2032 |
USD 111.09 Billion |
The transportation-grade bioethanol market is dominated by large integrated producers and advanced biorefinery operators that maintain strong global supply capabilities. Key players such as Raízen, Archer Daniels Midland Company (ADM), Valero Energy Corporation, POET LLC, Green Plains Inc., and Cargill lead the competitive landscape through extensive feedstock networks, high-efficiency processing technologies, and strong downstream partnerships with fuel distributors and automakers. These companies continue to expand capacity and invest in next-generation ethanol technologies to enhance yield and sustainability performance. North America remains the leading region with approximately 40% market share, supported by mature infrastructure, widespread E10/E15 adoption, and robust domestic production.
Access crucial information at unmatched prices!
Request your sample report today & start making informed decisions powered by Credence Research Inc.!
Download Sample
Market Insights:
- The transportation-grade bioethanol market reached USD 86.48 billion in 2024 and is projected to climb to USD 111.09 billion by 2032, expanding at a CAGR of 3.18% during the forecast period.
- Demand is driven by expanding national blending mandates, rising flex-fuel vehicle adoption, and government initiatives promoting E10 and higher blends across major economies; passenger vehicles hold the largest end-use share, supported by widespread compatibility and strong policy enforcement.
- Market trends include rapid growth in E20–E85 adoption, increasing investments in second-generation ethanol technologies, and emerging opportunities in alcohol-to-jet fuel pathways as aviation accelerates decarbonization strategies.
- Competition intensifies as leaders such as Raízen, ADM, Valero, POET LLC, Cargill, and Green Plains expand advanced biorefineries, though the industry faces restraints from feedstock price volatility and infrastructure limitations for high-blend distribution.
- Regionally, North America holds 38–40% of the market, followed by Asia-Pacific at 26–28%, Europe at 22–24%, with Latin America and MEA contributing the remaining share.
Market Segmentation Analysis:
By End Use
Passenger vehicles dominate the transportation-grade bioethanol market, accounting for the largest share due to widespread flex-fuel adoption, faster integration of bioethanol-compatible engines, and strong policy support for low-carbon mobility. Automakers continue expanding E10–E85 compatible models to meet tightening emission norms, which strengthens demand from this segment. Light commercial vehicles and medium & high commercial vehicles follow, supported by rising fleet decarbonization programs. Although still emerging, aviation presents a long-term opportunity as airlines accelerate testing of alcohol-to-jet (ATJ) fuels to reduce lifecycle emissions.
- For instance, Ford has produced over 2 million flex-fuel vehicles worldwide over a decade, with models like the F-150 FFV operating on blends up to E85, demonstrating large-scale OEM integration.
By Raw Material
Sugarcane remains the dominant raw material in the market owing to its high sucrose yield, favorable energy balance, and cost-efficient conversion pathways. Its strong market share is driven by large-scale cultivation in Brazil, India, and parts of Southeast Asia, supported by established distillation infrastructure. Corn follows as a major feedstock in North America, backed by advanced dry-mill ethanol plants. Wheat-based ethanol usage continues to grow in Europe due to feedstock availability and policy incentives, while other biomass sources contribute to diversification efforts and supply stability.
- For instance, the new unit at Raízen’s Bonfim second-generation ethanol complex has an annual production capacity of 82 million liters of cellulosic ethanol, utilizing sugarcane bagasse and straw residues for production, demonstrating industrial-scale utilization of sugarcane residues.
By Fuel Blend
E10 leads the transportation-grade bioethanol market as the dominant fuel blend, capturing the highest share due to its compatibility with existing vehicle fleets and mandated blending programs across major economies. Its widespread adoption is driven by minimal engine modification requirements and strong government emphasis on lowering tailpipe emissions. E5 is used in regions with early-stage blending mandates, while E15 to E75 blends gain traction in flex-fuel vehicle segments. E85 to E100 blends continue expanding in markets with high flex-fuel penetration, particularly where ethanol production is abundant and competitively priced.
Key Growth Drivers
Expanding National Blending Mandates and Decarbonization Policies
Stringent emissions-reduction policies and aggressive national biofuel blending mandates are major forces accelerating the adoption of transportation-grade bioethanol. Governments in North America, Europe, and Asia are steadily increasing E10, E15, and E20 mandates while offering fiscal incentives, carbon credit programs, and tax exemptions to boost the transition away from fossil fuels. These regulatory frameworks directly enhance demand across passenger vehicles, commercial fleets, and flex-fuel vehicle segments. Additionally, global commitments to net-zero pathways push policymakers to promote renewable liquid fuels as an immediate, low-disruption decarbonization tool. Bioethanol’s lifecycle emissions reduction advantage strengthens its role in meeting interim climate targets, especially in markets where electrification moves slowly due to infrastructure constraints. This convergence of regulation, environmental pressure, and blending enforcement ensures sustained market expansion.
- For instance, Valero Energy Corporation has a combined annual production capacity of approximately 1.6 to 1.7 billion gallons of ethanol through its 12 U.S. plants, and in a recent single year (2023), its actual production was about 1.6 billion gallons.
Rising Flex-Fuel Vehicle Adoption and Engine Compatibility Improvements
The growing volume of flex-fuel vehicles (FFVs) capable of operating on E10 to E85 blends significantly boosts the transportation-grade bioethanol market. Automakers are increasingly integrating ethanol-compatible fuel systems, corrosion-resistant components, and adaptive engine calibration technologies that allow vehicles to optimize combustion across varying ethanol concentrations. Enhanced cold-start systems, high-compression engines, and improved injection technologies have strengthened ethanol’s operational efficiency and reduced performance gaps relative to gasoline. Countries such as Brazil, the U.S., and India are scaling FFV programs to diversify energy sources and reduce dependence on imported crude oil. Rising consumer awareness about the cost-effectiveness and cleaner combustion profile of ethanol fuels further encourages adoption. As automakers expand FFV offerings and governments enforce biofuel-ready engine standards, vehicle compatibility becomes a key driver sustaining long-term ethanol demand.
- For instance, General Motors has produced more than 17 million flex-fuel vehicles globally, with models such as the Chevrolet Silverado 1500 FFV supporting blends up to E85, demonstrating large-scale OEM commitment to ethanol-compatible engineering.
Increasing Agricultural Productivity and Advanced Feedstock Processing
Improvements in feedstock cultivation and the emergence of advanced conversion pathways strongly support bioethanol availability and cost efficiency. High-yield sugarcane and corn varieties, precision farming technologies, and better irrigation practices enhance feedstock output per hectare. Parallel advancements in enzymatic hydrolysis, fermentation efficiency, and biorefinery optimization reduce production costs and increase ethanol yield per ton of biomass. Second-generation (2G) ethanol technologies further expand feedstock flexibility by enabling conversion of agricultural residues such as bagasse, corn stover, and wheat straw, reducing competition with food crops. Countries adopting 2G plants at commercial scale create new supply streams that stabilize production during crop volatility. Collectively, this integrated improvement in agricultural and processing capabilities strengthens market reliability, reduces supply risks, and drives bioethanol expansion across transport applications.
Key Trends & Opportunities:
Growth of Higher-Ethanol Blends and Flex-Fuel Infrastructure Expansion
A notable trend shaping market opportunities is the rising acceptance of higher-ethanol blends, including E20, E27, and E85, supported by regulatory approvals and fuel-retail infrastructure upgrades. Fuel distributors increasingly invest in ethanol-compatible storage tanks, dispensing pumps, and vapor recovery systems to support blend diversification. Countries with abundant feedstock availability are accelerating transitions from E10 to higher blends to achieve deeper emissions cuts while maximizing domestic agricultural value. Expanding flex-fuel corridors, dedicated ethanol stations, and digital compliance systems for blending traceability further create opportunities for market penetration. As infrastructure modernization aligns with consumer incentives and FFV growth, higher-blend adoption becomes a major enabler of market scaling.
- For instance, Growth Energy reported that U.S. retailers expanded their E15 and E85 offerings, with over 4,200 stations now offering E15 (also known as Unleaded 88) across 33 states.
Advancements in Alcohol-to-Jet Fuel Pathways and Aviation Sector Integration
Bioethanol’s use in aviation is emerging as a high-impact opportunity, driven by global interest in sustainable aviation fuels (SAF). Alcohol-to-jet (ATJ) technology enables conversion of ethanol into drop-in jet fuel with significant lifecycle emission advantages compared to conventional aviation kerosene. Several airlines and fuel producers are conducting pilot-scale and commercial-scale ATJ production trials, supported by strong policy momentum under ICAO’s CORSIA framework. As airlines face mounting pressure to decarbonize long-haul operations, ethanol-derived SAF offers an accessible, scalable, and cost-efficient pathway. Strategic partnerships between bioethanol producers, refiners, and airline operators create new value pools, positioning ethanol as a critical component of future aviation sustainability strategies.
- For instance, LanzaJet commissioned its Freedom Pines Fuels plant in Georgia with a commercial ATJ capacity of 10 million gallons per year, producing ASTM-certified SAF directly from ethanol.
Circular Bioeconomy Integration and Co-Product Valorization
Integration of circular bioeconomy models presents strong growth potential, as modern biorefineries increasingly extract value from co-products such as distillers’ dried grains with solubles (DDGS), bioelectricity, biochemicals, and CO₂ utilization streams. These additional revenue streams increase profitability and reduce dependence on fuel margins. The development of carbon capture technologies in bioethanol plants enables utilization of high-purity CO₂ for food-grade applications, algae cultivation, and synthetic fuel pathways. Opportunities also arise from converting lignin and agricultural residues into bioplastics, renewable chemicals, and advanced materials. The multi-product potential of integrated biorefineries enhances economic resilience and strengthens ethanol’s appeal as a sustainable fuel system.
Key Challenges:
Feedstock Price Volatility and Competition with Food Supply Chains
Variability in agricultural output and fluctuations in sugarcane, corn, and wheat prices pose significant challenges to maintaining stable ethanol production costs. Weather disruptions, fertilizer shortages, pest outbreaks, and global commodity market swings directly affect feedstock pricing, creating supply instability. Bioethanol producers also face persistent criticism regarding food-versus-fuel competition, especially when feedstock demand pressures food supply or pricing. Although 2G technologies can mitigate these concerns, scaling them remains capital-intensive and technologically complex. Ensuring sustainable feedstock procurement while maintaining cost competitiveness continues to be one of the most critical constraints for long-term market consistency.
Infrastructure Limitations and Blend Compatibility Restrictions
Despite regulatory support, the adoption of higher ethanol blends faces structural obstacles, including limited availability of compatible fuel stations, storage systems, and distribution networks. Many regions lack ethanol-friendly pipelines, prompting dependence on road or rail transport, which increases cost and reduces market reach. Additionally, a substantial portion of the existing vehicle fleet is not designed for blends above E10, constraining rapid transition toward E20 or E85. Resistance from fuel retailers due to equipment upgrade costs further slows infrastructure expansion. Without coordinated investment between governments, automakers, and fuel distributors, blend adoption and wider bioethanol utilization remain restricted.
Regional Analysis:
North America
North America holds the largest share of the transportation-grade bioethanol market, accounting for around 40%, driven by mature production capacity in the U.S. and extensive corn-ethanol integration across fuel systems. Strong E10 and E15 mandates, widespread flex-fuel vehicle availability, and a well-developed blending and distribution network support sustained consumption. The region benefits from advanced biorefineries, regulatory stability, and technology investments in second-generation ethanol. Canada’s evolving clean-fuel standard and increasing interest in low-carbon transportation further enhance market growth, reinforcing North America’s leadership in both production scale and policy-driven demand.
Europe
Europe represents approximately 24% of the transportation-grade bioethanol market, supported by stringent decarbonization policies and increasing adoption of renewable fuel directives across member states. E10 penetration continues expanding in Germany, France, the U.K., and the Nordics, while initiatives to transition to higher blends such as E20 reinforce long-term demand. The region also accelerates investments in advanced and waste-derived ethanol to meet sustainability criteria under RED II and RED III mandates. Strong focus on lifecycle emissions reduction, coupled with aviation sector interest in alcohol-to-jet fuels, positions Europe as a key innovation-driven market.
Asia-Pacific
Asia-Pacific accounts for around 28% of global demand, with rapid growth driven by large-scale blending programs in China, India, Thailand, and Australia. Expanding E10 and E20 rollouts, strong agricultural feedstock bases, and government initiatives to reduce oil import dependency reinforce regional consumption. India’s aggressive push toward nationwide E20 adoption and significant investment in 1G and 2G ethanol facilities strengthens long-term supply. Southeast Asian markets are advancing sugarcane- and cassava-based ethanol production, improving regional competitiveness. Increasing urbanization and rising flex-fuel vehicle programs further accelerate Asia-Pacific’s position as a high-growth bioethanol corridor.
Latin America
Latin America holds around 12% of the transportation-grade bioethanol market, anchored by Brazil’s globally recognized ethanol ecosystem. Brazil’s widespread use of E27 gasoline and E100 in flex-fuel vehicles positions the country as a technological and consumption leader. Expansive sugarcane plantations, efficient biorefineries, and integrated bagasse-to-energy systems enhance cost competitiveness. Colombia, Argentina, and Paraguay also strengthen regional demand through E10 and E12 mandates. Continued government support for renewable fuels and rising flex-fuel adoption ensure stable market growth across Latin America, with Brazil remaining the dominant influencer in production and consumption trends.
Middle East & Africa
The Middle East & Africa region holds a smaller share of around 6%, yet shows increasing adoption of ethanol-blended fuels driven by emerging clean-fuel programs in South Africa, Egypt, and parts of the Gulf. Limited domestic feedstock availability constrains large-scale production, but rising interest in diversifying energy sources and meeting emission-reduction targets creates long-term potential. Governments are evaluating E5 and E10 integration to reduce reliance on imported gasoline. Investment partnerships with global ethanol producers and growing environmental policies are expected to gradually expand regional market participation, particularly in urban transport applications.
Market Segmentations:
By End Use
- Passenger Vehicles
- Light Commercial Vehicles
- Medium and High Commercial Vehicles
- Aviation
By Raw Material
By Fuel Blend
- E5
- E10
- E15 to E75
- E85 to E100
By Geography
- North America
- Europe
- Germany
- France
- U.K.
- Italy
- Spain
- Rest of Europe
- Asia Pacific
- China
- Japan
- India
- South Korea
- South-east Asia
- Rest of Asia Pacific
- Latin America
- Brazil
- Argentina
- Rest of Latin America
- Middle East & Africa
- GCC Countries
- South Africa
- Rest of the Middle East and Africa
Competitive Landscape:
The competitive landscape of the transportation-grade bioethanol market is characterized by strong participation from established biofuel producers, integrated agribusinesses, and advanced biorefinery operators. Leading companies focus on expanding production capacity, improving fermentation efficiency, and adopting second-generation technologies to strengthen cost competitiveness and reduce feedstock dependency. Strategic partnerships with automotive manufacturers, fuel distributors, and aviation stakeholders are accelerating market penetration across higher ethanol blends and emerging alcohol-to-jet pathways. Firms also invest heavily in carbon-reduction initiatives, including CO₂ capture, energy-efficient distillation, and waste-to-value applications, to meet tightening sustainability standards. Expansion into high-growth regions such as Asia-Pacific and Latin America further intensifies competition as producers leverage feedstock availability and government blending mandates. Continuous innovation in enzyme technologies, feedstock diversification, and integrated biorefinery models positions market leaders to capitalize on rising global demand for low-carbon liquid fuels.
Shape Your Report to Specific Countries or Regions & Enjoy 30% Off!
Key Player Analysis:
Recent Developments:
- Archer Daniels Midland Company (ADM) has launched a landmark carbon capture initiative in the bioethanol sector. In November 2025, ADM began operations at a new carbon capture and storage (CCS) project at its Corn Processing Complex in Columbus, Nebraska, establishing the world’s largest bioethanol carbon capture facility. The facility connects to Tallgrass’s Trailblazer pipeline, which can transport over 10 million tons of CO2 per year to a permanent storage hub in Eastern Wyoming. This capacity is equivalent to removing more than 2 million passenger vehicles from the road. The project was developed using voluntary landowner easements, demonstrating community collaboration in implementing industrial decarbonization. ADM’s commitment to decarbonization aligns with its broader strategy to reduce emissions across global operations while meeting growing demand for low-carbon food, feed, and fuel ingredients.
- POET LLC has significantly expanded its bioethanol production capacity through acquisition in 2025. In September 2025, the world’s largest bioethanol producer announced an agreement to acquire Green Plains Obion, a bioethanol facility in northwestern Tennessee. The acquisition adds 120 million gallons of annual production capacity and strengthens POET’s access to southeastern U.S. markets. This transaction expands POET’s portfolio to 35 bioprocessing facilities across nine U.S. states with a combined annual production capacity of 3.1 billion gallons of bioethanol. The Obion facility, commissioned in 2008, covers 230 acres with excellent infrastructure including corn storage and rail access. The transaction was expected to close in the third quarter of 2025.
- Cargill has expanded its renewable energy footprint in Brazil through multiple strategic moves. In February 2025, Cargill acquired the remaining 50% stake in SJC Bioenergia, giving it full control of the sugar and renewable energy company. This acquisition strengthens Cargill’s presence in Brazil’s renewable energy sector, with SJC Bioenergia operating two agro-industrial units in Goiás that produce sugar, ethanol (hydrated and anhydrous), corn oil, and high-protein dried distillers’ grains. Additionally, in August 2025, Cargill announced plans to build a new corn ethanol plant adjacent to its sugarcane facility in Brazil’s Center-Western state of Goiás. This expansion builds on Cargill’s earlier acquisition of a 50% stake in SJC Bioenergia in February 2024.
Report Coverage:
The research report offers an in-depth analysis based on End-Use, Raw material, Fuel blend and Geography. It details leading market players, providing an overview of their business, product offerings, investments, revenue streams, and key applications. Additionally, the report includes insights into the competitive environment, SWOT analysis, current market trends, as well as the primary drivers and constraints. Furthermore, it discusses various factors that have driven market expansion in recent years. The report also explores market dynamics, regulatory scenarios, and technological advancements that are shaping the industry. It assesses the impact of external factors and global economic changes on market growth. Lastly, it provides strategic recommendations for new entrants and established companies to navigate the complexities of the market.
Future Outlook:
- Global blending mandates are expected to strengthen, pushing widespread adoption of E10, E20, and higher ethanol blends across major automotive markets.
- Flex-fuel vehicle availability will expand as automakers integrate ethanol-compatible engines to meet tightening emission standards.
- Second-generation ethanol production will scale rapidly, improving feedstock diversification through agricultural residues and waste biomass.
- Alcohol-to-jet fuel technologies will gain momentum as aviation accelerates its shift toward sustainable aviation fuels.
- Investments in biorefinery efficiency and carbon-capture systems will enhance sustainability and operational competitiveness.
- Emerging economies will significantly increase ethanol demand as they reduce dependence on imported fossil fuels.
- Infrastructure upgrades at fuel stations and distribution networks will support the transition toward higher ethanol blends.
- Digital monitoring and traceability systems will improve blending compliance and fuel-quality assurance.
- Strategic partnerships between producers, refiners, and automotive OEMs will shape future market expansion.
- Regional production hubs will strengthen supply security as countries prioritize domestic biofuel value chains.


