| REPORT ATTRIBUTE |
DETAILS |
| Historical Period |
2020-2023 |
| Base Year |
2024 |
| Forecast Period |
2025-2032 |
| Bioleaching Market Size 2024 |
USD 1,832.0 Million |
| Bioleaching Market, CAGR |
3.80% |
| Bioleaching Market Size 2032 |
USD 2,468.9 Million |
Market Overview:
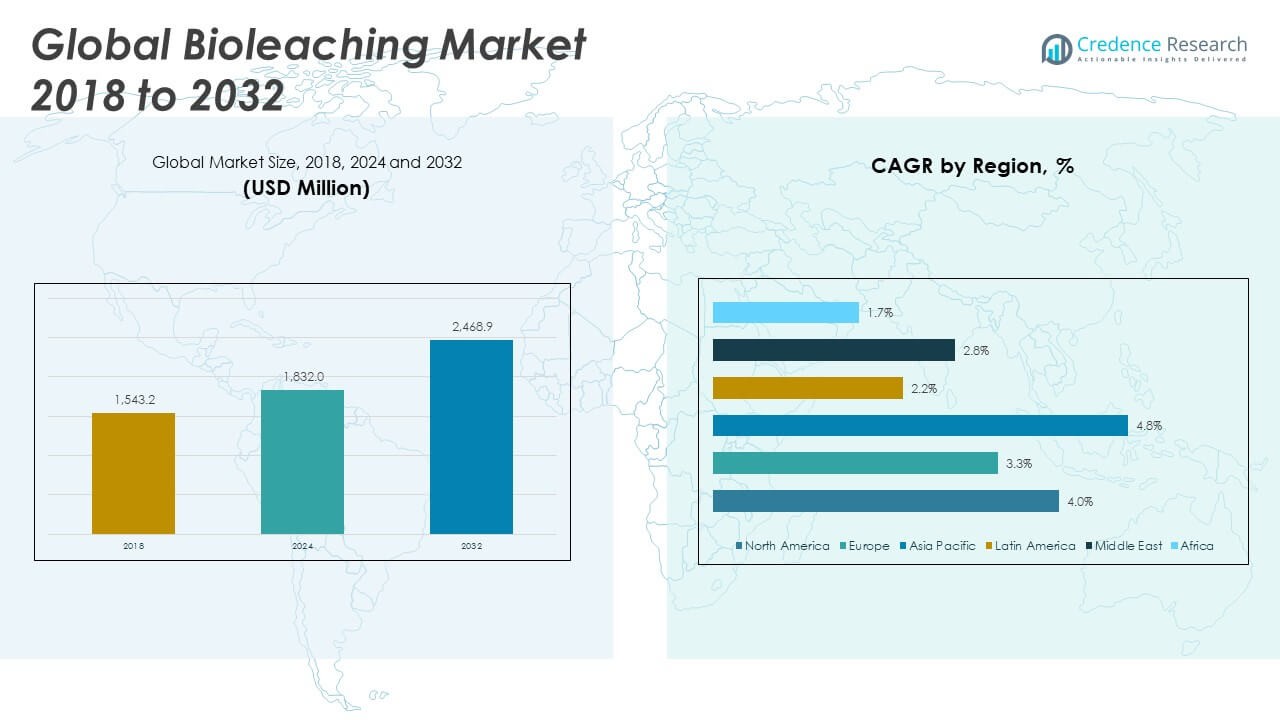
The Bioleaching Market size was valued at USD 1,543.2 million in 2018 to USD 1,832.0 million in 2024 and is anticipated to reach USD 2,468.9 million by 2032, at a CAGR of 3.80% during the forecast period.
Several key factors are propelling the growth of the Bioleaching Market. The mining industry is under pressure to reduce its environmental footprint while improving operational efficiency. Bioleaching provides a low-energy and eco-friendly solution, especially for copper, gold, and nickel extraction. It allows for the recovery of valuable metals from low-grade ores that are often uneconomical using conventional techniques. Regulatory bodies are encouraging the use of sustainable technologies, and bioleaching aligns well with these objectives. The growing volume of electronic waste has also created demand for efficient metal recovery methods in recycling industries. Furthermore, advancements in microbial engineering, genomics, and bioinformatics are enhancing the selectivity, speed, and yield of the bioleaching process.
Regionally, the Bioleaching Market displays diverse patterns of adoption and development. North America holds a significant share due to strong regulatory frameworks and investments in environmentally responsible mining operations, particularly in the United States and Canada. Europe is also a major market, driven by strict emission regulations and a high degree of technological innovation. Countries like Germany, France, and the UK are adopting bioleaching techniques to meet climate goals and reduce reliance on imported raw materials. The Asia Pacific region is projected to witness the fastest growth, supported by large-scale mining activities in China, India, and Australia, coupled with rising awareness about sustainable practices. Latin America, with abundant mineral reserves in countries such as Chile, Brazil, and Peru, is increasingly implementing bioleaching in copper and gold extraction. Meanwhile, the Middle East and Africa regions are gradually integrating bioleaching solutions, primarily in mineral-rich areas such as South Africa and the Democratic Republic of the Congo.
Access crucial information at unmatched prices!
Request your sample report today & start making informed decisions powered by Credence Research Inc.!
Download Sample
Market Insights:
- The Bioleaching Market was valued at USD 1,832.0 million in 2024 and is projected to reach USD 2,468.9 million by 2032, growing at a CAGR of 3.80%, driven by rising demand for sustainable extraction methods.
- Bioleaching provides an eco-friendly solution for extracting metals like copper, gold, and nickel from low-grade ores, aligning with global environmental regulations and circular economy goals.
- Growing electronic waste volumes are pushing recycling industries to adopt bioleaching for metal recovery from end-of-life products, reducing reliance on hazardous chemical leaching methods.
- Technological advancements in microbial engineering, genomics, and bioreactor systems are increasing process speed, selectivity, and yield, improving the commercial viability of bioleaching.
- Low-grade and complex ore bodies are becoming economically feasible through bioleaching, enabling miners to extend asset life and maximize resource recovery.
- Adoption remains limited in large-scale mining due to slow kinetics, lack of standardization, and sensitivity to environmental variables, creating barriers to scale.
- Regionally, Asia Pacific leads market growth, North America holds a significant share, and Europe emphasizes innovation, while Latin America, the Middle East, and Africa show gradual adoption driven by mineral abundance.
Market Drivers:
Rising Demand for Sustainable and Eco-Friendly Mining Practices Fuels Market Growth
The global push toward sustainable mining is a major driver of the Bioleaching Market. Governments and regulatory bodies are tightening environmental laws to reduce carbon emissions, water usage, and toxic waste from traditional metal extraction processes. Bioleaching offers a low-impact alternative by utilizing microorganisms to extract metals, minimizing environmental disruption. It eliminates the need for smelting, reduces energy consumption, and avoids harmful by-products like sulfur dioxide. This method supports circular economy goals by recovering valuable metals from waste streams and low-grade ores. It meets industry demand for cleaner technologies, positioning bioleaching as a preferred solution for responsible mining operations.
Growing Adoption Across Electronic Waste Recycling and Secondary Metal Recovery
The surge in electronic waste generation has expanded the scope of bioleaching beyond conventional mining. Recycling industries are exploring bioleaching to recover precious and rare metals from end-of-life electronics such as mobile phones, computers, and batteries. Traditional methods involve harsh chemicals and high temperatures, posing safety and environmental risks. Bioleaching, in contrast, offers a cost-effective and safer solution for metal recovery from complex waste materials. It supports resource efficiency by enabling secondary metal extraction without significant infrastructure investments. The Bioleaching Market benefits from this shift, as recycling firms seek scalable and sustainable solutions for urban mining challenges.
- For instance, Mint Innovation’s Sydney bio-refinery processes over 3,000 tonnes of e-waste annually using naturally sourced microbes, while N2S in the UK, in partnership with Coventry University, has demonstrated the recovery of high-purity copper foil from discarded computer circuit boards using non-toxic bacteria.
Technological Innovations in Microbial Engineering and Genomics Drive Process Efficiency
Advances in microbial genetics and synthetic biology are improving the effectiveness and speed of the bioleaching process. Researchers have developed strains of bacteria and fungi that can withstand harsh leaching environments and extract metals with higher selectivity. Genomic analysis tools allow scientists to optimize microbial metabolism, enhancing metal solubilization and process yield. Innovations in bioreactor design and process automation also contribute to the efficiency and commercial viability of bioleaching. These developments reduce processing time, lower operational costs, and expand application to more metal types and ore grades. The market benefits from continued research investments and cross-sector collaboration in biotechnology.
- For example, BioSigma S.A., a joint venture between Codelco and Nippon Mining, has secured 82 patents covering novel iron- and sulfur-oxidizing microbial isolates, cultivation methods, and process monitoring tools, resulting in up to 30% higher copper recovery at Chile’s Radomiro Tomic mine versus conventional leaching.
Increased Economic Viability of Low-Grade Ores and Complex Deposits
The depletion of high-grade ore reserves has forced the mining industry to explore more challenging and lower-grade resources. Traditional methods often struggle to process these economically, limiting access to valuable metals. Bioleaching offers a solution by efficiently extracting metals from low-grade ores and refractory minerals. It enables operators to extend the lifespan of existing mines and improve returns on previously discarded resources. The Bioleaching Market supports this shift by offering scalable, adaptable, and low-cost extraction options. It helps miners maintain profitability in a resource-constrained and price-sensitive global market.
Market Trends:
Expansion of Bioleaching Applications into Urban Mining and Waste Management
Urban mining has emerged as a key trend shaping the future of the Bioleaching Market. The rapid growth in consumer electronics and batteries has generated large volumes of e-waste, which contain recoverable quantities of gold, copper, lithium, and rare earth elements. Companies are turning to bioleaching as a cost-effective and environmentally safe method for extracting these metals from discarded devices. It allows for metal recovery without toxic chemicals or energy-intensive processes. Bioleaching technologies are now being tailored for urban waste streams, including printed circuit boards and spent batteries. This trend is helping address resource scarcity while reducing the environmental footprint of electronic waste.
- For instance, BRAIN Biotech AG’s BioXtractor, a container-based mobile pilot plant developed for biological extraction of metals from e-waste. In collaboration with PX Group, this technology has been successfully scaled to the cubic-meter level, enabling efficient recovery of gold from printed circuit boards as part of the PX Urban Mining Initiative.
Integration of Bioleaching with Circular Economy and Sustainable Mining Models
The global shift toward circular economy frameworks has increased interest in sustainable extraction methods, positioning bioleaching as a critical enabler. Mining companies are incorporating bioleaching to recover metals from tailings, slags, and low-grade ores previously considered uneconomical. This aligns with goals to maximize resource use and reduce mine waste. Bioleaching supports in-situ and heap leaching strategies that minimize land and water disruption. It enhances metal recovery rates while maintaining operational safety. The Bioleaching Market is aligning with these sustainability targets, gaining traction among firms focused on long-term environmental and economic value.
Rising Government Support for Green Technologies in the Mining Sector
Policy initiatives and funding support are boosting adoption of eco-friendly technologies, including bioleaching, across multiple regions. Governments in North America and Europe are offering tax incentives and research grants for companies that implement sustainable mineral processing techniques. Regulatory frameworks now demand strict compliance with emission and waste management standards, prompting companies to adopt microbial leaching alternatives. Public-private partnerships are funding pilot projects and commercialization of advanced bioleaching methods. Environmental agencies are encouraging the transition from conventional practices to biological solutions. The Bioleaching Market is benefiting from this policy environment, which lowers entry barriers and supports innovation.
Growing Research Collaborations Between Biotechnology Firms and Mining Operators
Collaborations between biotech companies, universities, and mining firms are accelerating the development and scaling of bioleaching solutions. These partnerships combine domain expertise in microbiology, mineralogy, and process engineering to create more efficient and commercially viable systems. Research institutions are contributing to genome sequencing and bioinformatics tools that enhance microbial performance. Pilot-scale trials are being conducted at active mine sites to test and refine real-world applications. Startups are also entering the space with novel biocatalysts and modular systems. It is strengthening the Bioleaching Market by bringing in diverse stakeholders committed to responsible resource extraction.
- For example, in Chile, BioSigma S.A. a joint venture between Codelco and Nippon Mining and Metals has developed advanced bioleaching strategies for low-grade copper sulfide ores, leveraging genomics, proteomics, and bioinformatics.
Market Challenges Analysis:
Limited Commercialization and Slow Adoption in Large-Scale Mining Operations
Despite its environmental benefits, bioleaching remains underutilized in large-scale mining due to concerns over scalability, processing time, and consistency. Traditional mining operations often rely on established chemical leaching methods that offer faster metal recovery. The relatively slower kinetics of bioleaching and the complexity of microbial behavior in varying environmental conditions pose operational challenges. Many companies remain hesitant to invest in full-scale bioleaching systems without clear performance benchmarks. The lack of standardized protocols for microbial cultivation and metal recovery further limits its integration into conventional mining workflows. The Bioleaching Market must address these performance and efficiency concerns to expand its role in mainstream mining operations.
High Sensitivity to Environmental Conditions and Technical Expertise Requirement
Bioleaching processes depend heavily on controlled environmental factors such as pH, temperature, oxygen levels, and nutrient supply. Fluctuations in these parameters can disrupt microbial activity and reduce extraction efficiency. Managing these variables requires specialized technical expertise and constant monitoring, which can increase operational complexity and cost. Developing regions may face resource constraints in building the required infrastructure for stable bioleaching systems. The lack of trained personnel with both microbiological and metallurgical knowledge remains a barrier to widespread adoption. It limits the pace at which the Bioleaching Market can expand, especially in regions with minimal access to advanced technologies.
Market Opportunities:
Rising Demand for Rare Earth Elements and Battery Metals Opens New Avenues
The growing demand for rare earth elements and battery metals such as lithium, cobalt, and nickel presents significant opportunities for the Bioleaching Market. These metals are critical for electric vehicles, renewable energy systems, and advanced electronics. Traditional extraction methods for these elements often face environmental and economic limitations. Bioleaching provides a low-impact and scalable method to recover these metals from ores, industrial waste, and electronic scrap. It offers a strategic advantage for countries aiming to secure supply chains while meeting sustainability targets. The market is well-positioned to support this rising global demand through innovative biological processes.
Potential for Waste Valorization and Tailings Reprocessing Supports Long-Term Growth
Large volumes of mine tailings and industrial waste contain residual metals that remain untapped. Bioleaching offers a sustainable solution to recover these resources, turning waste into valuable raw materials. It supports zero-waste mining initiatives and reduces the environmental liability of legacy mine sites. Governments and industry players are showing interest in rehabilitating contaminated lands using bio-based extraction. The Bioleaching Market can expand by offering remediation and resource recovery in one integrated solution. It opens pathways for both environmental restoration and economic value generation from previously discarded materials.
Market Segmentation Analysis:
The Bioleaching Market is segmented by product type, technology, and end user, each playing a critical role in shaping its overall landscape.
By product type, copper bioleaching leads due to its wide industrial application and established extraction processes. Gold bioleaching is expanding steadily with rising demand for sustainable mining practices. Nickel bioleaching holds a niche position, supported by increasing use in battery production. Other metal bioleaching, including zinc and cobalt, shows moderate growth driven by advancements in microbial techniques.
- For instance, Mintekis a global leader in advanced copper bioleaching, particularly heap bioleaching for low-grade copper ores. Their technology is commercially implemented worldwide and specifically targets chalcopyrite, the most abundant but refractory copper sulfide mineral.
By technology, bacterial leaching dominates the market due to its proven efficiency and adaptability across various ores. Fungal leaching, though less prevalent, is gaining interest due to its environmental compatibility and potential in selective metal recovery. Other technologies, including mixed consortia and genetically modified microbes, are under development and reflect ongoing innovation efforts.
By end user, mining companies hold the largest share, driven by the need for cost-effective and environmentally responsible extraction solutions. Recycling industries are steadily adopting bioleaching for electronic waste treatment and metal recovery. Environmental service providers are also entering the space, using bioleaching to remediate contaminated sites and manage industrial waste sustainably. Each segment contributes to the growth and diversification of the Bioleaching Market, supported by evolving regulatory standards and resource scarcity.
- For instance, the BRAIN Biotech–PX Group partnership is a leading example: their BioXtractor V2 pilot plant processes gold-containing e-waste streams at an industrial site, directly producing gold nuggets from urban waste and validating the process for broader e-waste applications.
Segmentation:
By Product Type
- Copper Bioleaching
- Gold Bioleaching
- Nickel Bioleaching
- Other Metal Bioleaching
By Technology
- Bacterial Leaching
- Fungal Leaching
- Other Technologies
By End User
- Mining Companies
- Recycling Industries
- Environmental Services
By Region
- North America
- Europe
- UK
- France
- Germany
- Italy
- Spain
- Russia
- Belgium
- Netherlands
- Austria
- Sweden
- Poland
- Denmark
- Switzerland
- Rest of Europe
- Asia Pacific
- China
- Japan
- South Korea
- India
- Australia
- Thailand
- Indonesia
- Vietnam
- Malaysia
- Philippines
- Taiwan
- Rest of Asia Pacific
- Latin America
- Brazil
- Argentina
- Peru
- Chile
- Colombia
- Rest of Latin America
- Middle East
- UAE
- KSA
- Israel
- Turkey
- Iran
- Rest of Middle East
- Africa
- Egypt
- Nigeria
- Algeria
- Morocco
- Rest of Africa
Regional Analysis:
The North America Bioleaching Market size was valued at USD 459.9 million in 2018 to USD 502.0 million in 2024 and is anticipated to reach USD 632.0 million by 2032, at a CAGR of 4.0% during the forecast period. North America holds a significant share in the Bioleaching Market, supported by advanced mining infrastructure and strong regulatory frameworks. The United States leads regional adoption due to its focus on sustainable metal extraction and e-waste recycling initiatives. Canada also contributes notably through investment in green technologies and bio-mining research. It benefits from government-backed innovation programs that promote microbial-based extraction technologies. The region’s mining companies are integrating bioleaching into operations to meet environmental standards and reduce reliance on conventional methods. North America accounted for 23.4% of the global bioleaching market share in 2024.
The Europe Bioleaching Market size was valued at USD 396.6 million in 2018 to USD 441.5 million in 2024 and is anticipated to reach USD 555.5 million by 2032, at a CAGR of 3.3% during the forecast period. Europe plays a vital role in the Bioleaching Market, driven by strict environmental policies and circular economy goals. Countries like Germany, France, and the UK are adopting bioleaching to enhance metal recovery from industrial waste and e-waste. It supports regional goals for reducing carbon emissions and improving resource efficiency. Technological innovation and academic-industry collaboration further strengthen Europe’s position. The presence of specialized biotech firms and sustainable mining initiatives expands the application of bioleaching. Europe held a 20.6% share of the global market in 2024.
The Asia Pacific Bioleaching Market size was valued at USD 425.9 million in 2018 to USD 588.1 million in 2024 and is anticipated to reach USD 908.6 million by 2032, at a CAGR of 4.8% during the forecast period. Asia Pacific dominates the Bioleaching Market with the largest share, accounting for 27.4% in 2024. The region benefits from high mining activity in China, India, and Australia, where demand for low-cost and sustainable extraction solutions is strong. It also faces growing electronic waste challenges, creating opportunities for bioleaching in urban mining. Government support for cleaner technologies and increased infrastructure development further support market growth. The region is attracting global players through joint ventures and pilot programs. Ongoing research in microbial biotechnology adds to the region’s innovation capacity.
The Latin America Bioleaching Market size was valued at USD 81.8 million in 2018 to USD 95.3 million in 2024 and is anticipated to reach USD 140.7 million by 2032, at a CAGR of 2.2% during the forecast period. Latin America is steadily expanding its presence in the Bioleaching Market, holding a 4.4% share in 2024. Countries such as Chile, Brazil, and Peru possess abundant mineral reserves and face mounting pressure to adopt cleaner mining practices. Bioleaching offers a practical solution for copper and gold extraction in regions where ore grades are declining. Government reforms and partnerships with foreign mining firms are encouraging investment in eco-friendly technologies. It aligns with the region’s goals for resource efficiency and environmental protection. The market is gaining traction, particularly in copper-rich areas.
The Middle East Bioleaching Market size was valued at USD 112.7 million in 2018 to USD 128.2 million in 2024 and is anticipated to reach USD 167.9 million by 2032, at a CAGR of 2.8% during the forecast period. The Middle East is an emerging participant in the Bioleaching Market, holding a 6.0% share in 2024. Countries such as Saudi Arabia and the UAE are exploring bioleaching to support mineral diversification and sustainable development goals. It is gaining relevance in regions where mining is expanding into lower-grade deposits. Limited water availability in arid areas also increases interest in water-efficient technologies like bioleaching. Research institutions and industrial zones are investing in pilot projects to assess scalability. The market’s potential is growing with national visions focused on green industrial growth.
Africa’s share in the Bioleaching Market stood at 3.6% in 2024, reflecting slow adoption despite its vast mineral resources. The region faces challenges such as infrastructure gaps, lack of technical expertise, and limited access to capital for implementing bioleaching technologies. However, countries like South Africa and Zambia are exploring microbial extraction for low-grade ore processing. Environmental concerns around traditional mining practices are encouraging interest in alternatives. International partnerships are supporting knowledge transfer and pilot implementation. It holds long-term potential, especially in gold and copper mining zones.
Key Player Analysis:
- MetalloBio Ltd.
- Biomine AG
- BASF SE
- Glencore plc
- Rio Tinto Group
- BHP Group
- Anglo American plc
- Freeport-McMoRan Inc.
- Outotec Oyj (Metso Outotec)
- Barrick Gold Corporation
- Teck Resources Limited
- Vale S.A.
- EcoMetales Limited
- Fortescue Metals Group
Competitive Analysis:
The Bioleaching Market features a mix of biotechnology firms, mining giants, and specialized service providers competing on innovation, efficiency, and sustainability. Key players such as MetalloBio Ltd., Biomine AG, BASF SE, Glencore plc, and Rio Tinto Group are actively investing in microbial technology and process optimization. It reflects a trend toward strategic collaborations between biotech companies and mining operators to enhance metal recovery from low-grade ores and waste. Companies like BHP Group, Anglo American plc, and Freeport-McMoRan Inc. are exploring bioleaching to align with environmental regulations and cost reduction goals. Outotec Oyj (Metso Outotec) and EcoMetales Limited provide technical expertise and engineering solutions for bioleaching systems. Competition centers on the ability to scale solutions, improve process efficiency, and meet sustainability standards. The Bioleaching Market is evolving rapidly, with firms focusing on patented microbial strains, automation technologies, and integrated systems to gain a competitive edge in both primary mining and secondary resource recovery.
Recent Developments:
- In April 2025, BASF’s Personal Care business announced a strengthened strategic collaboration with Azelis, appointing Azelis as its sole distributor in the United States effective July 1, 2025. This partnership aims to enhance BASF’s market reach and innovation in sustainable personal care ingredients, though it is not directly related to bioleaching but highlights BASF’s ongoing commitment to sustainability and innovation in its product lines.
- In April 2025, Glencore made headlines with its acquisition proposal for Li-Cycle, a Canadian battery recycling company. This move is part of Glencore’s broader strategy to vertically integrate into battery metals recycling, which is closely aligned with the company’s focus on metals critical to the clean energy transition. The acquisition, still in the proposal stage, could significantly enhance Glencore’s position in the recycling and recovery of key metals such as cobalt, nickel, and lithium, which are also relevant to bioleaching technologies.

Market Concentration & Characteristics:
The Bioleaching Market is moderately concentrated, with a few major players holding a significant share while several smaller firms and research-driven startups contribute to niche innovations. It is characterized by high entry barriers due to the need for specialized microbiological expertise, long development cycles, and regulatory compliance. The market relies heavily on R&D and pilot-scale validation before commercial deployment, which limits the pace of new entrants. Key characteristics include a strong emphasis on sustainability, the use of patented microbial strains, and the integration of bioinformatics and process automation. It is gradually transitioning from lab-scale applications to scalable industrial solutions, driven by rising demand for low-cost and eco-friendly metal extraction methods. Strategic partnerships between mining companies and biotech firms shape market dynamics, with innovation and operational efficiency serving as primary competitive factors.
Shape Your Report to Specific Countries or Regions & Enjoy 30% Off!
Report Coverage:
The research report offers an in-depth analysis based on product type, technology, and end user. It details leading market players, providing an overview of their business, product offerings, investments, revenue streams, and key applications. Additionally, the report includes insights into the competitive environment, SWOT analysis, current market trends, as well as the primary drivers and constraints. Furthermore, it discusses various factors that have driven market expansion in recent years. The report also explores market dynamics, regulatory scenarios, and technological advancements that are shaping the industry. It assesses the impact of external factors and global economic changes on market growth. Lastly, it provides strategic recommendations for new entrants and established companies to navigate the complexities of the market.
Future Outlook:
- Increasing demand for sustainable metal extraction will drive wider adoption across mining and recycling sectors.
- Ongoing innovations in microbial engineering are expected to improve efficiency and broaden the range of applicable metals.
- Expansion of urban mining will create new opportunities for bioleaching in electronic waste recovery.
- Government support for green technologies will encourage infrastructure investment and pilot project deployment.
- Integration of automation and real-time monitoring systems will enhance process control and scalability.
- Strategic collaborations between biotech firms and mining companies will accelerate commercialization.
- Developing regions will gradually adopt bioleaching as a cost-effective alternative to conventional methods.
- Rising focus on rare earth and battery metals will position bioleaching as a key tool in critical mineral recovery.
- Advances in bioreactor design will enable more consistent and large-scale metal extraction.
- Growing emphasis on circular economy models will support long-term market expansion and regulatory alignment.


