CHAPTER NO. 1 : GENESIS OF THE MARKET
1.1 Market Prelude – Introduction & Scope
1.2 The Big Picture – Objectives & Vision
1.3 Strategic Edge – Unique Value Proposition
1.4 Stakeholder Compass – Key Beneficiaries
CHAPTER NO. 2 : EXECUTIVE LENS
2.1 Pulse of the Industry – Market Snapshot
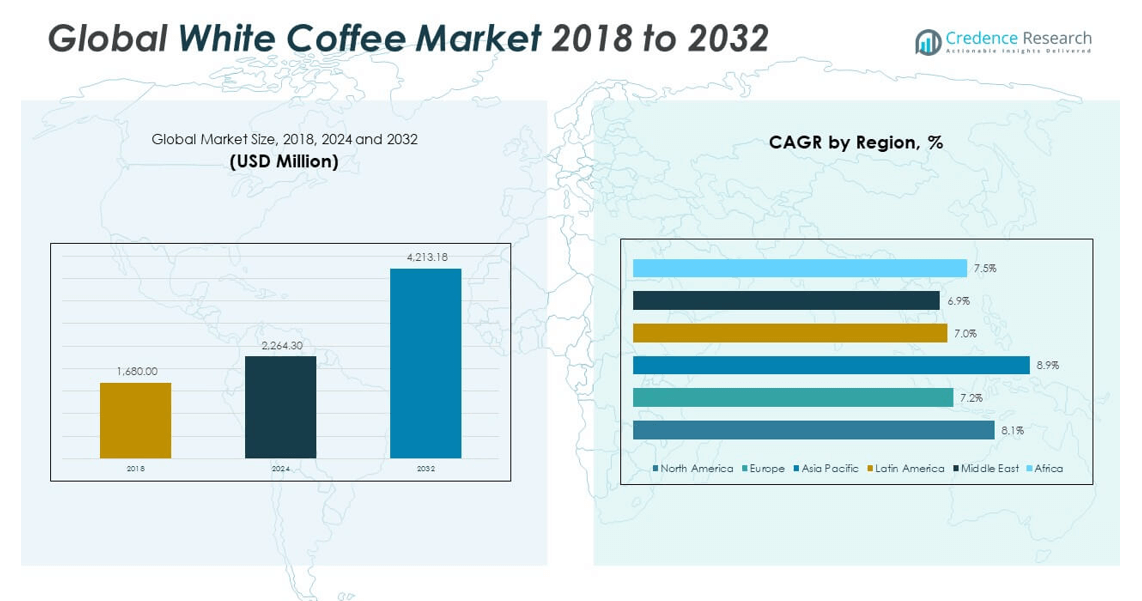
2.2 Growth Arc – Revenue Projections (USD Million)
2.3. Premium Insights – Based on Primary Interviews
CHAPTER NO. 3 : WHITE COFFEE MARKET FORCES & INDUSTRY PULSE
3.1 Foundations of Change – Market Overview
3.2 Catalysts of Expansion – Key Market Drivers
3.2.1 Momentum Boosters – Growth Triggers
3.2.2 Innovation Fuel – Disruptive Technologies
3.3 Headwinds & Crosswinds – Market Restraints
3.3.1 Regulatory Tides – Compliance Challenges
3.3.2 Economic Frictions – Inflationary Pressures
3.4 Untapped Horizons – Growth Potential & Opportunities
3.5 Strategic Navigation – Industry Frameworks
3.5.1 Market Equilibrium – Porter’s Five Forces
3.5.2 Ecosystem Dynamics – Value Chain Analysis
3.5.3 Macro Forces – PESTEL Breakdown
3.6 Price Trend Analysis
3.6.1 Regional Price Trend
3.6.2 Price Trend by product
CHAPTER NO. 4 : KEY INVESTMENT EPICENTER
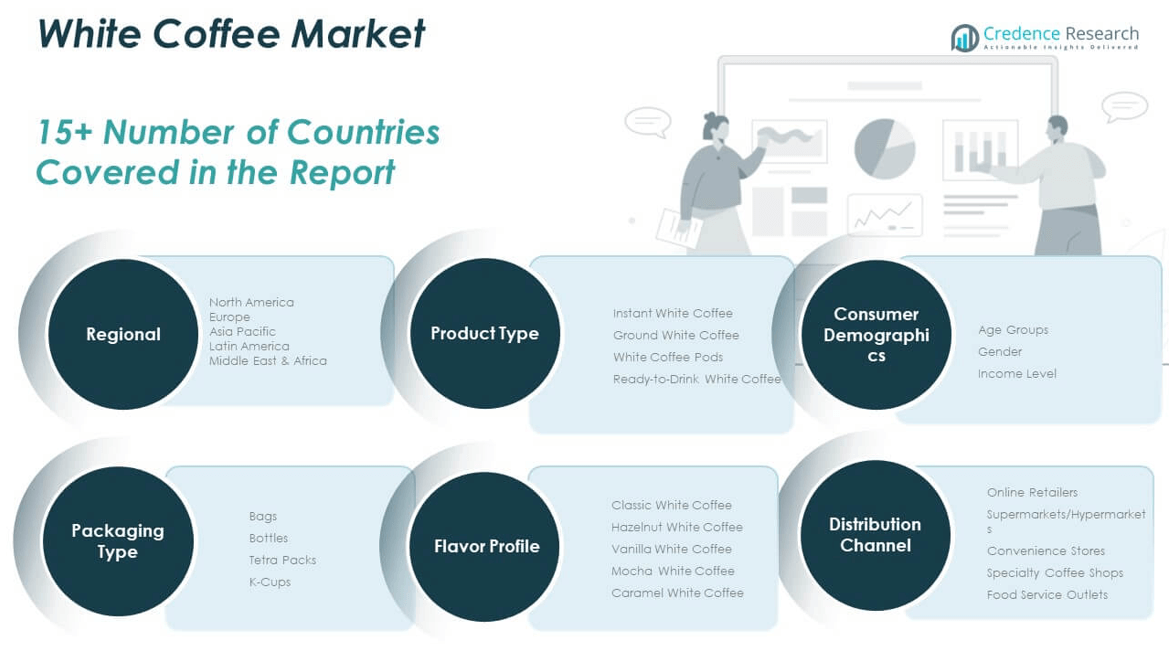
4.1 Regional Goldmines – High-Growth Geographies
4.2 Product Type Frontiers – Lucrative Product Type Categories
4.3 Consumer Demographics Sweet Spots – Emerging Demand Segments
CHAPTER NO. 5: REVENUE TRAJECTORY & WEALTH MAPPING
5.1 Momentum Metrics – Forecast & Growth Curves
5.2 Regional Revenue Footprint – Market Share Insights
5.3 Segmental Wealth Flow – Product Type & Consumer Demographics Revenue
CHAPTER NO. 6 : TRADE & COMMERCE ANALYSIS
6.1. Import Analysis by Region
6.1.1. Global White Coffee Market Import Revenue By Region
6.2. Export Analysis by Region
6.2.1. Global White Coffee Market Export Revenue By Region
CHAPTER NO. 7 : COMPETITION ANALYSIS
7.1. Company Market Share Analysis
7.1.1. Global White Coffee Market: Company Market Share
7.2. Global White Coffee Market Company Revenue Market Share
7.3. Strategic Developments
7.3.1. Acquisitions & Mergers
7.3.2. New Product Type Launch
7.3.3. Regional Expansion
7.4. Competitive Dashboard
7.5. Company Assessment Metrics, 2024
CHAPTER NO. 8 : WHITE COFFEE MARKET – BY PRODUCT TYPE SEGMENT ANALYSIS
8.1. White Coffee Market Overview by Product Type Segment
8.1.1. White Coffee Market Revenue Share By Product Type
8.2. Instant White Coffee
8.3. Ground White Coffee
8.4. White Coffee Pods
8.5. Ready-to-Drink White Coffee
CHAPTER NO. 9 : WHITE COFFEE MARKET – BY CONSUMER DEMOGRAPHICS SEGMENT ANALYSIS
9.1. White Coffee Market Overview by Consumer Demographics Segment
9.1.1. White Coffee Market Revenue Share By Consumer Demographics
9.2. Age Groups
9.3. Gender
9.4. Income Level
CHAPTER NO. 10 : WHITE COFFEE MARKET – BY PACKAGING TYPE SEGMENT ANALYSIS
10.1. White Coffee Market Overview by Packaging Type Segment
10.1.1. White Coffee Market Revenue Share By Packaging Type
10.2. Bags
10.3. Bottles
10.4. Tetra Packs
10.5. K-Cups
CHAPTER NO. 11 : WHITE COFFEE MARKET – BY FLAVOR PROFILE SEGMENT ANALYSIS
11.1. White Coffee Market Overview by Flavor Profile Segment
11.1.1. White Coffee Market Revenue Share By Flavor Profile
11.2. Classic White Coffee
11.3. Hazelnut White Coffee
11.4. Vanilla White Coffee
11.5. Mocha White Coffee
11.6. Caramel White Coffee
CHAPTER NO. 12 : WHITE COFFEE MARKET – BY DISTRIBUTION CHANNEL SEGMENT ANALYSIS
12.1. White Coffee Market Overview by Distribution Channel Segment
12.1.1. White Coffee Market Revenue Share By Distribution Channel
12.2. Online Retailers
12.3. Supermarkets/Hypermarkets
12.4. Convenience Stores
12.5. Specialty Coffee Shops
12..6. Food Service Outlets
CHAPTER NO. 13 : WHITE COFFEE MARKET – REGIONAL ANALYSIS
13.1. White Coffee Market Overview by Region Segment
13.1.1. Global White Coffee Market Revenue Share By Region
13.1.2. Regions
13.1.3. Global White Coffee Market Revenue By Region
13.1.4. Product Type
13.1.5. Global White Coffee Market Revenue By Product Type
13.1.6. Consumer Demographics
13.1.7. Global White Coffee Market Revenue By Consumer Demographics
13.1.8. Packaging Type
13.1.9. Global White Coffee Market Revenue By Packaging Type
13.1.10. Flavor Profile
13.1.12. Global White Coffee Market Revenue By Flavor Profile
13.1.13. Distribution Channel
13.1.14. Global White Coffee Market Revenue By Distribution Channel
CHAPTER NO. 14 : NORTH AMERICA WHITE COFFEE MARKET – COUNTRY ANALYSIS
14.1. North America White Coffee Market Overview by Country Segment
14.1.1. North America White Coffee Market Revenue Share By Region
14.2. North America
14.2.1.North America White Coffee Market Revenue By Country
14.2.2. Product Type
14.2.3. North America White Coffee Market Revenue By Product Type
14.2.4. Consumer Demographics
14.2.5. North America White Coffee Market Revenue By Consumer Demographics
14.2.6. Packaging Type
14.2.7. North America White Coffee Market Revenue By Packaging Type
14.2.8.Flavor Profile
14.2.9. North America White Coffee Market Revenue By Flavor Profile
14.2.10. Distribution Channel
14.2.11. North America White Coffee Market Revenue By Distribution Channel
14.3. U.S.
14.4. Canada
14.5. Mexico
CHAPTER NO. 15 : EUROPE WHITE COFFEE MARKET – COUNTRY ANALYSIS
15.1. Europe White Coffee Market Overview by Country Segment
15.1.1. Europe White Coffee Market Revenue Share By Region
15.2. Europe
15.2.1.Europe White Coffee Market Revenue By Country
15.2.2. Product Type
15.2.3. Europe White Coffee Market Revenue By Product Type
15.2.4. Consumer Demographics
15.2.5. Europe White Coffee Market Revenue By Consumer Demographics
15.2.6. Packaging Type
15.2.7. Europe White Coffee Market Revenue By Packaging Type
15.2.8.Flavor Profile
15.2.9. Europe White Coffee Market Revenue By Flavor Profile
15.2.10. Distribution Channel
15.2.11. Europe White Coffee Market Revenue By Distribution Channel
15.3. UK
15.4. France
15.5. Germany
15.6. Italy
15.7. Spain
15.8. Russia
15.9. Rest of Europe
CHAPTER NO. 16 : ASIA PACIFIC WHITE COFFEE MARKET – COUNTRY ANALYSIS
16.1. Asia Pacific White Coffee Market Overview by Country Segment
16.1.1. Asia Pacific White Coffee Market Revenue Share By Region
16.2. Asia Pacific
16.2.1. Asia Pacific White Coffee Market Revenue By Country
16.2.2. Product Type
16.2.3. Asia Pacific White Coffee Market Revenue By Product Type
16.2.4. Consumer Demographics
16.2.5. Asia Pacific White Coffee Market Revenue By Consumer Demographics
16.2.6. Packaging Type
16.2.7. Asia Pacific White Coffee Market Revenue By Packaging Type
16.2.8.Flavor Profile
16.2.9. Asia Pacific White Coffee Market Revenue By Flavor Profile
16.2.10. Distribution Channel
16.2.11. Asia Pacific White Coffee Market Revenue By Distribution Channel
16.3. China
16.4. Japan
16.5. South Korea
16.6. India
16.7. Australia
16.8. Southeast Asia
16.9. Rest of Asia Pacific
CHAPTER NO. 17 : LATIN AMERICA WHITE COFFEE MARKET – COUNTRY ANALYSIS
17.1. Latin America White Coffee Market Overview by Country Segment
17.1.1. Latin America White Coffee Market Revenue Share By Region
17.2. Latin America
17.2.1. Latin America White Coffee Market Revenue By Country
17.2.2. Product Type
17.2.3. Latin America White Coffee Market Revenue By Product Type
17.2.4. Consumer Demographics
17.2.5. Latin America White Coffee Market Revenue By Consumer Demographics
17.2.6. Packaging Type
17.2.7.Latin America White Coffee Market Revenue By Packaging Type
17.2.8.Flavor Profile
17.2.9. Latin America White Coffee Market Revenue By Flavor Profile
17.2.10. Distribution Channel
17.2.11. Latin America White Coffee Market Revenue By Distribution Channel
17.3. Brazil
17.4. Argentina
17.5. Rest of Latin America
CHAPTER NO. 18 : MIDDLE EAST WHITE COFFEE MARKET – COUNTRY ANALYSIS
18.1. Middle East White Coffee Market Overview by Country Segment
18.1.1. Middle East White Coffee Market Revenue Share By Region
18.2. Middle East
18.2.1. Middle East White Coffee Market Revenue By Country
18.2.2. Product Type
18.2.3. Middle East White Coffee Market Revenue By Product Type
18.2.4. Consumer Demographics
18.2.5. Middle East White Coffee Market Revenue By Consumer Demographics
18.2.6. Packaging Type
18.2.7. Middle East White Coffee Market Revenue By Packaging Type
18.2.8. Flavor Profile
18.2.9. Middle East White Coffee Market Revenue By Flavor Profile
18.2.10. Distribution Channel
18.2.11. Middle East White Coffee Market Revenue By Distribution Channel
18.3. GCC Countries
18.4. Israel
18.5. Turkey
18.6. Rest of Middle East
CHAPTER NO. 19 : AFRICA WHITE COFFEE MARKET – COUNTRY ANALYSIS
19.1. Africa White Coffee Market Overview by Country Segment
19.1.1. Africa White Coffee Market Revenue Share By Region
19.2. Africa
19.2.1. Africa White Coffee Market Revenue By Country
19.2.2. Product Type
19.2.3. Africa White Coffee Market Revenue By Product Type
19.2.4. Consumer Demographics
19.2.5. Africa White Coffee Market Revenue By Consumer Demographics
19.2.6. Packaging Type
19.2.7. Africa White Coffee Market Revenue By Packaging Type
19.2.8.Flavor Profile
19.2.9. Africa White Coffee Market Revenue By Flavor Profile
19.2.10. Distribution Channel
19.2.11. Africa White Coffee Market Revenue By Distribution Channel
19.3. South Africa
19.4. Egypt
19.5. Rest of Africa
CHAPTER NO. 20 : COMPANY PROFILES
20.1. Nestlé S.A.
20.1.1. Company Overview
20.1.2. Product Type Portfolio
20.1.3. Financial Overview
20.1.4.Recent Developments
20.1.5. Growth Strategy
20.1.6. SWOT Analysis
20.2. Jacobs Douwe Egberts
20.3 PT Mayora Indah Tbk
20.4. Alicafe Arabia
20.5. Aik Cheong Coffee Roaster Sdn.Bhd.
20.6. Orgabio Manufacturing Sdn Bhd
20.6. Home’s Café
20.7. Poverty Bay Coffee Company
20.8. Bargreen Coffee Company