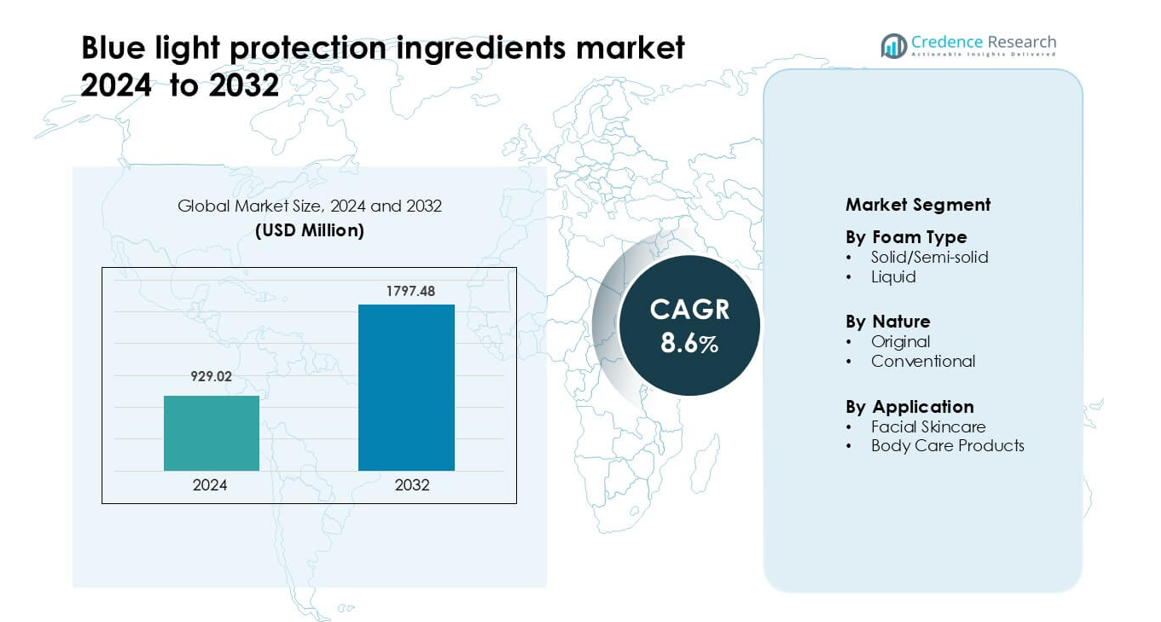
Home » Consumer Goods » Blue Light Protection Ingredients Market

Blue Light Protection Ingredients Market By Form Type (Solid, Semi-Solid, Liquid) By Nature (Organic, Conventional)-Growth, Future Prospects & Competitive Analysis, 2016 – 2030

Price: $4999

Published: | Report ID: 19573 | Report Format : PDF

Key Highlights of the Report

The global blue light protection ingredients market is segmented by form type, nature, source, application, and region. The solid form holds the largest market share, while the liquid form type is expected to grow substantially. Organic ingredients dominate the market, driven by consumer preference for natural and organic skincare products. Coffee berry is the leading source segment, while the noni fruit segment shows promising growth potential. Facial skin care products hold the largest share in the application segment. North America is the leading market, followed by Europe, with the Asia-Pacific region showing rapid growth.

The blue light protection ingredients market is driven by the increasing prevalence of digital devices and growing consumer awareness of the harmful effects of blue light exposure on skin health. The rising demand for skincare and cosmetic products offering comprehensive protection against blue light further propels market growth. However, the market faces challenges such as the need for standardized regulations and limited scientific evidence regarding the long-term effects of blue light exposure, which restrain market expansion.

Nonetheless, there are promising opportunities in the global blue light protection ingredients market, including technological advancements in ingredient formulations, the development of natural and organic blue light protection solutions, and expanding the market in emerging regions.

Market Overview

The global blue light protection ingredients market has witnessed rapid growth in recent years and is estimated to grow at a CAGR of 8.9% between 2023 and 2030. The market was valued at USD 0.8 billion in 2022 and is anticipated to reach USD 1.45 billion in 2030.

Design Element 2

Access crucial information at unmatched prices!

Request your free sample report today & start making informed decisions powered by Credence Research!

Download Free Sample
CTA Design Element 3

What Are The Main Drivers Of The Global Blue Light Protection Ingredients Market?

The key drivers of the global blue light protection ingredients market include the increasing prevalence of digital devices and prolonged screen time, growing awareness of the harmful effects of blue light exposure on skin and eyes, and the rising demand for skincare and cosmetic products that protect against blue light. Additionally, the expanding consumer awareness of the importance of maintaining skin health and incorporating blue light protection ingredients by key players in their product formulations contribute to market growth.

What Are The Major Challenges The Global Blue Light Protection Ingredients Market Faces?

The major challenges faced by the global blue light protection ingredients market include the need for extensive R&D to identify and develop effective ingredients, the complexity of regulatory compliance due to varying standards across regions, and competing technologies and alternative solutions for blue light protection. Besides, educating consumers about the importance of blue light protection and overcoming skepticism about the efficacy of such ingredients pose additional challenges to market growth.

What Are The Growth Opportunities In The Global Blue Light Protection Ingredients Market?

The global blue light protection ingredients market presents growth opportunities driven by increasing consumer awareness of the harmful effects of blue light exposure, rising demand for skincare and cosmetic products with blue light protection benefits, and advancements in ingredient technologies. The growing adoption of digital devices, particularly in emerging markets, offers untapped potential, while collaborations between skincare brands and technology companies can lead to innovative product offerings. Moreover, developing specialized blue light protection ingredients and formulations tailored to specific consumer needs further expands the market’s growth prospects.

Blue Light Protection Ingredients Market

Executive Summary

Overview of the Global Blue Light Protection Ingredients Market

The global blue light protection ingredients market is experiencing substantial growth owing to the increasing awareness of the harmful effects of blue light exposure from digital devices. Blue light protection ingredients are designed to protect the eyes and skin from the damaging effects of blue light, such as premature aging, hyperpigmentation, and digital eye strain. These ingredients are incorporated into skincare and cosmetic products to protect consumers against blue light while addressing their skincare needs.

Market Definition

The market for blue light protection ingredients refers to the industry segment encompassing developing, producing, and distributing ingredients specifically designed to protect the skin and eyes from blue light exposure. These ingredients are incorporated into various personal care products, including creams, lotions, serums, and eye care products, to protect consumers effectively against the harmful effects of blue light emitted by digital devices. Blue light protection ingredients include antioxidants, carotenoids, peptides, botanical extracts, and other specialized compounds that help neutralize and block blue light.

Market Insights

  • The global demand for blue light protection ingredients was valued at USD 0.8 Billion in 2022 and is expected to reach USD 1.45 Billion in 2030, growing at a CAGR of 8.9% between 2023 and 2030.
  • Solid form type holds the majority market share of over 52% in 2022, while liquid form is expected to exhibit the fastest growth rate.
  • Organic ingredients dominate the market, capturing a significant share of over 58% in 2022, and are anticipated to maintain a higher CAGR.
  • In 2022, coffee berry was the leading source segment, accounting for 34% of the global market.
  • Facial skin care products held the largest share of over 38% in the application segment of the global market in 2022.
  • North America is the leading market, capturing over 44% of the market share in 2022, while the Asia-Pacific region shows substantial growth potential.
  • Key ingredients, such as antioxidants, carotenoids, peptides, and botanical extracts, play a vital role in blue light protection formulations, offering a diverse range of options for product development.
  • Integrating blue light protection ingredients in other consumer products, such as eyewear and screen protectors, presents additional market expansion opportunities.

Segmentation by Form Type

  • The solid segment held the largest market share of over 52% in 2022, driven by its stability and ease of formulation.
  • The liquid segment is witnessing rapid growth and is expected to gain significant market traction in the coming years due to its versatility and compatibility with various product formulations.

Segmentation by Nature

  • The organic segment dominated the market in 2022, capturing over 58% of the revenue, fueled by the emerging consumer preference for natural and organic skincare products.
  • The conventional segment is projected to experience high growth, driven by its cost-effectiveness and widespread availability.

Segmentation by Source

  • The noni fruit segment is projected to achieve the highest CAGR in the forecast period, attributed to its rich antioxidant content and potential skin benefits.
  • In 2022, the coffee berry segment held the largest market share, accounting for over 34% of the global revenue, owing to its proven efficacy in blue light protection formulations.

Segmentation by Application

  • The facial skin care products segment dominated the market in 2022, contributing over 38% of the revenue, as consumers prioritize facial skincare and protection against blue light exposure.
  • The body care products segment is expected to grow substantially, fueled by the increasing demand for comprehensive body protection from blue light exposure.

Segmentation by Region

  • North America held the largest market share in 2022, capturing 44% of the total revenue, driven by the high consumer awareness and adoption of blue light protection ingredients in skincare routines.
  • Europe is a significant market for blue light protection ingredients, contributing significantly to the overall market share, driven by established skincare and cosmetics industry players.
  • The Asia-Pacific region is witnessing rapid adoption of blue light protection ingredients, owing to the growing consumer base, increasing disposable income, and rising awareness of blue light’s potential effects on skin health.
  • The rest of the world, including the Middle East, Latin America, and Africa, is swiftly adopting blue light protection ingredient solutions, driven by increasing urbanization, changing lifestyles, and growing demand for skincare products.

The global blue light protection ingredients market is driven by increasing digital device usage and growing consumer awareness of the harmful effects of blue light exposure. The demand for skincare and cosmetic products that offer blue light protection further propelled the market growth. However, challenges such as the lack of standardized regulations and limited scientific evidence regarding the long-term effects of blue light exposure pose restraints to market expansion.

The United States holds a significant market share in the global blue light protection ingredients market. This is attributed to several factors, including a high adoption rate of digital devices, widespread awareness of the harmful effects of blue light exposure, and a well-established skincare and cosmetics industry. The U.S. is home to several key market players and innovative companies that develop and produce blue light protection ingredients. The country’s strong R&D capabilities and consumer demand for effective blue light protection solutions contribute to its prominent position in the market.

South Korea is another key country in the global blue light protection ingredients market. The country has witnessed rapid growth in the skincare and cosmetics industry, driven by its strong beauty and wellness culture. South Korea is known for its advanced skincare formulations and innovative beauty products. With a high penetration of digital devices and a tech-savvy population, the awareness of blue light exposure and the demand for blue light protection solutions are increasing in the country. South Korean companies are actively developing blue light protection ingredients, leveraging their skincare and cosmetic formulation expertise to cater to the growing consumer demand.

Increasing Digital Device Usage

The widespread adoption of digital devices, such as smartphones, laptops, and tablets, has led to a surge in blue light exposure. This has raised awareness about the potentially harmful effects of blue light on skin and eye health, driving the demand for blue light protection ingredients in skincare and cosmetic products.

Growing Consumer Awareness

Consumers are increasingly aware of the importance of protecting against blue light. As individuals become more conscious of the impact of blue light on their well-being, there is an increasing demand for products that offer blue light protection. This consumer awareness is driving market growth and influencing purchasing decisions.

Lack of Industry Regulations

Currently, standardized regulations on blue light protection ingredients still need to be improved. The absence of uniform guidelines can create confusion among consumers and limit the market’s potential. Clear regulations and standards for blue light protection ingredients would enhance consumer confidence and foster market growth.

Emerging Markets

Increasing emerging markets present untapped opportunities for blue light protection ingredients. As digital device usage increases in countries with developing economies, there is a growing need for blue light protection solutions. Companies can leverage these opportunities by expanding their market presence in these regions, introducing affordable product options, and educating consumers about the benefits of blue light protection.

Competitive Landscape

Key Players

The competitive landscape of the global blue light protection ingredients market is highly competitive and characterized by the presence of several key players. Some of the leading players in the global market and their market share are as follows:

  • Rahn AG
  • DSM
  • Clariant
  • BASF SE
  • Lonza Group AG
  • Croda International Plc
  • Ashland
  • Evonik Industries AG
  • The Lubrizol Corporation
  • GUNNAR Optiks
  • Honeywell International Inc
  • Essilor
  • J+S Vision
  • JINS Eyewear US Inc
  • Cyxus.com
  • Eyekeeper.com
  • Zendustries Inc
  • BB Fulfillment
  • Spektrum Glasses
  • Swanwick

These companies focus on research and development activities to innovate and introduce advanced blue light protection ingredient formulations. Product differentiation, strategic partnerships, and marketing initiatives are key strategies employed by market players to gain a competitive edge. The market also witnesses the entry of new players attracted by the growing demand for blue light protection ingredients. Additionally, collaborations between skincare brands, cosmetic manufacturers, and technology companies are becoming increasingly prevalent, aiming to develop innovative blue light protection solutions.

For example, in 2020, DSM Nutritional Products, LLC introduced a new line of blue-light protection compounds, including PEPHA®- AGE, NIACINAMIDE PC, and others.

Likewise, in 2020, Kobo Products Inc introduced a new broad line of blue-light protection chemicals, including TNP45TEL, TNP45TELR, and others.

Shape Your Report to Specific Countries or Regions & Enjoy 30% Off!

Summary of Key Findings

  • The increasing prevalence of digital devices and prolonged screen time drive the demand for blue light protection ingredients.
  • Market segmented by form type, nature, source, application, and region.
  • Skincare and cosmetic products, including creams, lotions, serums, and eyewear, incorporate blue light protection ingredients to cater to consumer demand.
  • North America and Europe dominate the global market due to their well-established healthcare infrastructure and higher consumer awareness.
  • Incorporating blue light protection ingredients in makeup products, such as foundations and concealers, is gaining popularity as consumers seek all-day protection against blue light exposure.
  • Marketing and educational campaigns about the potential benefits of blue light protection ingredients are crucial for increasing consumer awareness and driving market growth.

Future Outlook

  • The Asia-Pacific region, particularly China and South Korea, is emerging as a lucrative market for blue light protection ingredients, fueled by the increasing adoption of digital devices and the growing beauty and wellness culture.
  • Collaborations between skincare brands, cosmetic manufacturers, and technology companies are becoming prevalent, aiming to develop advanced blue light protection solutions.
  • Market players focus on developing multifunctional ingredients that protect from blue light and offer additional benefits such as hydration, brightening, and anti-inflammatory properties.
  • Companies are investing in R&D activities to explore new ingredients and formulation technologies that enhance the efficacy and stability of blue light protection formulations.

Segmentation

  • By Form Type
    • Solid
    • Semi-Solid
    • Liquid
  • By Nature
    • Organic
    • Conventional
  • By Source
    • Pomegranate
    • Gogi Fruit
    • Noni Fruit
    • Coffee Berry
    • Astaxanthin
    • Mangosteen
    • Others
  • By Application
    • Facial Skin Care Products
    • Body Care Products
    • Cosmetic Products
  • By Region
  • North America
    • The U.S.
    • Canada
    • Mexico
  • Europe
    • Germany
    • France
    • The U.K.
    • Italy
    • Spain
    • Rest of Europe
  • Asia Pacific
    • China
    • Japan
    • India
    • South Korea
    • South-east Asia
    • Rest of Asia Pacific
  • Latin America
    • Brazil
    • Argentina
    • Rest of Latin America
  • Middle East & Africa
    • GCC Countries
    • South Africa
    • Rest of the Middle East and Africa

1. Preface
1.1. Report Description
1.1.1. Purpose of the Report
1.1.2. Target Audience
1.1.3. USP and Key Offerings
1.2. Research Scope
1.3. Research Methodology
1.3.1. Phase I – Secondary Research
1.3.2. Phase II – Data Modelling
1.3.2.1. Company Share Analysis Model
1.3.2.2. Revenue-Based Modelling
1.3.3. Phase III – Primary Research
1.3.4. Research Limitations
1.3.5. Assumptions
1.4. Market Introduction
1.5. Market Research Scope

2. Executive Summary
2.1. Market Snapshot: Global Blue Light Protection Ingredients Market
2.2. Global Blue Light Protection Ingredients Market, By Form Type
2.3. Global Blue Light Protection Ingredients Market, By Nature
2.4. Global Blue Light Protection Ingredients Market, By Source
2.5. Global Blue Light Protection Ingredients Market, By Application
2.6. Global Blue Light Protection Ingredients Market, By Region

3. Market Dynamics & Factors Analysis
3.1. Introduction
3.1.1. Global Blue Light Protection Ingredients Market Value, 2017-2030, (US$ Bn)
3.1.2. Y-o-Y Growth Trend Analysis
3.2. Market Dynamics
3.2.1. Market Drivers
3.2.2. Market Restraints
3.2.3. Market Opportunities
3.2.4. Major Industry Challenges
3.3. Growth and Development Patterns
3.4. Investment Feasibility Analysis
3.5. Market Opportunity Analysis
3.5.1. Form Type
3.5.2. Nature
3.5.3. Source
3.5.4. Application
3.5.5. Geography

4. Premium Insights
4.1. STAR (Situation, Task, Action, Results) Analysis
4.2. Porter’s Five Forces Analysis
4.2.1. Threat of New Entrants
4.2.2. Bargaining Power of Buyers/Consumers
4.2.3. Bargaining Power of Suppliers
4.2.4. Threat of Substitute Types
4.2.5. Intensity of Competitive Rivalry
4.3. Key Market Trends
4.3.1. Demand Side Trends
4.3.2. Supply Side Trends
4.4. Value Chain Analysis
4.5. Technology Analysis
4.6. Analysis and Recommendations
4.7. Marketing Strategy Analysis
4.7.1. Direct Marketing
4.7.2. Indirect Marketing
4.7.3. Marketing Channel Development Trend

5. Market Positioning of Key Players, 2022
5.1. Company Market Share of Key Players, 2022
5.2. Competitive Benchmarking
5.3. Market Positioning of Key Vendors
5.4. Geographical Presence Analysis
5.5. Major Strategies Adopted by Key Players
5.5.1. Key Strategies Analysis
5.5.2. Mergers and Acquisitions
5.5.3. Partnerships
5.5.4. Product Launch
5.5.5. Geographical Expansion
5.5.6. Others

6. Economic Impact Analysis
6.1. Recession Impact
6.1.1. North America
6.1.2. Europe
6.1.3. Asia Pacific
6.1.4. Latin America
6.1.5. Middle East and Africa
6.2. Ukraine-Russia War Impact
6.2.1. North America
6.2.2. Europe
6.2.3. Asia Pacific
6.2.4. Latin America
6.2.5. Middle East and Africa
6.3. COVID-19 Impact Analysis
6.3.1. North America
6.3.2. Europe
6.3.3. Asia Pacific
6.3.4. Latin America
6.3.5. Middle East and Africa

7. Global Blue Light Protection Ingredients Market, By Form Type
7.1. Global Blue Light Protection Ingredients Market Overview, by Form Type
7.1.1. Global Blue Light Protection Ingredients Market Revenue Share, By Form Type, 2022 Vs 2030 (in %)
7.2. Solid
7.2.1. Global Blue Light Protection Ingredients Market, By Region, 2017-2030 (US$ Bn)
7.3. Semi-Solid
7.3.1. Global Blue Light Protection Ingredients Market, By Region, 2017-2030 (US$ Bn)
7.4. Liquid
7.4.1. Global Blue Light Protection Ingredients Market, By Region, 2017-2030 (US$ Bn)

8. Global Blue Light Protection Ingredients Market, By Nature
8.1. Global Blue Light Protection Ingredients Market Overview, by Nature
8.1.1. Global Blue Light Protection Ingredients Market, By Nature, 2022 vs 2030 (in %)
8.2. Organic
8.2.1. Global Blue Light Protection Ingredients Market, By Region, 2017-2030 (US$ Bn)
8.3. Conventional
8.3.1. Global Blue Light Protection Ingredients Market, By Region, 2017-2030 (US$ Bn)

9. Global Blue Light Protection Ingredients Market, by Source, 2017-2030 (US$ Bn)
9.1. Global Blue Light Protection Ingredients Market Overview, by Source
9.1.1. Global Blue Light Protection Ingredients Market, By Source, 2022 vs 2030 (in%)
9.2. Pomegranate
9.2.1. Global Blue Light Protection Ingredients Market, By Region, 2017-2030 (US$ Bn)
9.3. Gogi Fruit
9.3.1. Global Blue Light Protection Ingredients Market, By Region, 2017-2030 (US$ Bn)
9.4. Noni Fruit
9.4.1. Global Blue Light Protection Ingredients Market, By Region, 2017-2030 (US$ Bn)
9.5. Coffee Berry
9.5.1. Global Blue Light Protection Ingredients Market, By Region, 2017-2030 (US$ Bn)
9.6. Astaxanthin
9.6.1. Global Blue Light Protection Ingredients Market, By Region, 2017-2030 (US$ Bn)
9.7. Mangosteen
9.7.1. Global Blue Light Protection Ingredients Market, By Region, 2017-2030 (US$ Bn)
9.8. Others
9.8.1. Global Blue Light Protection Ingredients Market, By Region, 2017-2030 (US$ Bn)

10. Global Blue Light Protection Ingredients Market, by Application, 2017-2030 (US$ Bn)
10.1. Global Blue Light Protection Ingredients Market Overview, by Application
10.1.1. Global Blue Light Protection Ingredients Market, By Application, 2022 vs 2030 (in%)
10.2. Facial Skin Care Products
10.2.1. Global Blue Light Protection Ingredients Market, By Region, 2017-2030 (US$ Bn)
10.3. Body Care Products
10.3.1. Global Blue Light Protection Ingredients Market, By Region, 2017-2030 (US$ Bn)
10.4. Cosmetic Products
10.4.1. Global Blue Light Protection Ingredients Market, By Region, 2017-2030 (US$ Bn)

11. Global Blue Light Protection Ingredients Market, By Region
11.1. Global Blue Light Protection Ingredients Market Overview, by Region
11.1.1. Global Blue Light Protection Ingredients Market, By Region, 2022 vs 2030 (in%)
11.2. Form Type
11.2.1. Global Blue Light Protection Ingredients Market, By Form Type, 2017-2030 (US$ Bn)
11.3. Nature
11.3.1. Global Blue Light Protection Ingredients Market, By Nature, 2017-2030 (US$ Bn)
11.4. Source
11.4.1. Global Blue Light Protection Ingredients Market, By Source, 2017-2030 (US$ Bn)
11.5. Application
11.5.1. Global Blue Light Protection Ingredients Market, By Application, 2017-2030 (US$ Bn)

12. North America Blue Light Protection Ingredients Market Analysis
12.1. North America Blue Light Protection Ingredients Market, by Form Type, 2017-2030(US$ Bn)
12.1.1. Overview
12.1.2. SRC Analysis
12.2. North America Blue Light Protection Ingredients Market, by Nature, 2017-2030(US$ Bn)
12.2.1. Overview
12.2.2. SRC Analysis
12.3. North America Blue Light Protection Ingredients Market, by Source, 2017-2030(US$ Bn)
12.3.1. Overview
12.3.2. SRC Analysis
12.4. North America Blue Light Protection Ingredients Market, by Application, 2017-2030(US$ Bn)
12.4.1. Overview
12.4.2. SRC Analysis
12.5. North America Blue Light Protection Ingredients Market, by Country, 2017-2030 (US$ Bn)
12.5.1. North America Blue Light Protection Ingredients Market, by Country, 2022 Vs 2030 (in%)
12.5.2. U.S.
12.5.2.1. U.S. Blue Light Protection Ingredients Market Estimates and Forecast, 2017-2030 (US$ Bn)
12.5.2.2. U.S. Blue Light Protection Ingredients, By Form Type, 2017-2030 (US$ Bn)
12.5.2.3. U.S. Blue Light Protection Ingredients, By Nature, 2017-2030 (US$ Bn)
12.5.2.4. U.S. Blue Light Protection Ingredients, By Source, 2017-2030 (US$ Bn)
12.5.2.5. U.S. Blue Light Protection Ingredients, By Application, 2017-2030 (US$ Bn)
12.5.3. Canada
12.5.3.1. Canada Blue Light Protection Ingredients Market Estimates and Forecast, 2017-2030 (US$ Bn)
12.5.3.2. Canada Blue Light Protection Ingredients, By Form Type, 2017-2030 (US$ Bn)
12.5.3.3. Canada Blue Light Protection Ingredients, By Nature, 2017-2030 (US$ Bn)
12.5.3.4. Canada Blue Light Protection Ingredients, By Source, 2017-2030 (US$ Bn)
12.5.3.5. Canada Blue Light Protection Ingredients, By Application, 2017-2030 (US$ Bn)
12.5.4. Mexico
12.5.4.1. Mexico Blue Light Protection Ingredients Market Estimates and Forecast, 2017-2030 (US$ Bn)
12.5.4.2. Mexico Blue Light Protection Ingredients, By Form Type, 2017-2030 (US$ Bn)
12.5.4.3. Mexico Blue Light Protection Ingredients, By Nature, 2017-2030 (US$ Bn)
12.5.4.4. Mexico Blue Light Protection Ingredients, By Source, 2017-2030 (US$ Bn)
12.5.4.5. Mexico Blue Light Protection Ingredients, By Application, 2017-2030 (US$ Bn)

13. Europe Blue Light Protection Ingredients Market Analysis
13.1. Europe Blue Light Protection Ingredients Market, by Form Type, 2017-2030(US$ Bn)
13.1.1. Overview
13.1.2. SRC Analysis
13.2. Europe Blue Light Protection Ingredients Market, by Nature, 2017-2030(US$ Bn)
13.2.1. Overview
13.2.2. SRC Analysis
13.3. Europe Blue Light Protection Ingredients Market, by Source, 2017-2030(US$ Bn)
13.3.1. Overview
13.3.2. SRC Analysis
13.4. Europe Blue Light Protection Ingredients Market, by Application, 2017-2030(US$ Bn)
13.4.1. Overview
13.4.2. SRC Analysis
13.5. Europe Blue Light Protection Ingredients Market, by Country, 2017-2030 (US$ Bn)
13.5.1. Europe Blue Light Protection Ingredients Market, by Country, 2022 Vs 2030 (in%)
13.5.2. Germany
13.5.2.1. Germany Blue Light Protection Ingredients Market Estimates and Forecast, 2017-2030 (US$ Bn)
13.5.2.2. Germany Blue Light Protection Ingredients, By Form Type, 2017-2030 (US$ Bn)
13.5.2.3. Germany Blue Light Protection Ingredients, By Nature, 2017-2030 (US$ Bn)
13.5.2.4. Germany Blue Light Protection Ingredients, By Source, 2017-2030 (US$ Bn)
13.5.2.5. Germany Blue Light Protection Ingredients, By Application, 2017-2030 (US$ Bn)
13.5.3. France
13.5.3.1. France Blue Light Protection Ingredients Market Estimates and Forecast, 2017-2030 (US$ Bn)
13.5.3.2. France Blue Light Protection Ingredients, By Form Type, 2017-2030 (US$ Bn)
13.5.3.3. France Blue Light Protection Ingredients, By Nature, 2017-2030 (US$ Bn)
13.5.3.4. France Blue Light Protection Ingredients, By Source, 2017-2030 (US$ Bn)
13.5.3.5. France Blue Light Protection Ingredients, By Application, 2017-2030 (US$ Bn)
13.5.4. UK
13.5.4.1. UK Blue Light Protection Ingredients Market Estimates and Forecast, 2017-2030 (US$ Bn)
13.5.4.2. UK Blue Light Protection Ingredients, By Form Type, 2017-2030 (US$ Bn)
13.5.4.3. UK Blue Light Protection Ingredients, By Nature, 2017-2030 (US$ Bn)
13.5.4.4. UK Blue Light Protection Ingredients, By Source, 2017-2030 (US$ Bn)
13.5.4.5. UK Blue Light Protection Ingredients, By Application, 2017-2030 (US$ Bn)
13.5.5. Italy
13.5.5.1. Italy Blue Light Protection Ingredients Market Estimates and Forecast, 2017-2030 (US$ Bn)
13.5.5.2. Italy Blue Light Protection Ingredients, By Form Type, 2017-2030 (US$ Bn)
13.5.5.3. Italy Blue Light Protection Ingredients, By Nature, 2017-2030 (US$ Bn)
13.5.5.4. Italy Blue Light Protection Ingredients, By Source, 2017-2030 (US$ Bn)
13.5.5.5. Italy Blue Light Protection Ingredients, By Application, 2017-2030 (US$ Bn)
13.5.6. Spain
13.5.6.1. Spain Blue Light Protection Ingredients Market Estimates and Forecast, 2017-2030 (US$ Bn)
13.5.6.2. Spain Blue Light Protection Ingredients, By Form Type, 2017-2030 (US$ Bn)
13.5.6.3. Spain Blue Light Protection Ingredients, By Nature, 2017-2030 (US$ Bn)
13.5.6.4. Spain Blue Light Protection Ingredients, By Source, 2017-2030 (US$ Bn)
13.5.6.5. Spain Blue Light Protection Ingredients, By Application, 2017-2030 (US$ Bn)
13.5.7. Rest of Europe
13.5.7.1. Rest of Europe Blue Light Protection Ingredients Market Estimates and Forecast, 2017-2030 (US$ Bn)
13.5.7.2. Rest of Europe Blue Light Protection Ingredients, By Form Type, 2017-2030 (US$ Bn)
13.5.7.3. Rest of Europe Blue Light Protection Ingredients, By Nature, 2017-2030 (US$ Bn)
13.5.7.4. Rest of Europe Blue Light Protection Ingredients, By Source, 2017-2030 (US$ Bn)
13.5.7.5. Rest of Europe Blue Light Protection Ingredients, By Application, 2017-2030 (US$ Bn)

14. Asia Pacific Blue Light Protection Ingredients Market Analysis
14.1. Asia Pacific Blue Light Protection Ingredients Market, by Form Type, 2017-2030(US$ Bn)
14.1.1. Overview
14.1.2. SRC Analysis
14.2. Asia Pacific Blue Light Protection Ingredients Market, by Nature, 2017-2030(US$ Bn)
14.2.1. Overview
14.2.2. SRC Analysis
14.3. Asia Pacific Blue Light Protection Ingredients Market, by Source, 2017-2030(US$ Bn)
14.3.1. Overview
14.3.2. SRC Analysis
14.4. Asia Pacific Blue Light Protection Ingredients Market, by Application, 2017-2030(US$ Bn)
14.4.1. Overview
14.4.2. SRC Analysis
14.5. Asia Pacific Blue Light Protection Ingredients Market, by Country, 2017-2030 (US$ Bn)
14.5.1. Asia Pacific Blue Light Protection Ingredients Market, by Country, 2022 Vs 2030 (in%)
14.5.2. China
14.5.2.1. China Blue Light Protection Ingredients Market Estimates and Forecast, 2017-2030 (US$ Bn)
14.5.2.2. China Blue Light Protection Ingredients, By Form Type, 2017-2030 (US$ Bn)
14.5.2.3. China Blue Light Protection Ingredients, By Nature, 2017-2030 (US$ Bn)
14.5.2.4. China Blue Light Protection Ingredients, By Source, 2017-2030 (US$ Bn)
14.5.2.5. China Blue Light Protection Ingredients, By Application, 2017-2030 (US$ Bn)
14.5.3. Japan
14.5.3.1. Japan Blue Light Protection Ingredients Market Estimates and Forecast, 2017-2030 (US$ Bn)
14.5.3.2. Japan Blue Light Protection Ingredients, By Form Type, 2017-2030 (US$ Bn)
14.5.3.3. Japan Blue Light Protection Ingredients, By Nature, 2017-2030 (US$ Bn)
14.5.3.4. Japan Blue Light Protection Ingredients, By Source, 2017-2030 (US$ Bn)
14.5.3.5. Japan Blue Light Protection Ingredients, By Application, 2017-2030 (US$ Bn)
14.5.4. India
14.5.4.1. India Blue Light Protection Ingredients Market Estimates and Forecast, 2017-2030 (US$ Bn)
14.5.4.2. India Blue Light Protection Ingredients, By Form Type, 2017-2030 (US$ Bn)
14.5.4.3. India Blue Light Protection Ingredients, By Nature, 2017-2030 (US$ Bn)
14.5.4.4. India Blue Light Protection Ingredients, By Source, 2017-2030 (US$ Bn)
14.5.4.5. India Blue Light Protection Ingredients, By Application, 2017-2030 (US$ Bn)
14.5.5. South Korea
14.5.5.1. South Korea Blue Light Protection Ingredients Market Estimates and Forecast, 2017-2030 (US$ Bn)
14.5.5.2. South Korea Blue Light Protection Ingredients, By Form Type, 2017-2030 (US$ Bn)
14.5.5.3. South Korea Blue Light Protection Ingredients, By Nature, 2017-2030 (US$ Bn)
14.5.5.4. South Korea Blue Light Protection Ingredients, By Source, 2017-2030 (US$ Bn)
14.5.5.5. South Korea Blue Light Protection Ingredients, By Application, 2017-2030 (US$ Bn)
14.5.6. South-East Asia
14.5.6.1. South-East Asia Blue Light Protection Ingredients Market Estimates and Forecast, 2017-2030 (US$ Bn)
14.5.6.2. South-East Asia Blue Light Protection Ingredients, By Form Type, 2017-2030 (US$ Bn)
14.5.6.3. South-East Asia Blue Light Protection Ingredients, By Nature, 2017-2030 (US$ Bn)
14.5.6.4. South-East Asia Blue Light Protection Ingredients, By Source, 2017-2030 (US$ Bn)
14.5.6.5. South-East Asia Blue Light Protection Ingredients, By Application, 2017-2030 (US$ Bn)
14.5.7. Rest of Asia Pacific
14.5.7.1. Rest of Asia Pacific Blue Light Protection Ingredients Market Estimates and Forecast, 2017-2030 (US$ Bn)
14.5.7.2. Rest of Asia Pacific Blue Light Protection Ingredients, By Form Type, 2017-2030 (US$ Bn)
14.5.7.3. Rest of Asia Pacific Blue Light Protection Ingredients, By Nature, 2017-2030 (US$ Bn)
14.5.7.4. Rest of Asia Pacific Blue Light Protection Ingredients, By Source, 2017-2030 (US$ Bn)
14.5.7.5. Rest of Asia Pacific Blue Light Protection Ingredients, By Application, 2017-2030 (US$ Bn)

15. Latin America Blue Light Protection Ingredients Market Analysis
15.1. Latin America Blue Light Protection Ingredients Market, by Form Type, 2017-2030(US$ Bn)
15.1.1. Overview
15.1.2. SRC Analysis
15.2. Latin America Blue Light Protection Ingredients Market, by Nature, 2017-2030(US$ Bn)
15.2.1. Overview
15.2.2. SRC Analysis
15.3. Latin America Blue Light Protection Ingredients Market, by Source, 2017-2030(US$ Bn)
15.3.1. Overview
15.3.2. SRC Analysis
15.4. Latin America Blue Light Protection Ingredients Market, by Application, 2017-2030(US$ Bn)
15.4.1. Overview
15.4.2. SRC Analysis
15.5. Latin America Blue Light Protection Ingredients Market, by Country, 2017-2030 (US$ Bn)
15.5.1. Latin America Blue Light Protection Ingredients Market, by Country, 2022 Vs 2030 (in%)
15.5.2. Brazil
15.5.2.1. Brazil Blue Light Protection Ingredients Market Estimates and Forecast, 2017-2030 (US$ Bn)
15.5.2.2. Brazil Blue Light Protection Ingredients, By Form Type, 2017-2030 (US$ Bn)
15.5.2.3. Brazil Blue Light Protection Ingredients, By Nature, 2017-2030 (US$ Bn)
15.5.2.4. Brazil Blue Light Protection Ingredients, By Source, 2017-2030 (US$ Bn)
15.5.2.5. Brazil Blue Light Protection Ingredients, By Application, 2017-2030 (US$ Bn)
15.5.3. Argentina
15.5.3.1. Argentina Blue Light Protection Ingredients Market Estimates and Forecast, 2017-2030 (US$ Bn)
15.5.3.2. Argentina Blue Light Protection Ingredients, By Form Type, 2017-2030 (US$ Bn)
15.5.3.3. Argentina Blue Light Protection Ingredients, By Nature, 2017-2030 (US$ Bn)
15.5.3.4. Argentina Blue Light Protection Ingredients, By Source, 2017-2030 (US$ Bn)
15.5.3.5. Argentina Blue Light Protection Ingredients, By Application, 2017-2030 (US$ Bn)
15.5.4. Rest of Latin America
15.5.4.1. Rest of Latin America Blue Light Protection Ingredients Market Estimates and Forecast, 2017-2030 (US$ Bn)
15.5.4.2. Rest of Latin America Blue Light Protection Ingredients, By Form Type, 2017-2030 (US$ Bn)
15.5.4.3. Rest of Latin America Blue Light Protection Ingredients, By Nature, 2017-2030 (US$ Bn)
15.5.4.4. Rest of Latin America Blue Light Protection Ingredients, By Source, 2017-2030 (US$ Bn)
15.5.4.5. Rest of Latin America Blue Light Protection Ingredients, By Application, 2017-2030 (US$ Bn)

16. Middle East and Africa Blue Light Protection Ingredients Market Analysis
16.1. Middle East and Africa Blue Light Protection Ingredients Market, by Form Type, 2017-2030(US$ Bn)
16.1.1. Overview
16.1.2. SRC Analysis
16.2. Middle East and Africa Blue Light Protection Ingredients Market, by Nature, 2017-2030(US$ Bn)
16.2.1. Overview
16.2.2. SRC Analysis
16.3. Middle East and Africa Blue Light Protection Ingredients Market, by Source, 2017-2030(US$ Bn)
16.3.1. Overview
16.3.2. SRC Analysis
16.4. Middle East and Africa Blue Light Protection Ingredients Market, by Application, 2017-2030(US$ Bn)
16.4.1. Overview
16.4.2. SRC Analysis
16.5. Middle East and Africa Blue Light Protection Ingredients Market, by Country, 2017-2030 (US$ Bn)
16.5.1. Middle East and Africa Blue Light Protection Ingredients Market, by Country, 2022 Vs 2030 (in%)
16.5.2. GCC Countries
16.5.2.1. GCC Countries Blue Light Protection Ingredients Market Estimates and Forecast, 2017-2030 (US$ Bn)
16.5.2.2. GCC Countries Blue Light Protection Ingredients, By Form Type, 2017-2030 (US$ Bn)
16.5.2.3. GCC Countries Blue Light Protection Ingredients, By Nature, 2017-2030 (US$ Bn)
16.5.2.4. GCC Countries Blue Light Protection Ingredients, By Source, 2017-2030 (US$ Bn)
16.5.2.5. GCC Countries Blue Light Protection Ingredients, By Application, 2017-2030 (US$ Bn)
16.5.3. South Africa
16.5.3.1. South Africa Blue Light Protection Ingredients Market Estimates and Forecast, 2017-2030 (US$ Bn)
16.5.3.2. South Africa Blue Light Protection Ingredients, By Form Type, 2017-2030 (US$ Bn)
16.5.3.3. South Africa Blue Light Protection Ingredients, By Nature, 2017-2030 (US$ Bn)
16.5.3.4. South Africa Blue Light Protection Ingredients, By Source, 2017-2030 (US$ Bn)
16.5.3.5. South Africa Blue Light Protection Ingredients, By Application, 2017-2030 (US$ Bn)
16.5.4. Rest of Middle East and Africa
16.5.4.1. Rest of Middle East and Africa Blue Light Protection Ingredients Market Estimates and Forecast, 2017-2030 (US$ Bn)
16.5.4.2. Rest of Middle East and Africa Blue Light Protection Ingredients, By Form Type, 2017-2030 (US$ Bn)
16.5.4.3. Rest of Middle East and Africa Blue Light Protection Ingredients, By Nature, 2017-2030 (US$ Bn)
16.5.4.4. Rest of Middle East and Africa Blue Light Protection Ingredients, By Source, 2017-2030 (US$ Bn)
16.5.4.5. Rest of Middle East and Africa Blue Light Protection Ingredients, By Application, 2017-2030 (US$ Bn)

17. Company Profiles
17.1. Rahn AG
17.1.1. Company Overview
17.1.2. Products/Services Portfolio
17.1.3. Geographical Presence
17.1.4. Financial Summary
17.1.4.1. Market Revenue and Net Profit (2019-2022)
17.1.4.2. Business Segment Revenue Analysis
17.1.4.3. Geographical Revenue Analysis
17.2. DSM
17.3. Clariant
17.4. BASF SE
17.5. Lonza Group AG
17.6. Croda International Plc
17.7. Ashland
17.8. Evonik Industries AG
17.9. The Lubrizol Corporation
17.10. GUNNAR Optiks
17.11. Honeywell International Inc
17.12. Essilor
17.13. J+S Vision
17.14. JINS Eyewear US Inc
17.15. Cyxus.com
17.16. Eyekeeper.com
17.17. Zendustries Inc
17.18. BB Fulfillment
17.19. Spektrum Glasses
17.20. Swanwick

List of Figures
FIG. 1 Global Blue Light Protection Ingredients Market: Research Methodology
FIG. 2 Market Size Estimation – Top Down & Bottom Up Approach
FIG. 3 Global Blue Light Protection Ingredients Market Segmentation
FIG. 4 Global Blue Light Protection Ingredients Market, by Form Type, 2022 (US$ Bn)
FIG. 5 Global Blue Light Protection Ingredients Market, by Nature, 2022 (US$ Bn)
FIG. 6 Global Blue Light Protection Ingredients Market, by Source, 2022 (US$ Bn)
FIG. 7 Global Blue Light Protection Ingredients Market, by Application, 2022 (US$ Bn)
FIG. 8 Global Blue Light Protection Ingredients Market, by Geography, 2022 (US$ Bn)
FIG. 9 Attractive Investment Proposition, by Form Type, 2022
FIG. 10 Attractive Investment Proposition, by Nature, 2022
FIG. 11 Attractive Investment Proposition, by Source, 2022
FIG. 12 Attractive Investment Proposition, by Application, 2022
FIG. 13 Attractive Investment Proposition, by Geography, 2022
FIG. 14 Global Market Share Analysis of Key Blue Light Protection Ingredients Market Manufacturers, 2022
FIG. 15 Global Market Positioning of Key Blue Light Protection Ingredients Market Manufacturers, 2022
FIG. 16 Global Blue Light Protection Ingredients Market Value Contribution, By Form Type, 2022 & 2030 (Value %)
FIG. 17 Global Blue Light Protection Ingredients Market, by Solid, Value, 2017-2030 (US$ Bn)
FIG. 18 Global Blue Light Protection Ingredients Market, by Semi-Solid, Value, 2017-2030 (US$ Bn)
FIG. 19 Global Blue Light Protection Ingredients Market, by Liquid, Value, 2017-2030 (US$ Bn)
FIG. 20 Global Blue Light Protection Ingredients Market Value Contribution, By Nature, 2022 & 2030 (Value %)
FIG. 21 Global Blue Light Protection Ingredients Market, by Organic, 2017-2030 (US$ Bn)
FIG. 22 Global Blue Light Protection Ingredients Market, by Conventional, Value, 2017-2030 (US$ Bn)
FIG. 23 Global Blue Light Protection Ingredients Market Value Contribution, By Source, 2022 & 2030 (Value %)
FIG. 24 Global Blue Light Protection Ingredients Market, by Pomegranate, Value, 2017-2030 (US$ Bn)
FIG. 25 Global Blue Light Protection Ingredients Market, by Gogi Fruit, 2017-2030 (US$ Bn)
FIG. 26 Global Blue Light Protection Ingredients Market, by Noni Fruit, 2017-2030 (US$ Bn)
FIG. 27 Global Blue Light Protection Ingredients Market, by Coffee Berry, 2017-2030 (US$ Bn)
FIG. 28 Global Blue Light Protection Ingredients Market, by Astaxanthin, 2017-2030 (US$ Bn)
FIG. 29 Global Blue Light Protection Ingredients Market, by Mangosteen, 2017-2030 (US$ Bn)
FIG. 30 Global Blue Light Protection Ingredients Market, by Others, 2017-2030 (US$ Bn)
FIG. 31 Global Blue Light Protection Ingredients Market Value Contribution, By Application, 2022 & 2030 (Value %)
FIG. 32 Global Blue Light Protection Ingredients Market, by Facial Skin Care Products, Value, 2017-2030 (US$ Bn)
FIG. 33 Global Blue Light Protection Ingredients Market, by Body Care Products, 2017-2030 (US$ Bn)
FIG. 34 Global Blue Light Protection Ingredients Market, by Cosmetic Products, 2017-2030 (US$ Bn)
FIG. 35 North America Blue Light Protection Ingredients Market, 2017-2030 (US$ Bn)
FIG. 36 U.S. Blue Light Protection Ingredients Market, 2017-2030 (US$ Bn)
FIG. 37 Canada Blue Light Protection Ingredients Market, 2017-2030 (US$ Bn)
FIG. 38 Europe Blue Light Protection Ingredients Market, 2017-2030 (US$ Bn)
FIG. 39 Germany Blue Light Protection Ingredients Market, 2017-2030 (US$ Bn)
FIG. 40 France Blue Light Protection Ingredients Market, 2017-2030 (US$ Bn)
FIG. 41 U.K. Blue Light Protection Ingredients Market, 2017-2030 (US$ Bn)
FIG. 42 Italy Blue Light Protection Ingredients Market, 2017-2030 (US$ Bn)
FIG. 43 Spain Blue Light Protection Ingredients Market, 2017-2030 (US$ Bn)
FIG. 44 Rest of Europe Blue Light Protection Ingredients Market, 2017-2030 (US$ Bn)
FIG. 45 Asia Pacific Blue Light Protection Ingredients Market, 2017-2030 (US$ Bn)
FIG. 46 China Blue Light Protection Ingredients Market, 2017-2030 (US$ Bn)
FIG. 47 Japan Blue Light Protection Ingredients Market, 2017-2030 (US$ Bn)
FIG. 48 India Blue Light Protection Ingredients Market, 2017-2030 (US$ Bn)
FIG. 49 South Korea Blue Light Protection Ingredients Market, 2017-2030 (US$ Bn)
FIG. 50 South-East Asia Blue Light Protection Ingredients Market, 2017-2030 (US$ Bn)
FIG. 51 Rest of Asia Pacific Blue Light Protection Ingredients Market, 2017-2030 (US$ Bn)
FIG. 52 Latin America Blue Light Protection Ingredients Market, 2017-2030 (US$ Bn)
FIG. 53 Brazil Blue Light Protection Ingredients Market, 2017-2030 (US$ Bn)
FIG. 54 Mexico Blue Light Protection Ingredients Market, 2017-2030 (US$ Bn)
FIG. 55 Rest of Latin America Blue Light Protection Ingredients Market, 2017-2030 (US$ Bn)
FIG. 56 Middle East & Africa Blue Light Protection Ingredients Market, 2017-2030 (US$ Bn)
FIG. 57 GCC Countries Blue Light Protection Ingredients Market, 2017-2030 (US$ Bn)
FIG. 58 South Africa Blue Light Protection Ingredients Market, 2017-2030 (US$ Bn)
FIG. 59 Rest of Middle East and Africa Blue Light Protection Ingredients Market, 2017-2030 (US$ Bn)

List of Tables
TABLE 1 Market Snapshot: Global Blue Light Protection Ingredients Market
TABLE 2 Global Blue Light Protection Ingredients Market: Market Drivers Impact Analysis
TABLE 3 Global Blue Light Protection Ingredients Market: Market Restraints Impact Analysis
TABLE 4 Global Blue Light Protection Ingredients Market, by Competitive Benchmarking, 2022
TABLE 5 Global Blue Light Protection Ingredients Market, by Geographical Presence Analysis, 2022
TABLE 6 Global Blue Light Protection Ingredients Market, by Key Strategies Analysis, 2022
TABLE 7 Global Blue Light Protection Ingredients Market, by Solid, By Region, 2017-2022 (US$ Bn)
TABLE 8 Global Blue Light Protection Ingredients Market, by Solid, By Region, 2023-2030 (US$ Bn)
TABLE 9 Global Blue Light Protection Ingredients Market, by Semi-Solid, By Region, 2017-2022 (US$ Bn)
TABLE 10 Global Blue Light Protection Ingredients Market, by Semi-Solid, By Region, 2023-2030 (US$ Bn)
TABLE 11 Global Blue Light Protection Ingredients Market, by Liquid, By Region, 2017-2022 (US$ Bn)
TABLE 12 Global Blue Light Protection Ingredients Market, by Liquid, By Region, 2023-2030 (US$ Bn)
TABLE 13 Global Blue Light Protection Ingredients Market, by Organic, By Region, 2017-2022 (US$ Bn)
TABLE 14 Global Blue Light Protection Ingredients Market, by Organic, By Region, 2023-2030 (US$ Bn)
TABLE 15 Global Blue Light Protection Ingredients Market, by Conventional, By Region, 2017-2022 (US$ Bn)
TABLE 16 Global Blue Light Protection Ingredients Market, by Conventional, By Region, 2023-2030 (US$ Bn)
TABLE 17 Global Blue Light Protection Ingredients Market, by Pomegranate, By Region, 2017-2022 (US$ Bn)
TABLE 18 Global Blue Light Protection Ingredients Market, by Pomegranate, By Region, 2023-2030 (US$ Bn)
TABLE 19 Global Blue Light Protection Ingredients Market, by Gogi Fruit, By Region, 2017-2022 (US$ Bn)
TABLE 20 Global Blue Light Protection Ingredients Market, by Gogi Fruit, By Region, 2023-2030 (US$ Bn)
TABLE 21 Global Blue Light Protection Ingredients Market, by Noni Fruit, By Region, 2017-2022 (US$ Bn)
TABLE 22 Global Blue Light Protection Ingredients Market, by Noni Fruit, By Region, 2023-2030 (US$ Bn)
TABLE 23 Global Blue Light Protection Ingredients Market, by Coffee Berry, By Region, 2017-2022 (US$ Bn)
TABLE 24 Global Blue Light Protection Ingredients Market, by Coffee Berry, By Region, 2023-2030 (US$ Bn)
TABLE 25 Global Blue Light Protection Ingredients Market, by Astaxanthin, By Region, 2017-2022 (US$ Bn)
TABLE 26 Global Blue Light Protection Ingredients Market, by Astaxanthin, By Region, 2023-2030 (US$ Bn)
TABLE 27 Global Blue Light Protection Ingredients Market, by Mangosteen, By Region, 2017-2022 (US$ Bn)
TABLE 28 Global Blue Light Protection Ingredients Market, by Mangosteen, By Region, 2023-2030 (US$ Bn)
TABLE 29 Global Blue Light Protection Ingredients Market, by Others, By Region, 2017-2022 (US$ Bn)
TABLE 30 Global Blue Light Protection Ingredients Market, by Others, By Region, 2023-2030 (US$ Bn)
TABLE 31 Global Blue Light Protection Ingredients Market, by Facial Skin Care Products, By Region, 2017-2022 (US$ Bn)
TABLE 32 Global Blue Light Protection Ingredients Market, by Facial Skin Care Products, By Region, 2023-2030 (US$ Bn)
TABLE 33 Global Blue Light Protection Ingredients Market, by Body Care Products, By Region, 2017-2022 (US$ Bn)
TABLE 34 Global Blue Light Protection Ingredients Market, by Body Care Products, By Region, 2023-2030 (US$ Bn)
TABLE 35 Global Blue Light Protection Ingredients Market, by Cosmetic Products, By Region, 2017-2022 (US$ Bn)
TABLE 36 Global Blue Light Protection Ingredients Market, by Cosmetic Products, By Region, 2023-2030 (US$ Bn)
TABLE 37 Global Blue Light Protection Ingredients Market, by Form Type, 2017-2022 (US$ Bn)
TABLE 38 Global Blue Light Protection Ingredients Market, by Form Type, 2023-2030 (US$ Bn)
TABLE 39 Global Blue Light Protection Ingredients Market, by Nature, 2017-2022 (US$ Bn)
TABLE 40 Global Blue Light Protection Ingredients Market, by Nature, 2023-2030 (US$ Bn)
TABLE 41 Global Blue Light Protection Ingredients Market, by Source, 2017-2022 (US$ Bn)
TABLE 42 Global Blue Light Protection Ingredients Market, by Source, 2023-2030 (US$ Bn)
TABLE 43 Global Blue Light Protection Ingredients Market, by Application, 2017-2022 (US$ Bn)
TABLE 44 Global Blue Light Protection Ingredients Market, by Application, 2023-2030 (US$ Bn)
TABLE 45 Global Blue Light Protection Ingredients Market, by Region, 2017-2022 (US$ Bn)
TABLE 46 Global Blue Light Protection Ingredients Market, by Region, 2023-2030 (US$ Bn)
TABLE 47 North America Blue Light Protection Ingredients Market, by Form Type, 2017-2022 (US$ Bn)
TABLE 48 North America Blue Light Protection Ingredients Market, by Form Type, 2023-2030 (US$ Bn)
TABLE 49 North America Blue Light Protection Ingredients Market, by Nature, 2017-2022 (US$ Bn)
TABLE 50 North America Blue Light Protection Ingredients Market, by Nature, 2023-2030 (US$ Bn)
TABLE 51 North America Blue Light Protection Ingredients Market, by Source, 2017-2022 (US$ Bn)
TABLE 52 North America Blue Light Protection Ingredients Market, by Source, 2023-2030 (US$ Bn)
TABLE 53 North America Blue Light Protection Ingredients Market, by Application, 2017-2022 (US$ Bn)
TABLE 54 North America Blue Light Protection Ingredients Market, by Application, 2023-2030 (US$ Bn)
TABLE 55 North America Blue Light Protection Ingredients Market, by Country, 2017-2022 (US$ Bn)
TABLE 56 North America Blue Light Protection Ingredients Market, by Country, 2023-2030 (US$ Bn)
TABLE 57 United States Blue Light Protection Ingredients Market, by Form Type, 2017-2022 (US$ Bn)
TABLE 58 United States Blue Light Protection Ingredients Market, by Form Type, 2023-2030 (US$ Bn)
TABLE 59 United States Blue Light Protection Ingredients Market, by Nature, 2017-2022 (US$ Bn)
TABLE 60 United States Blue Light Protection Ingredients Market, by Nature, 2023-2030 (US$ Bn)
TABLE 61 United States Blue Light Protection Ingredients Market, by Source, 2017-2022 (US$ Bn)
TABLE 62 United States Blue Light Protection Ingredients Market, by Source, 2023-2030 (US$ Bn)
TABLE 63 United States Blue Light Protection Ingredients Market, by Application, 2017-2022 (US$ Bn)
TABLE 64 United States Blue Light Protection Ingredients Market, by Application, 2023-2030 (US$ Bn)
TABLE 65 Canada Blue Light Protection Ingredients Market, by Form Type, 2017-2022 (US$ Bn)
TABLE 66 Canada Blue Light Protection Ingredients Market, by Form Type, 2023-2030 (US$ Bn)
TABLE 67 Canada Blue Light Protection Ingredients Market, by Nature, 2017-2022 (US$ Bn)
TABLE 68 Canada Blue Light Protection Ingredients Market, by Nature, 2023-2030 (US$ Bn)
TABLE 69 Canada Blue Light Protection Ingredients Market, by Source, 2017-2022 (US$ Bn)
TABLE 70 Canada Blue Light Protection Ingredients Market, by Source, 2023-2030 (US$ Bn)
TABLE 71 Canada Blue Light Protection Ingredients Market, by Application, 2017-2022 (US$ Bn)
TABLE 72 Canada Blue Light Protection Ingredients Market, by Application, 2023-2030 (US$ Bn)
TABLE 73 Mexico Blue Light Protection Ingredients Market, by Form Type, 2017-2022 (US$ Bn)
TABLE 74 Mexico Blue Light Protection Ingredients Market, by Form Type, 2023-2030 (US$ Bn)
TABLE 75 Mexico Blue Light Protection Ingredients Market, by Nature, 2017-2022 (US$ Bn)
TABLE 76 Mexico Blue Light Protection Ingredients Market, by Nature, 2023-2030 (US$ Bn)
TABLE 77 Mexico Blue Light Protection Ingredients Market, by Source, 2017-2022 (US$ Bn)
TABLE 78 Mexico Blue Light Protection Ingredients Market, by Source, 2023-2030 (US$ Bn)
TABLE 79 Mexico Blue Light Protection Ingredients Market, by Application, 2017-2022 (US$ Bn)
TABLE 80 Mexico Blue Light Protection Ingredients Market, by Application, 2023-2030 (US$ Bn)
TABLE 81 Europe Blue Light Protection Ingredients Market, by Form Type, 2017-2022 (US$ Bn)
TABLE 82 Europe Blue Light Protection Ingredients Market, by Form Type, 2023-2030 (US$ Bn)
TABLE 83 Europe Blue Light Protection Ingredients Market, by Nature, 2017-2022 (US$ Bn)
TABLE 84 Europe Blue Light Protection Ingredients Market, by Nature, 2023-2030 (US$ Bn)
TABLE 85 Europe Blue Light Protection Ingredients Market, by Source, 2017-2022 (US$ Bn)
TABLE 86 Europe Blue Light Protection Ingredients Market, by Source, 2023-2030 (US$ Bn)
TABLE 87 Europe Blue Light Protection Ingredients Market, by Application, 2017-2022 (US$ Bn)
TABLE 88 Europe Blue Light Protection Ingredients Market, by Application, 2023-2030 (US$ Bn)
TABLE 89 Europe Blue Light Protection Ingredients Market, by Country, 2017-2022 (US$ Bn)
TABLE 90 Europe Blue Light Protection Ingredients Market, by Country, 2023-2030 (US$ Bn)
TABLE 91 Germany Blue Light Protection Ingredients Market, by Form Type, 2017-2022 (US$ Bn)
TABLE 92 Germany Blue Light Protection Ingredients Market, by Form Type, 2023-2030 (US$ Bn)
TABLE 93 Germany Blue Light Protection Ingredients Market, by Nature, 2017-2022 (US$ Bn)
TABLE 94 Germany Blue Light Protection Ingredients Market, by Nature, 2023-2030 (US$ Bn)
TABLE 95 Germany Blue Light Protection Ingredients Market, by Source, 2017-2022 (US$ Bn)
TABLE 96 Germany Blue Light Protection Ingredients Market, by Source, 2023-2030 (US$ Bn)
TABLE 97 Germany Blue Light Protection Ingredients Market, by Application, 2017-2022 (US$ Bn)
TABLE 98 Germany Blue Light Protection Ingredients Market, by Application, 2023-2030 (US$ Bn)
TABLE 99 France Blue Light Protection Ingredients Market, by Form Type, 2017-2022 (US$ Bn)
TABLE 100 France Blue Light Protection Ingredients Market, by Form Type, 2023-2030 (US$ Bn)
TABLE 101 France Blue Light Protection Ingredients Market, by Nature, 2017-2022 (US$ Bn)
TABLE 102 France Blue Light Protection Ingredients Market, by Nature, 2023-2030 (US$ Bn)
TABLE 103 France Blue Light Protection Ingredients Market, by Source, 2017-2022 (US$ Bn)
TABLE 104 France Blue Light Protection Ingredients Market, by Source, 2023-2030 (US$ Bn)
TABLE 105 France Blue Light Protection Ingredients Market, by Application, 2017-2022 (US$ Bn)
TABLE 106 France Blue Light Protection Ingredients Market, by Application, 2023-2030 (US$ Bn)
TABLE 107 United Kingdom Blue Light Protection Ingredients Market, by Form Type, 2017-2022 (US$ Bn)
TABLE 108 United Kingdom Blue Light Protection Ingredients Market, by Form Type, 2023-2030 (US$ Bn)
TABLE 109 United Kingdom Blue Light Protection Ingredients Market, by Nature, 2017-2022 (US$ Bn)
TABLE 110 United Kingdom Blue Light Protection Ingredients Market, by Nature, 2023-2030 (US$ Bn)
TABLE 111 United Kingdom Blue Light Protection Ingredients Market, by Source, 2017-2022 (US$ Bn)
TABLE 112 United Kingdom Blue Light Protection Ingredients Market, by Source, 2023-2030 (US$ Bn)
TABLE 113 United Kingdom Blue Light Protection Ingredients Market, by Application, 2017-2022 (US$ Bn)
TABLE 114 United Kingdom Blue Light Protection Ingredients Market, by Application, 2023-2030 (US$ Bn)
TABLE 115 Italy Blue Light Protection Ingredients Market, by Form Type, 2017-2022 (US$ Bn)
TABLE 116 Italy Blue Light Protection Ingredients Market, by Form Type, 2023-2030 (US$ Bn)
TABLE 117 Italy Blue Light Protection Ingredients Market, by Nature, 2017-2022 (US$ Bn)
TABLE 118 Italy Blue Light Protection Ingredients Market, by Nature, 2023-2030 (US$ Bn)
TABLE 119 Italy Blue Light Protection Ingredients Market, by Source, 2017-2022 (US$ Bn)
TABLE 120 Italy Blue Light Protection Ingredients Market, by Source, 2023-2030 (US$ Bn)
TABLE 121 Italy Blue Light Protection Ingredients Market, by Application, 2017-2022 (US$ Bn)
TABLE 122 Italy Blue Light Protection Ingredients Market, by Application, 2023-2030 (US$ Bn)
TABLE 123 Spain Blue Light Protection Ingredients Market, by Form Type, 2017-2022 (US$ Bn)
TABLE 124 Spain Blue Light Protection Ingredients Market, by Form Type, 2023-2030 (US$ Bn)
TABLE 125 Spain Blue Light Protection Ingredients Market, by Nature, 2017-2022 (US$ Bn)
TABLE 126 Spain Blue Light Protection Ingredients Market, by Nature, 2023-2030 (US$ Bn)
TABLE 127 Spain Blue Light Protection Ingredients Market, by Source, 2017-2022 (US$ Bn)
TABLE 128 Spain Blue Light Protection Ingredients Market, by Source, 2023-2030 (US$ Bn)
TABLE 129 Spain Blue Light Protection Ingredients Market, by Application, 2017-2022 (US$ Bn)
TABLE 130 Spain Blue Light Protection Ingredients Market, by Application, 2023-2030 (US$ Bn)
TABLE 131 Rest of Europe Blue Light Protection Ingredients Market, by Form Type, 2017-2022 (US$ Bn)
TABLE 132 Rest of Europe Blue Light Protection Ingredients Market, by Form Type, 2023-2030 (US$ Bn)
TABLE 133 Rest of Europe Blue Light Protection Ingredients Market, by Nature, 2017-2022 (US$ Bn)
TABLE 134 Rest of Europe Blue Light Protection Ingredients Market, by Nature, 2023-2030 (US$ Bn)
TABLE 135 Rest of Europe Blue Light Protection Ingredients Market, by Source, 2017-2022 (US$ Bn)
TABLE 136 Rest of Europe Blue Light Protection Ingredients Market, by Source, 2023-2030 (US$ Bn)
TABLE 137 Rest of Europe Blue Light Protection Ingredients Market, by Application, 2017-2022 (US$ Bn)
TABLE 138 Rest of Europe Blue Light Protection Ingredients Market, by Application, 2023-2030 (US$ Bn)
TABLE 139 Asia Pacific Blue Light Protection Ingredients Market, by Form Type, 2017-2022 (US$ Bn)
TABLE 140 Asia Pacific Blue Light Protection Ingredients Market, by Form Type, 2023-2030 (US$ Bn)
TABLE 141 Asia Pacific Blue Light Protection Ingredients Market, by Nature, 2017-2022 (US$ Bn)
TABLE 142 Asia Pacific Blue Light Protection Ingredients Market, by Nature, 2023-2030 (US$ Bn)
TABLE 143 Asia Pacific Blue Light Protection Ingredients Market, by Source, 2017-2022 (US$ Bn)
TABLE 144 Asia Pacific Blue Light Protection Ingredients Market, by Source, 2023-2030 (US$ Bn)
TABLE 145 Asia Pacific Blue Light Protection Ingredients Market, by Application, 2017-2022 (US$ Bn)
TABLE 146 Asia Pacific Blue Light Protection Ingredients Market, by Application, 2023-2030 (US$ Bn)
TABLE 147 China Blue Light Protection Ingredients Market, by Form Type, 2017-2022 (US$ Bn)
TABLE 148 China Blue Light Protection Ingredients Market, by Form Type, 2023-2030 (US$ Bn)
TABLE 149 China Blue Light Protection Ingredients Market, by Nature, 2017-2022 (US$ Bn)
TABLE 150 China Blue Light Protection Ingredients Market, by Nature, 2023-2030 (US$ Bn)
TABLE 151 China Blue Light Protection Ingredients Market, by Source, 2017-2022 (US$ Bn)
TABLE 152 China Blue Light Protection Ingredients Market, by Source, 2023-2030 (US$ Bn)
TABLE 153 China Blue Light Protection Ingredients Market, by Application, 2017-2022 (US$ Bn)
TABLE 154 China Blue Light Protection Ingredients Market, by Application, 2023-2030 (US$ Bn)
TABLE 155 Japan Blue Light Protection Ingredients Market, by Form Type, 2017-2022 (US$ Bn)
TABLE 156 Japan Blue Light Protection Ingredients Market, by Form Type, 2023-2030 (US$ Bn)
TABLE 157 Japan Blue Light Protection Ingredients Market, by Nature, 2017-2022 (US$ Bn)
TABLE 158 Japan Blue Light Protection Ingredients Market, by Nature, 2023-2030 (US$ Bn)
TABLE 159 Japan Blue Light Protection Ingredients Market, by Source, 2017-2022 (US$ Bn)
TABLE 160 Japan Blue Light Protection Ingredients Market, by Source, 2023-2030 (US$ Bn)
TABLE 161 Japan Blue Light Protection Ingredients Market, by Application, 2017-2022 (US$ Bn)
TABLE 162 Japan Blue Light Protection Ingredients Market, by Application, 2023-2030 (US$ Bn)
TABLE 163 India Blue Light Protection Ingredients Market, by Form Type, 2017-2022 (US$ Bn)
TABLE 164 India Blue Light Protection Ingredients Market, by Form Type, 2023-2030 (US$ Bn)
TABLE 165 India Blue Light Protection Ingredients Market, by Nature, 2017-2022 (US$ Bn)
TABLE 166 India Blue Light Protection Ingredients Market, by Nature, 2023-2030 (US$ Bn)
TABLE 167 India Blue Light Protection Ingredients Market, by Source, 2017-2022 (US$ Bn)
TABLE 168 India Blue Light Protection Ingredients Market, by Source, 2023-2030 (US$ Bn)
TABLE 169 India Blue Light Protection Ingredients Market, by Application, 2017-2022 (US$ Bn)
TABLE 170 India Blue Light Protection Ingredients Market, by Application, 2023-2030 (US$ Bn)
TABLE 171 South Korea Blue Light Protection Ingredients Market, by Form Type, 2017-2022 (US$ Bn)
TABLE 172 South Korea Blue Light Protection Ingredients Market, by Form Type, 2023-2030 (US$ Bn)
TABLE 173 South Korea Blue Light Protection Ingredients Market, by Nature, 2017-2022 (US$ Bn)
TABLE 174 South Korea Blue Light Protection Ingredients Market, by Nature, 2023-2030 (US$ Bn)
TABLE 175 South Korea Blue Light Protection Ingredients Market, by Source, 2017-2022 (US$ Bn)
TABLE 176 South Korea Blue Light Protection Ingredients Market, by Source, 2023-2030 (US$ Bn)
TABLE 177 South Korea Blue Light Protection Ingredients Market, by Application, 2017-2022 (US$ Bn)
TABLE 178 South Korea Blue Light Protection Ingredients Market, by Application, 2023-2030 (US$ Bn)
TABLE 179 South-East Asia Blue Light Protection Ingredients Market, by Form Type, 2017-2022 (US$ Bn)
TABLE 180 South-East Asia Blue Light Protection Ingredients Market, by Form Type, 2023-2030 (US$ Bn)
TABLE 181 South-East Asia Blue Light Protection Ingredients Market, by Nature, 2017-2022 (US$ Bn)
TABLE 182 South-East Asia Blue Light Protection Ingredients Market, by Nature, 2023-2030 (US$ Bn)
TABLE 183 South-East Asia Blue Light Protection Ingredients Market, by Source, 2017-2022 (US$ Bn)
TABLE 184 South-East Asia Blue Light Protection Ingredients Market, by Source, 2023-2030 (US$ Bn)
TABLE 185 South-East Asia Blue Light Protection Ingredients Market, by Application, 2017-2022 (US$ Bn)
TABLE 186 South-East Asia Blue Light Protection Ingredients Market, by Application, 2023-2030 (US$ Bn)
TABLE 187 Rest of Asia Pacific Blue Light Protection Ingredients Market, by Form Type, 2017-2022 (US$ Bn)
TABLE 188 Rest of Asia Pacific Blue Light Protection Ingredients Market, by Form Type, 2023-2030 (US$ Bn)
TABLE 189 Rest of Asia Pacific Blue Light Protection Ingredients Market, by Nature, 2017-2022 (US$ Bn)
TABLE 190 Rest of Asia Pacific Blue Light Protection Ingredients Market, by Nature, 2023-2030 (US$ Bn)
TABLE 191 Rest of Asia Pacific Blue Light Protection Ingredients Market, by Source, 2017-2022 (US$ Bn)
TABLE 192 Rest of Asia Pacific Blue Light Protection Ingredients Market, by Source, 2023-2030 (US$ Bn)
TABLE 193 Rest of Asia Pacific Blue Light Protection Ingredients Market, by Application, 2017-2022 (US$ Bn)
TABLE 194 Rest of Asia Pacific Blue Light Protection Ingredients Market, by Application, 2023-2030 (US$ Bn)
TABLE 195 Latin America Blue Light Protection Ingredients Market, by Form Type, 2017-2022 (US$ Bn)
TABLE 196 Latin America Blue Light Protection Ingredients Market, by Form Type, 2023-2030 (US$ Bn)
TABLE 197 Latin America Blue Light Protection Ingredients Market, by Nature, 2017-2022 (US$ Bn)
TABLE 198 Latin America Blue Light Protection Ingredients Market, by Nature, 2023-2030 (US$ Bn)
TABLE 199 Latin America Blue Light Protection Ingredients Market, by Source, 2017-2022 (US$ Bn)
TABLE 200 Latin America Blue Light Protection Ingredients Market, by Source, 2023-2030 (US$ Bn)
TABLE 201 Latin America Blue Light Protection Ingredients Market, by Application, 2017-2022 (US$ Bn)
TABLE 202 Latin America Blue Light Protection Ingredients Market, by Application, 2023-2030 (US$ Bn)
TABLE 203 Brazil Blue Light Protection Ingredients Market, by Form Type, 2017-2022 (US$ Bn)
TABLE 204 Brazil Blue Light Protection Ingredients Market, by Form Type, 2023-2030 (US$ Bn)
TABLE 205 Brazil Blue Light Protection Ingredients Market, by Nature, 2017-2022 (US$ Bn)
TABLE 206 Brazil Blue Light Protection Ingredients Market, by Nature, 2023-2030 (US$ Bn)
TABLE 207 Brazil Blue Light Protection Ingredients Market, by Source, 2017-2022 (US$ Bn)
TABLE 208 Brazil Blue Light Protection Ingredients Market, by Source, 2023-2030 (US$ Bn)
TABLE 209 Brazil Blue Light Protection Ingredients Market, by Application, 2017-2022 (US$ Bn)
TABLE 210 Brazil Blue Light Protection Ingredients Market, by Application, 2023-2030 (US$ Bn)
TABLE 211 Argentina Blue Light Protection Ingredients Market, by Form Type, 2017-2022 (US$ Bn)
TABLE 212 Argentina Blue Light Protection Ingredients Market, by Form Type, 2023-2030 (US$ Bn)
TABLE 213 Argentina Blue Light Protection Ingredients Market, by Nature, 2017-2022 (US$ Bn)
TABLE 214 Argentina Blue Light Protection Ingredients Market, by Nature, 2023-2030 (US$ Bn)
TABLE 215 Argentina Blue Light Protection Ingredients Market, by Source, 2017-2022 (US$ Bn)
TABLE 216 Argentina Blue Light Protection Ingredients Market, by Source, 2023-2030 (US$ Bn)
TABLE 217 Argentina Blue Light Protection Ingredients Market, by Application, 2017-2022 (US$ Bn)
TABLE 218 Argentina Blue Light Protection Ingredients Market, by Application, 2023-2030 (US$ Bn)
TABLE 219 Rest of Latin America Blue Light Protection Ingredients Market, by Form Type, 2017-2022 (US$ Bn)
TABLE 220 Rest of Latin America Blue Light Protection Ingredients Market, by Form Type, 2023-2030 (US$ Bn)
TABLE 221 Rest of Latin America Blue Light Protection Ingredients Market, by Nature, 2017-2022 (US$ Bn)
TABLE 222 Rest of Latin America Blue Light Protection Ingredients Market, by Nature, 2023-2030 (US$ Bn)
TABLE 223 Rest of Latin America Blue Light Protection Ingredients Market, by Source, 2017-2022 (US$ Bn)
TABLE 224 Rest of Latin America Blue Light Protection Ingredients Market, by Source, 2023-2030 (US$ Bn)
TABLE 225 Rest of Latin America Blue Light Protection Ingredients Market, by Application, 2017-2022 (US$ Bn)
TABLE 226 Rest of Latin America Blue Light Protection Ingredients Market, by Application, 2023-2030 (US$ Bn)
TABLE 227 Middle East and Africa Blue Light Protection Ingredients Market, by Form Type, 2017-2022 (US$ Bn)
TABLE 228 Middle East and Africa Blue Light Protection Ingredients Market, by Form Type, 2023-2030 (US$ Bn)
TABLE 229 Middle East and Africa Blue Light Protection Ingredients Market, by Nature, 2017-2022 (US$ Bn)
TABLE 230 Middle East and Africa Blue Light Protection Ingredients Market, by Nature, 2023-2030 (US$ Bn)
TABLE 231 Middle East and Africa Blue Light Protection Ingredients Market, by Source, 2017-2022 (US$ Bn)
TABLE 232 Middle East and Africa Blue Light Protection Ingredients Market, by Source, 2023-2030 (US$ Bn)
TABLE 233 Middle East and Africa Blue Light Protection Ingredients Market, by Application, 2017-2022 (US$ Bn)
TABLE 234 Middle East and Africa Blue Light Protection Ingredients Market, by Application, 2023-2030 (US$ Bn)
TABLE 235 GCC Countries Blue Light Protection Ingredients Market, by Form Type, 2017-2022 (US$ Bn)
TABLE 236 GCC Countries Blue Light Protection Ingredients Market, by Form Type, 2023-2030 (US$ Bn)
TABLE 237 GCC Countries Blue Light Protection Ingredients Market, by Nature, 2017-2022 (US$ Bn)
TABLE 238 GCC Countries Blue Light Protection Ingredients Market, by Nature, 2023-2030 (US$ Bn)
TABLE 239 GCC Countries Blue Light Protection Ingredients Market, by Source, 2017-2022 (US$ Bn)
TABLE 240 GCC Countries Blue Light Protection Ingredients Market, by Source, 2023-2030 (US$ Bn)
TABLE 241 GCC Countries Blue Light Protection Ingredients Market, by Application, 2017-2022 (US$ Bn)
TABLE 242 GCC Countries Blue Light Protection Ingredients Market, by Application, 2023-2030 (US$ Bn)
TABLE 243 South Africa Blue Light Protection Ingredients Market, by Form Type, 2017-2022 (US$ Bn)
TABLE 244 South Africa Blue Light Protection Ingredients Market, by Form Type, 2023-2030 (US$ Bn)
TABLE 245 South Africa Blue Light Protection Ingredients Market, by Nature, 2017-2022 (US$ Bn)
TABLE 246 South Africa Blue Light Protection Ingredients Market, by Nature, 2023-2030 (US$ Bn)
TABLE 247 South Africa Blue Light Protection Ingredients Market, by Source, 2017-2022 (US$ Bn)
TABLE 248 South Africa Blue Light Protection Ingredients Market, by Source, 2023-2030 (US$ Bn)
TABLE 249 South Africa Blue Light Protection Ingredients Market, by Application, 2017-2022 (US$ Bn)
TABLE 250 South Africa Blue Light Protection Ingredients Market, by Application, 2023-2030 (US$ Bn)
TABLE 251 Rest of Middle East and Africa Blue Light Protection Ingredients Market, by Form Type, 2017-2022 (US$ Bn)
TABLE 252 Rest of Middle East and Africa Blue Light Protection Ingredients Market, by Form Type, 2023-2030 (US$ Bn)
TABLE 253 Rest of Middle East and Africa Blue Light Protection Ingredients Market, by Nature, 2017-2022 (US$ Bn)
TABLE 254 Rest of Middle East and Africa Blue Light Protection Ingredients Market, by Nature, 2023-2030 (US$ Bn)
TABLE 255 Rest of Middle East and Africa Blue Light Protection Ingredients Market, by Source, 2017-2022 (US$ Bn)
TABLE 256 Rest of Middle East and Africa Blue Light Protection Ingredients Market, by Source, 2023-2030 (US$ Bn)
TABLE 257 Rest of Middle East and Africa Blue Light Protection Ingredients Market, by Application, 2017-2022 (US$ Bn)
TABLE 258 Rest of Middle East and Africa Blue Light Protection Ingredients Market, by Application, 2023-2030 (US$ Bn)

Frequently Asked Questions

What is the current size of the global blue light protection ingredients market?

The global blue light protection ingredients market was valued at USD 0.8 Billion in 2022.

What is the anticipated growth rate of the blue light protection ingredients market between 2023 and 2030?

The blue light protection ingredients market is anticipated to grow at a CAGR of 8.9% between 2023 and 2030, reaching USD 1.45 Billion in 2030.

Which segment is leading the market share in terms of form type?

Solid is the leading segment by form type, holding over 52% share in terms of value in 2022.

Which source segment governs the global demand for blue light protection ingredients?

The coffee berry segment governs the demand for blue light protection ingredients worldwide, holding a massive share of over 34% in 2022.

Which application segment is estimated to post the highest CAGR during the forecast period?

The body care products segment will post the highest CAGR in the projected period.

Which region is fuelling the growth of the blue light protection ingredients industry?

Asia Pacific is fuelling the rapid growth of the blue light protection ingredients industry, with an over one-third share in 2022.

Who are the major global blue light protection ingredients market players?

The top players include Clariant, Croda International Plc, BASF SE, Honeywell International Inc, and Rahn AG. Other major players include Lonza Group AG, Evonik Industries AG, Essilor, Swanwick, and Spektrum Glasses.

What are the major market drivers of the blue light protection ingredients industry?

The major market drivers of the blue light protection ingredients industry are increasing digital device usage and growing consumer awareness of the harmful effects of blue light exposure.

What are the major market restraints of the blue light protection ingredients industry?

The major market restraints of the blue light protection ingredients industry include the lack of standardized regulations and limited scientific evidence regarding the long-term effects of blue light exposure.

What are the major market opportunities of the blue light protection ingredients industry?

The major market opportunities of the blue light protection ingredients industry lie in technological advancements and emerging market prospects, driven by the rising demand for skincare and cosmetic products that offer blue light protection.

Electric Guitars Market

Published:
Report ID: 37121

United Kingdom Toothpaste Tablet Market

Published:
Report ID: 36979

Electronic Cigarettes Market

Published:
Report ID: 36948

Soy Protein Ingredients Market

Published:
Report ID: 9445

Wine Corks Market

Published:
Report ID: 36862

Bag in Box Market

Published:
Report ID: 2124

Towel Warmers Market

Published:
Report ID: 36800

Fermented Tea Market

Published:
Report ID: 36734

Luxury Bath and Body Products Market

Published:
Report ID: 36700

Lint Remover Market

Published:
Report ID: 36697

Dishwashing Detergent Market

Published:
Report ID: 36688

CBD Wine Market

Published:
Report ID: 36685

Purchase Options

$2999
Delivery Format: Excel.
$4999
Designed for the individual purchaser.
$6999
Users located at a single corporate site or regional office.
$7999
Allowed for unlimited sharing globally within one company.
Smallform of Sample request

Have a question?

User Profile

Don’t settle for less – trust Mitul to help you find the best solution.

Report delivery within 24 to 48 hours

– Other Info –

What people say?-

User Review

I am very impressed with the information in this report. The author clearly did their research when they came up with this product and it has already given me a lot of ideas.

Jana Schmidt
CEDAR CX Technologies

– Connect with us –

Phone

+91 6232 49 3207


support

24/7 Research Support


sales@credenceresearch.com

– Research Methodology –

Going beyond the basics: advanced techniques in research methodology

– Trusted By –

Pepshi, LG, Nestle
Motorola, Honeywell, Johnson and johnson
LG Chem, SIEMENS, Pfizer
Unilever, Samsonite, QIAGEN