Pre-salt growth and cost pressure shape digital spending
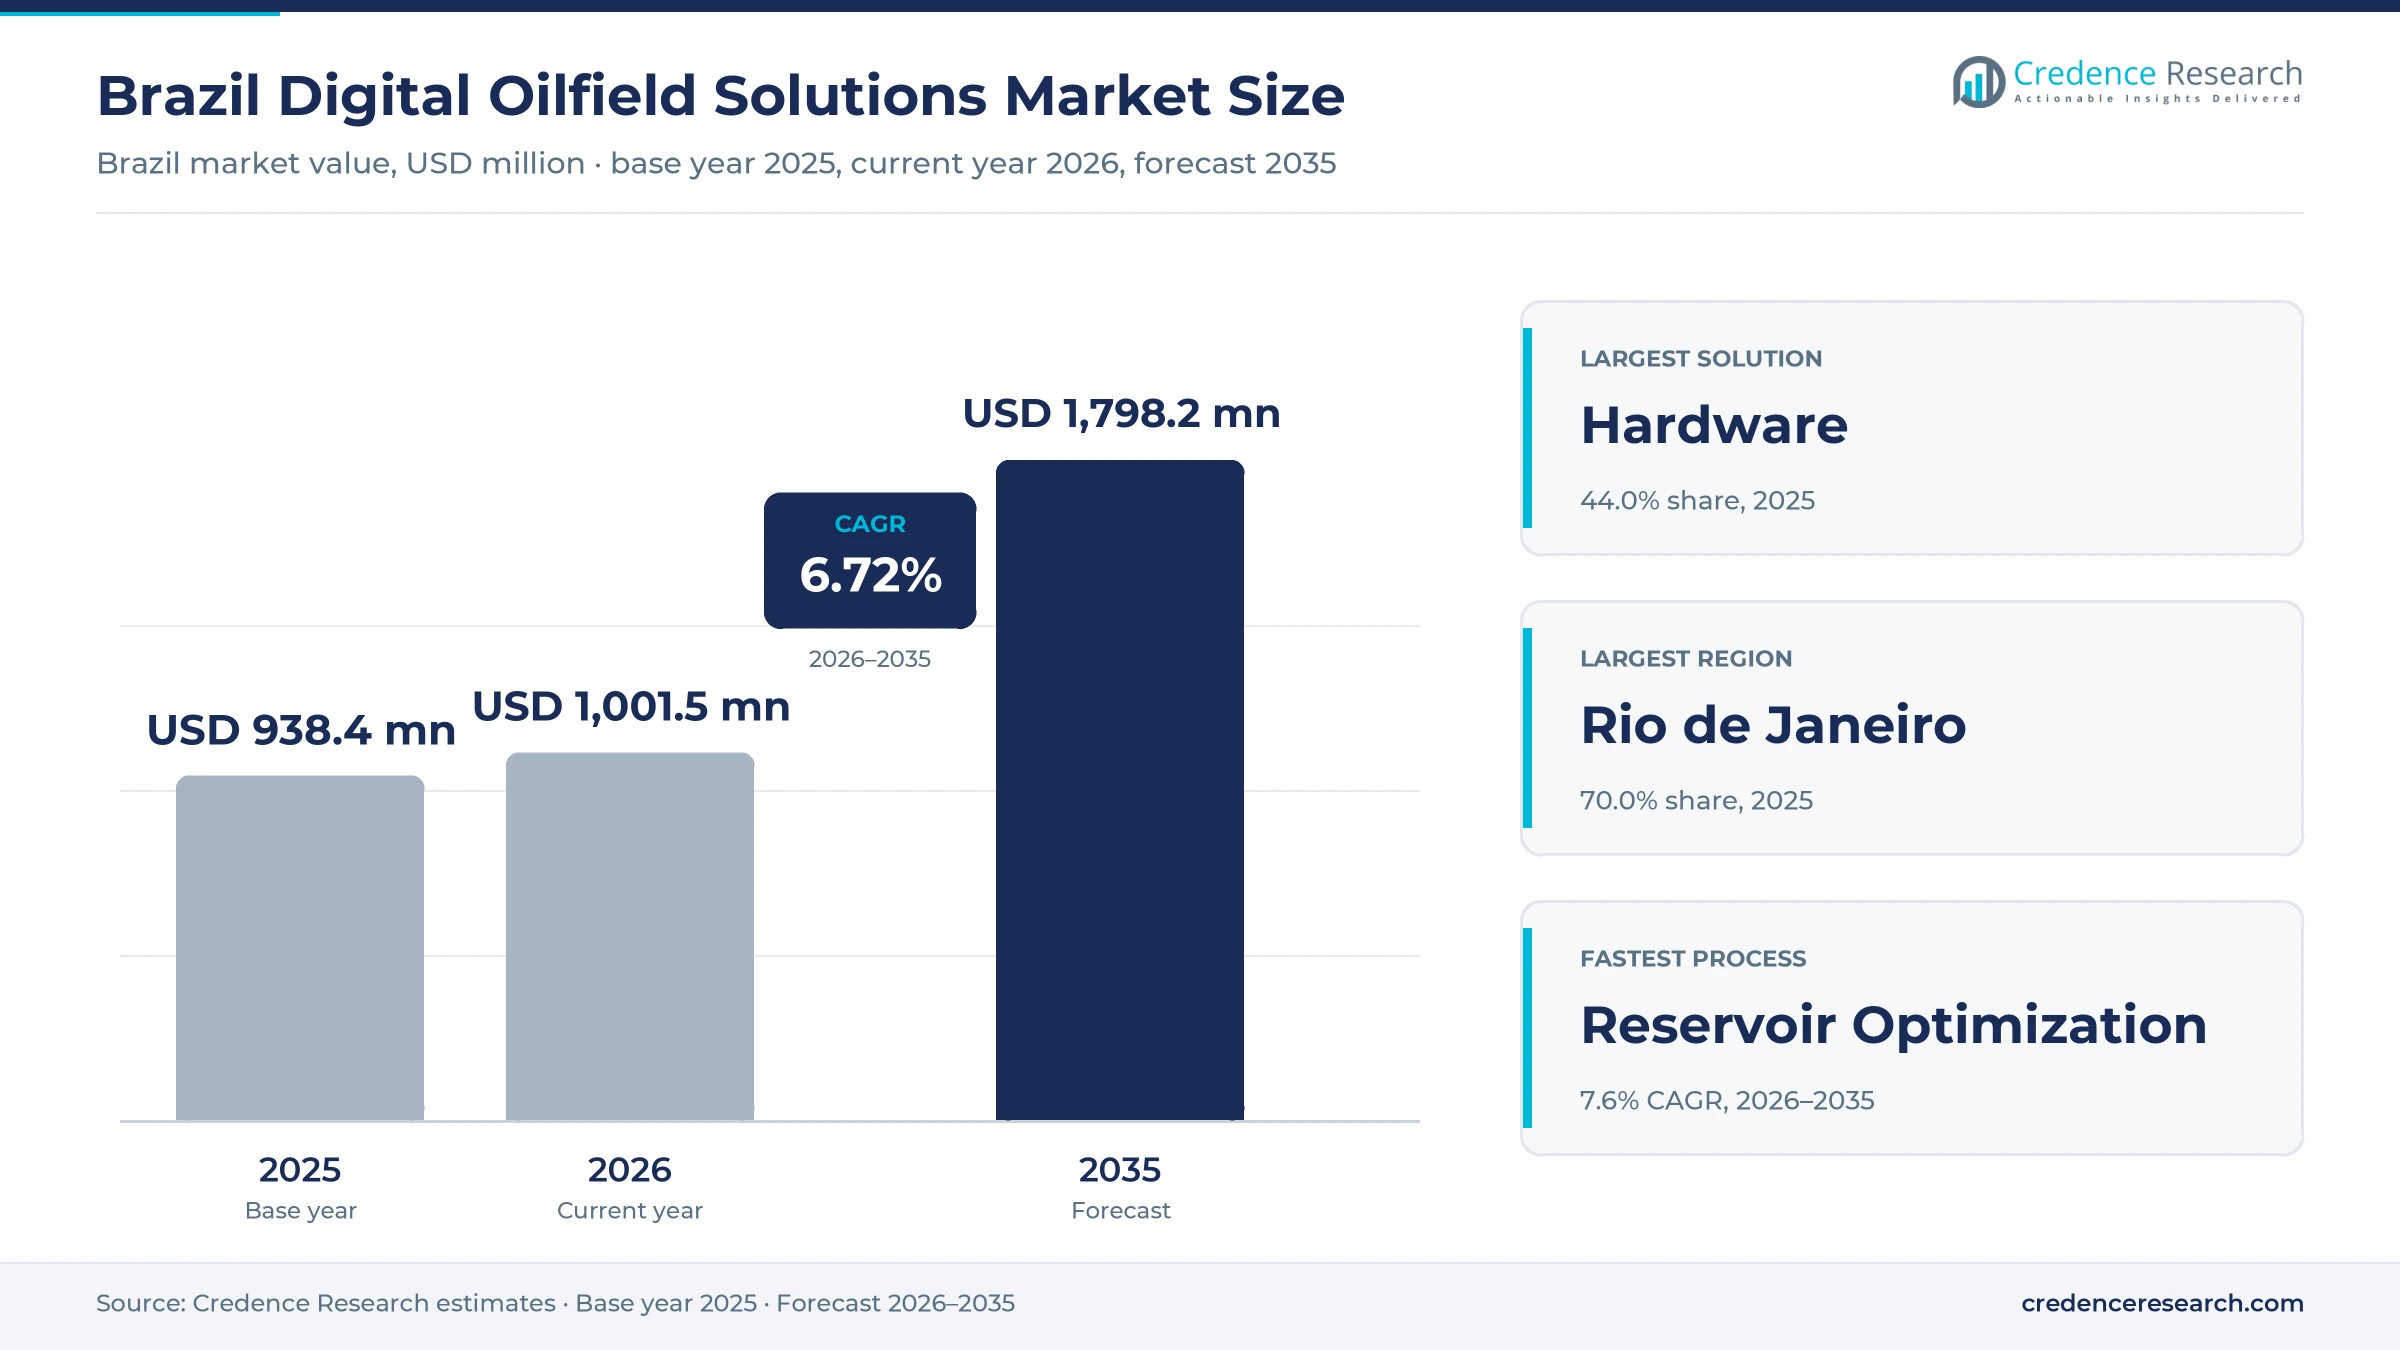
The Brazil digital oilfield solutions market was valued at USD 938.4 million in 2025 and is projected to increase from USD 1.00 billion in 2026 to USD 1.80 billion by 2035, registering a CAGR of 6.72% during 2026–2035. Demand comes from Petrobras and its pre-salt consortium partners, from international operators such as Equinor and Shell, and from independents that run mature offshore and onshore fields. Rio de Janeiro held the largest regional share, 70.0% in 2025, because most Santos and Campos basin output, FPSO control rooms and service bases are tied to the state. North and Rest of Brazil is the fastest-growing zone at 8.5% a year, as frontier exploration off Amapá adds new seismic and drilling data work. Operators are moving instrumented wells, subsea monitoring and reservoir simulation onto shared data platforms, while lower oil prices push buyers toward tools that cut lifting costs and well time.
Where digital spending sits inside Brazilian well and platform contracts
The market counts sensors, remote terminal units, control and safety systems, and the software and services that turn well, subsea and reservoir data into operating decisions for producers in Brazil. It covers reservoir modeling and seismic processing software, production optimization and condition monitoring, drilling automation and real-time drilling services, and the integration, hosting and remote support that keep these systems running.
Rigs, subsea trees, flexible pipes, completion hardware and seismic vessels are excluded, although much digital value is sold inside the same well, subsea and platform service contracts that buy them. Value flows from automation and software vendors and the large service companies, often through FPSO shipyards and integrators, to Petrobras, its consortium partners and independent operators.
Brazil Digital Oilfield Solutions Market Insights
- The Brazil digital oilfield solutions market rises from USD 938.4 million in 2025 to USD 1.80 billion by 2035, a 6.72% CAGR during 2026–2035, as new pre-salt units and brownfield software orders add value.
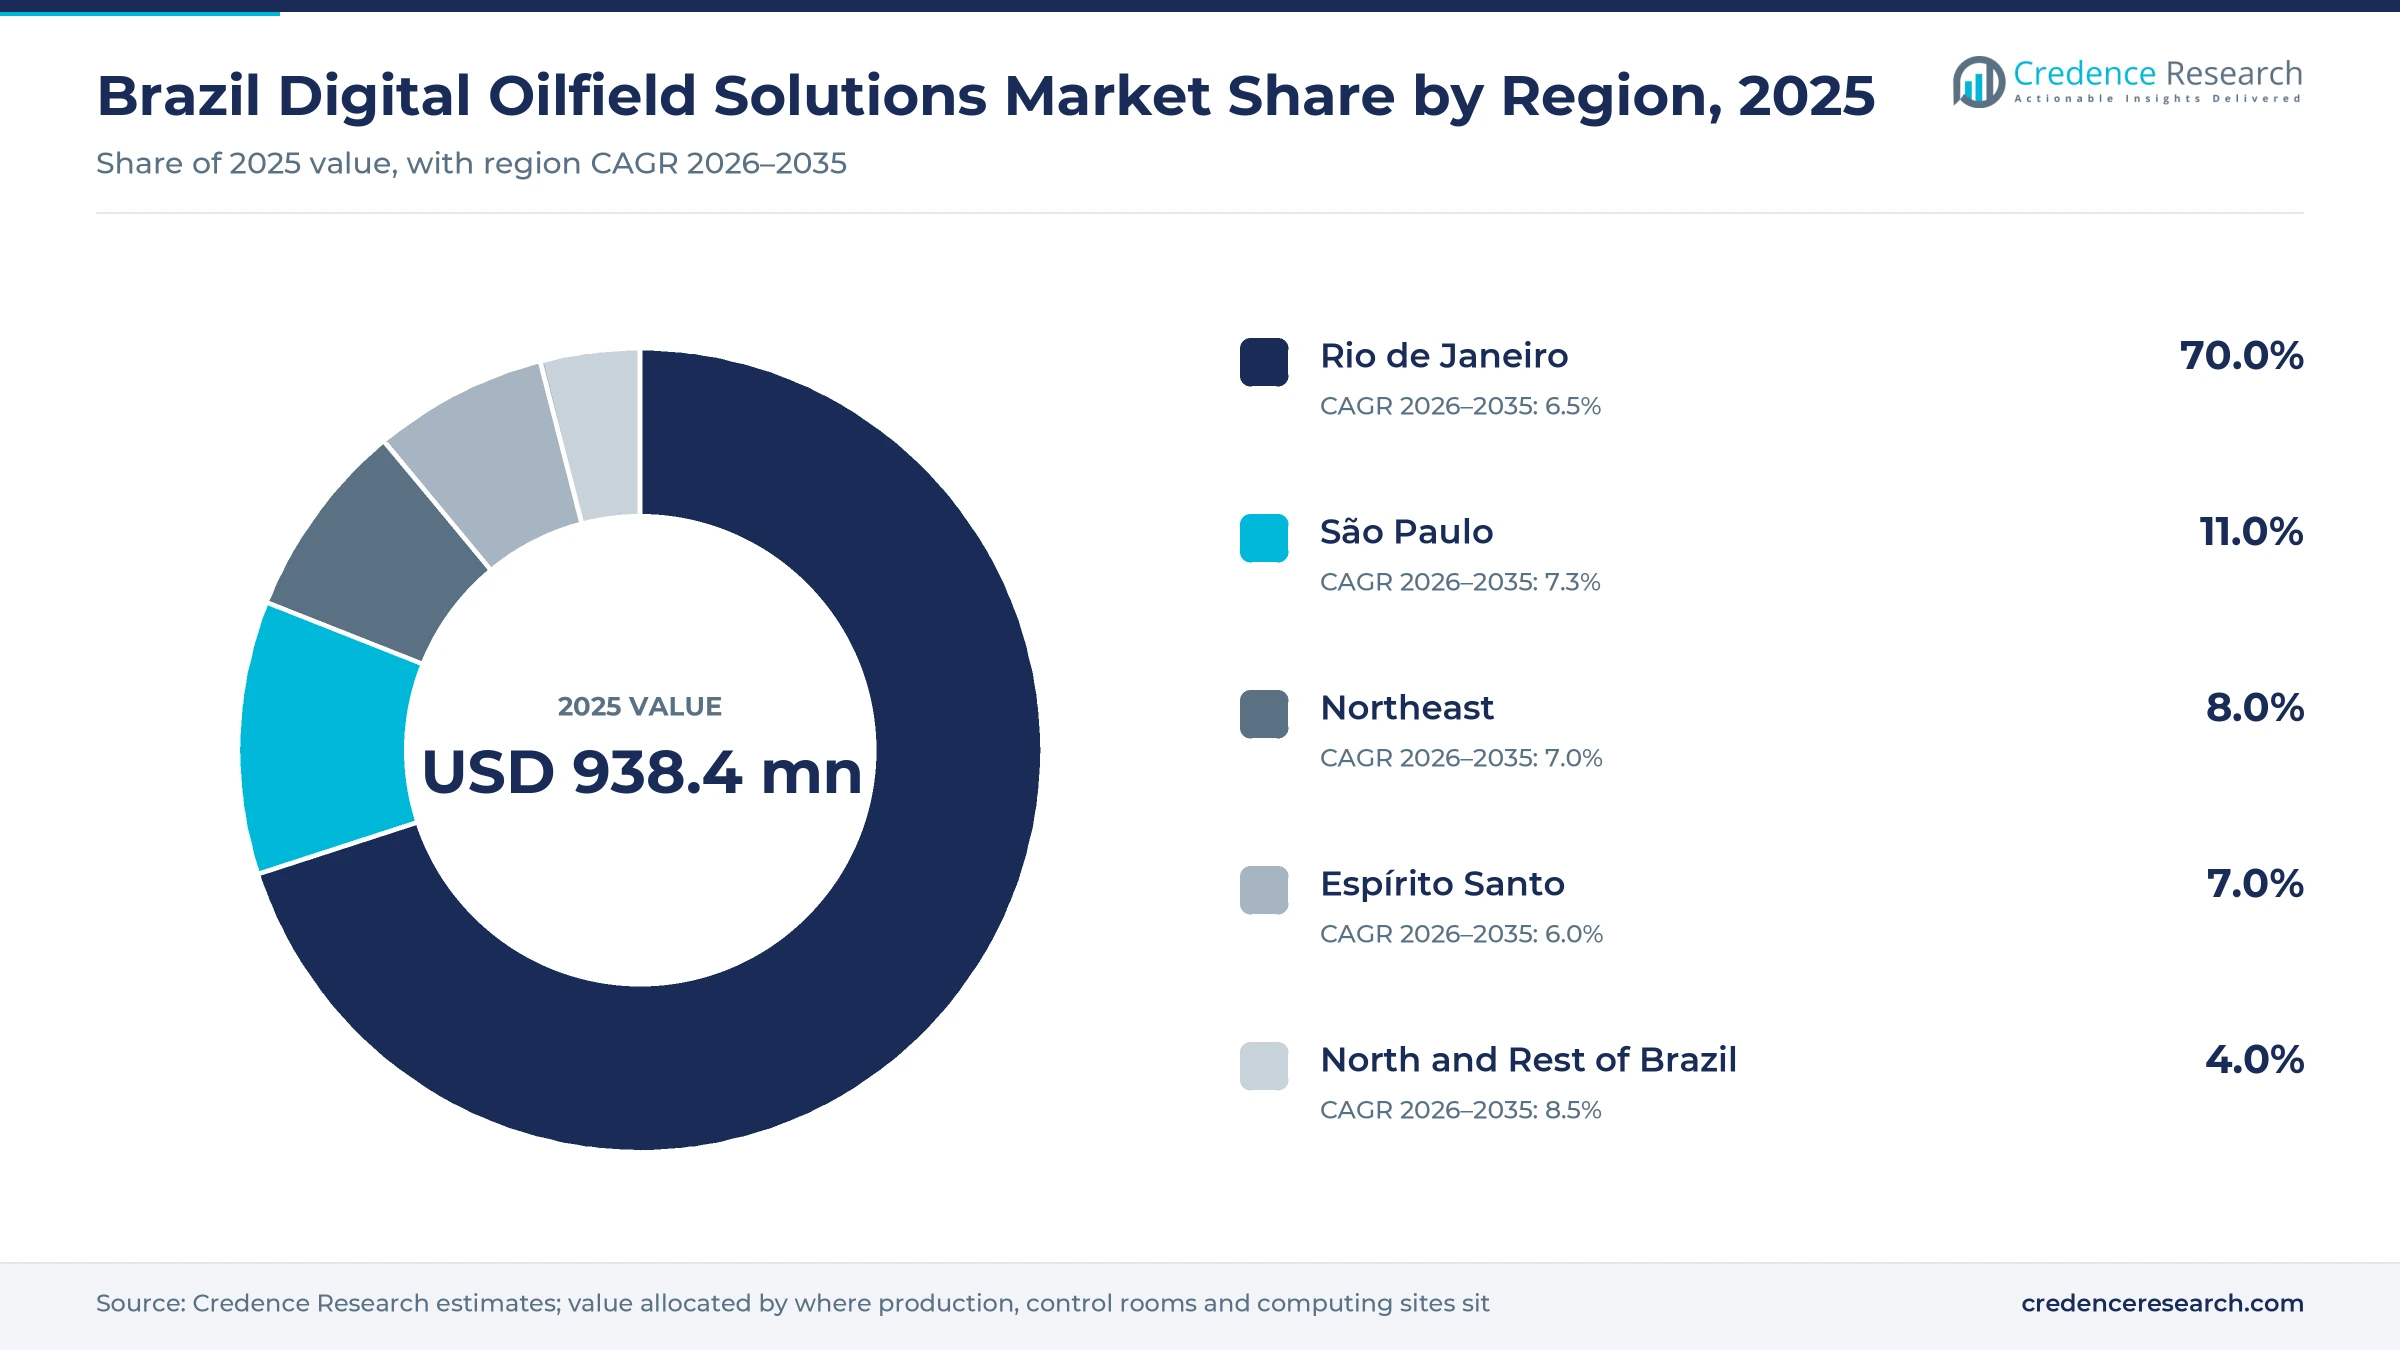
- Rio de Janeiro held 70.0% of 2025 value, because Santos and Campos basin fields, FPSO control rooms and Macaé service bases are concentrated in the state.
- Hardware led with 44.0% of 2025 value, because every new FPSO needs sensors, control cabinets and electrical automation before first oil.
- Brazil produced a record 3.770 million barrels of oil per day in 2025, 12.3% above 2024, according to the national petroleum regulator ANP.
- Petrobras plans eight new production systems by 2030 under its 2026 to 2030 business plan, which sets the main order pipeline for automation suppliers.
Hardware leads as software and reservoir tools gain
Hardware leads while software grows on enterprise platforms
Based on solution, the market is categorized into hardware, software and services. Hardware led with 44.0% of 2025 value because every new FPSO needs sensors, control cabinets and electrical automation before first oil, and ABB said in June 2025 that its order for P-84 and P-85 covers System 800xA substation automation for two 225,000-barrel-a-day vessels. Software grows fastest at 7.8% a year, as Petrobras runs an enterprise-wide, five-year deployment of the SLB Delfi platform, which SLB said cut fault interpretation time by 60% in petrophysical modeling. Software carries higher margins, so vendors push licenses into each hardware award.
Offshore wells lead while onshore hubs digitize fastest
Based on application, the market is categorized into onshore and offshore. Offshore led with 88.0% of 2025 value because just 547 offshore wells carried most national output in December 2025, against 5,501 onshore wells, and onshore fields supplied only 4.92% of 2025 production, ANP data show. Each deepwater well carries permanent gauges, subsea controls and topside monitoring, so spending per well is far higher offshore. Onshore grows fastest at 7.3% a year, as Brava Energia opened an integrated operations center in Candeias, Bahia, in October 2026 that tracks more than 130 wells and 12 stations in real time. Onshore growth starts from a low base of instrumented wells.
Production monitoring leads while reservoir work grows fastest
Based on process, the market is categorized into reservoir optimization, production optimization and drilling optimization. Production Optimization led with 46.0% of 2025 value because operators pay for monitoring on every producing well and pump, and the SLB OneSubsea award for two Búzios seawater injection systems includes AI-enabled Subsea Live condition monitoring, SLB said in December 2024, a model that also extends to subsea boosting fleets. Reservoir Optimization grows fastest at 7.6% a year, as Petrobras put the Harpia supercomputer, rated at about 146 petaflops, into operation in October 2025 to turn raw seismic data into 3D images for reservoir simulation.
On-premises computing leads while cloud workflows grow
Based on deployment, the market is categorized into on-premises and cloud-based. On-Premises led with 63.0% of 2025 value because Petrobras keeps seismic and reservoir computing under its own control, and in May 2026 it put the first phase of a dedicated Elea data center in São Bernardo do Campo into operation, Times Brasil reported. Cloud-Based grows fastest at 7.7% a year, as Petrobras opened a cloud computing competence center with Amazon and Microsoft in September 2021 and uses the cloud-hosted Delfi platform noted above for subsurface work. Latency and data control rules still keep platform control systems on site.
| Segment Group | Leading Sub-segment | Share, 2025 | Fastest-growing Sub-segment | CAGR, 2026–2035 |
|---|---|---|---|---|
| By Solution | Hardware | 44.0% | Software | 7.8% |
| By Application | Offshore | 88.0% | Onshore | 7.3% |
| By Process | Production Optimization | 46.0% | Reservoir Optimization | 7.6% |
| By Deployment | On-Premises | 63.0% | Cloud-Based | 7.7% |
Bundled contracts and per-well fees set digital prices
Digital oilfield work in Brazil is priced in three ways, as capital packages bundled into FPSO and well contracts, as multiyear software subscriptions, and as long-term hosting or service fees. Petrobras rarely discloses the digital share of a contract, so the per-well and per-vessel ranges below are Credence Research estimates with wide error bands. Petrobras does publish some computing costs, which show the scale of its in-house subsurface spending. Exchange rates matter, because most licenses are priced in U.S. dollars while Petrobras budgets in reais, and lower oil prices push buyers toward fees tied to measured gains.
| Offer or input | Typical price or fee | Basis |
|---|---|---|
| Petrobras supercomputer purchase, five Lenovo systems | R$500 million in total | Petrobras, October 2025 |
| Hosting of Petrobras supercomputers at Elea, São Bernardo do Campo | About R$2.3 billion over 17 years | Times Brasil, May 2026 |
| Production optimization and monitoring software, per producing well | USD 1,000 to USD 4,000 per well per month | Credence Research estimate; no public list price |
| FPSO automation and integrated control and safety package | USD 15 million to USD 40 million per vessel | Credence Research estimate from package scope |
| Onshore well telemetry kit with sensors and remote terminal unit | USD 5,000 to USD 20,000 per well | Credence Research estimate; excludes software fees |
Request a Free Sample
Fill in your details and we'll send you a free sample report.
- Sample data tables & charts
- Research methodology
New FPSOs, smart wells and fiber links lift demand
Record pre-salt output widens the instrumented asset base
The producing base in Brazil keeps expanding, and each new unit adds thousands of data points that operators must monitor. Oil output reached a record 3.770 million barrels per day in 2025, 12.3% above 2024, and pre-salt fields supplied 79.63% of oil and gas production, the national petroleum regulator ANP reported. Four FPSOs entered service during 2025, all in the Santos Basin pre-salt, Agência Brasil reported. Equinor started Bacalhau in October 2025 with capacity of 220,000 barrels per day and 19 wells in its first phase. More units mean more control systems, subsea sensors and data feeds, which favors suppliers that can standardize monitoring across fleets run by different consortium partners.
Petrobras capital plan sets the order pipeline to 2030
Petrobras sets the tempo of digital procurement because its projects dominate new capacity, and its five-year plan keeps upstream spending high. The company approved a USD 109 billion business plan for 2026 to 2030 in November 2025, with USD 69.2 billion of exploration and production spending in its implementation portfolio, Petrobras said. The plan adds eight new production systems by 2030, seven of them already contracted, and completes 11 FPSOs at Búzios by 2027. Petrobras expects its own oil output to peak at 2.7 million barrels per day in 2028. Each system arrives with automation, safety and monitoring packages awarded through shipyards, which gives automation vendors a visible pipeline through the end of the decade.
Automated drilling and smart wells enter deepwater contracts
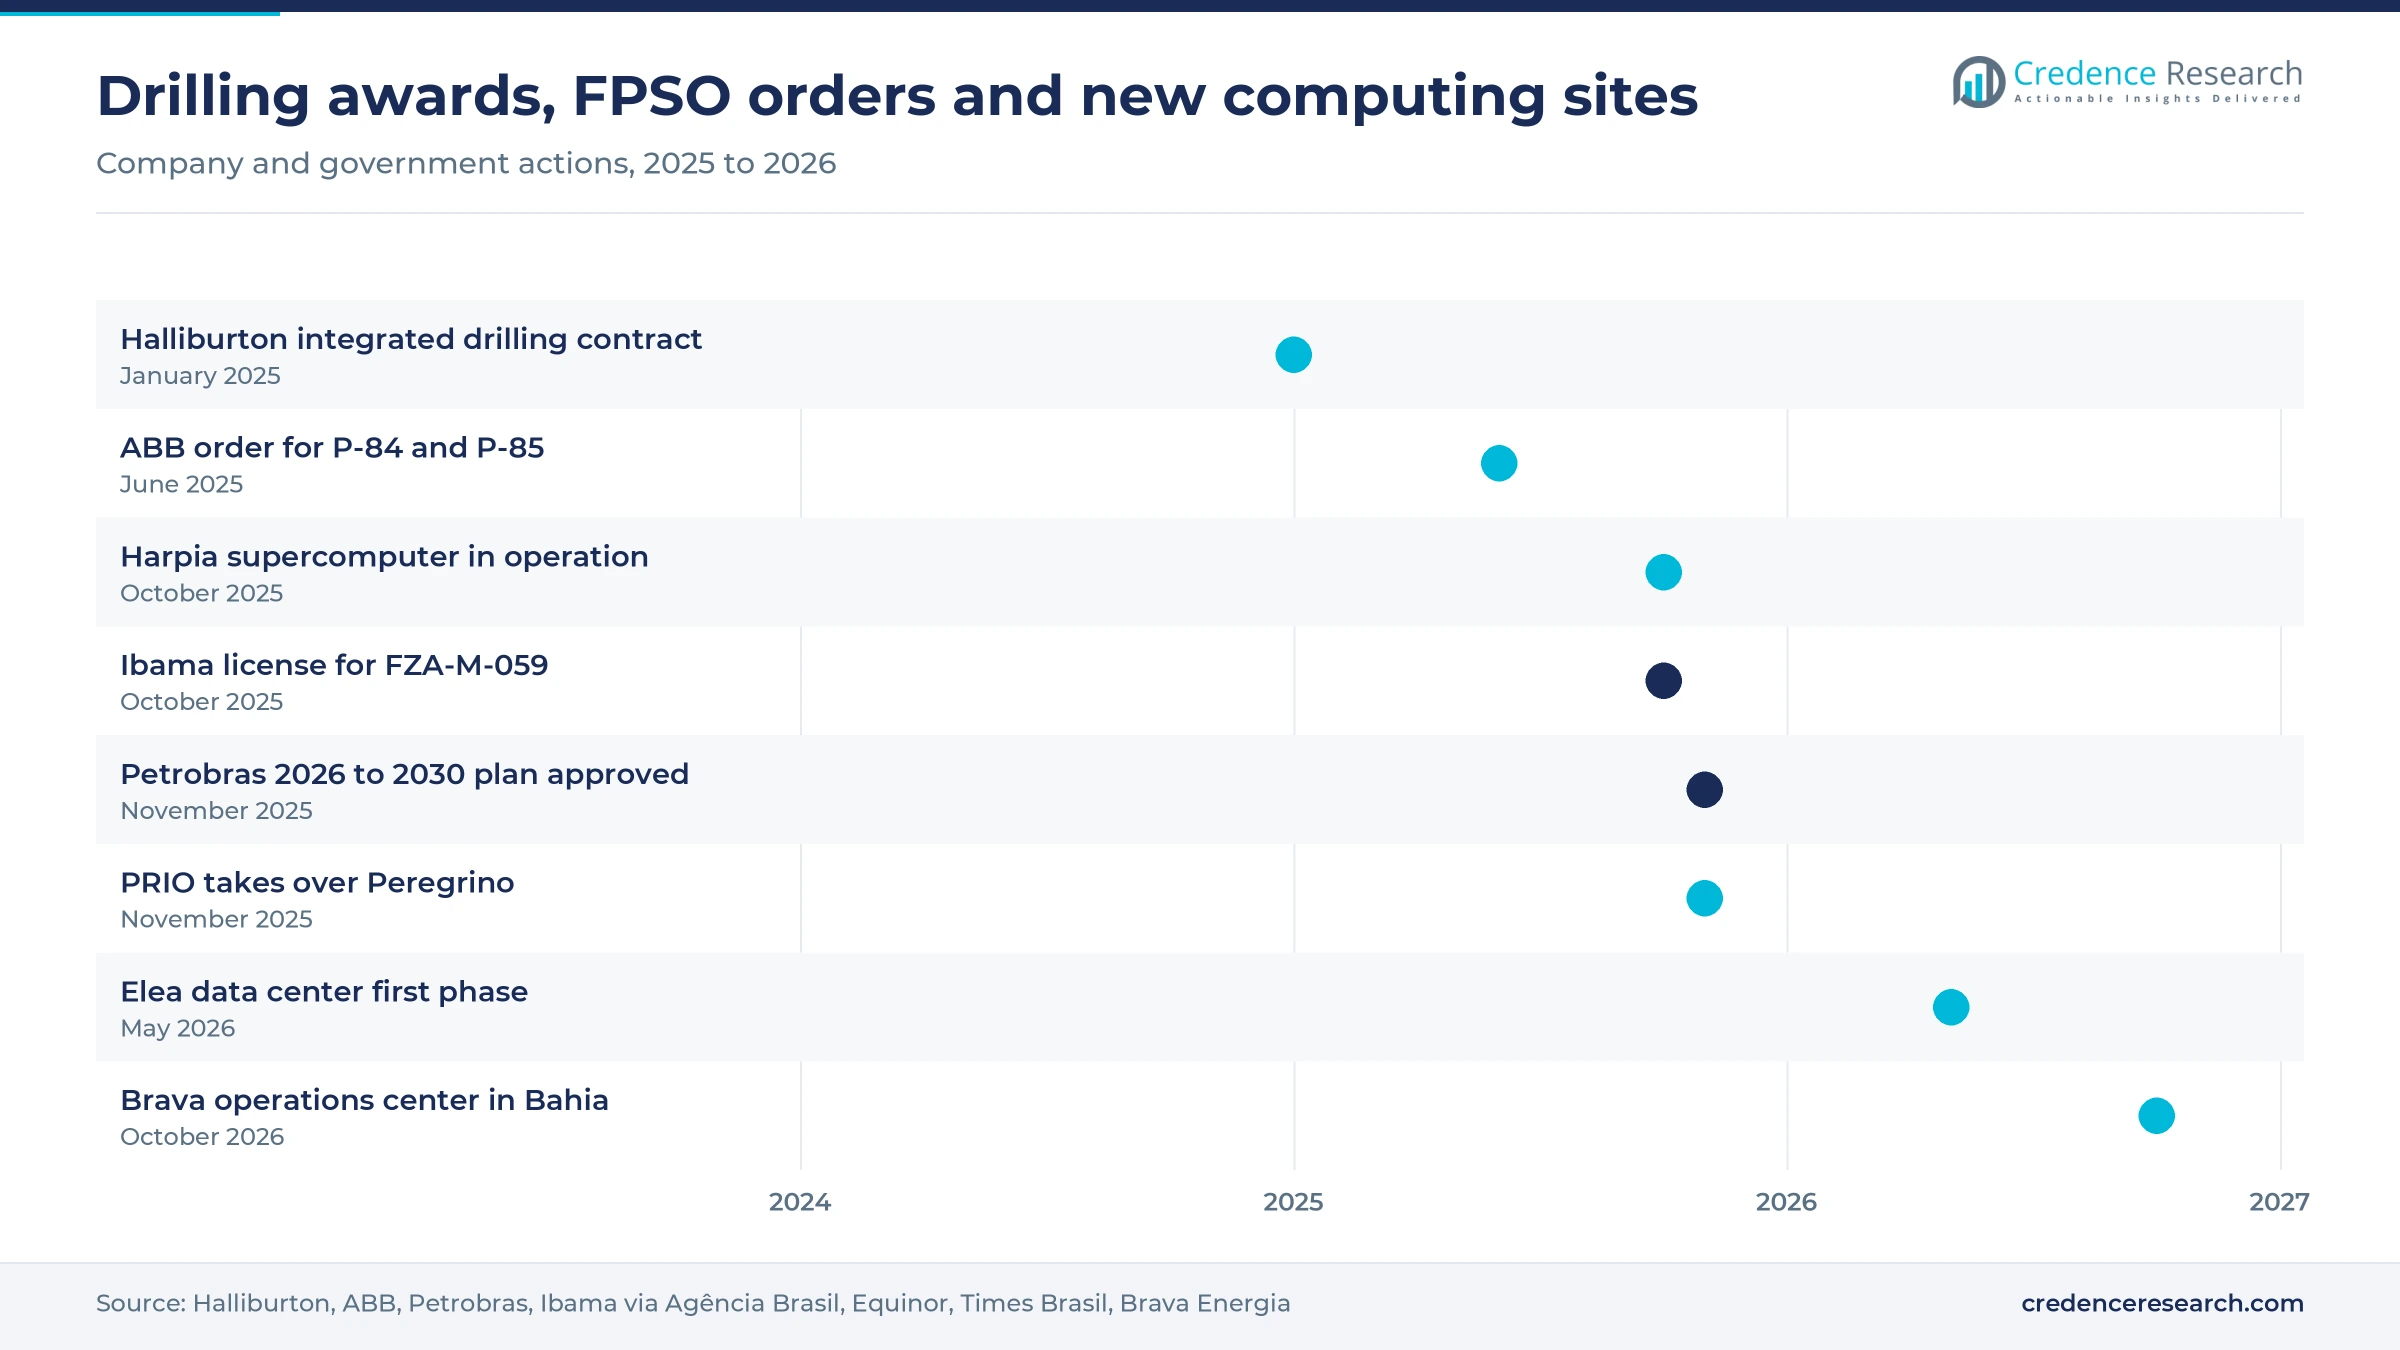
Deepwater wells cost enough that each day saved justifies automation, so Petrobras now writes digital tools into its service tenders. In January 2025, Halliburton said Petrobras awarded it a three-year contract for integrated drilling across several offshore fields, using the LOGIX automation and remote operations platform and the iCruise rotary steerable system. In October 2025, Petrobras also awarded Halliburton SmartWell intelligent completions for Búzios and electric safety valves for Sépia and Atapu, with work starting in 2026. Baker Hughes will supply up to 50 subsea trees with topside control cabinets that monitor subsea equipment from the FPSO. These awards tie software to directional drilling services and completion hardware, which favors integrated suppliers.
Offshore fiber and private LTE make remote operations practical
Remote monitoring needs bandwidth between platforms and shore, and Petrobras has built that link itself. Its subsea fiber program connects 25 production units in the Santos and Campos basins, including about 1,200 km of cable in Santos, BNamericas reported. The fiber feeds a private 4G network planned for 29 platforms, with Nokia antennas and Telefônica Brasil as network provider. Petrobras connectivity staff said in April 2026 that 4G supports the large majority of its applications, Teletime reported, so operators can deploy sensors and mobile tools now rather than wait for 5G. Reliable links let vendors sell cloud analytics and remote support from shore rather than staff each platform.
Twins and remote control rooms reshape operations
Digital twins shift from pilots toward fleet-wide well models
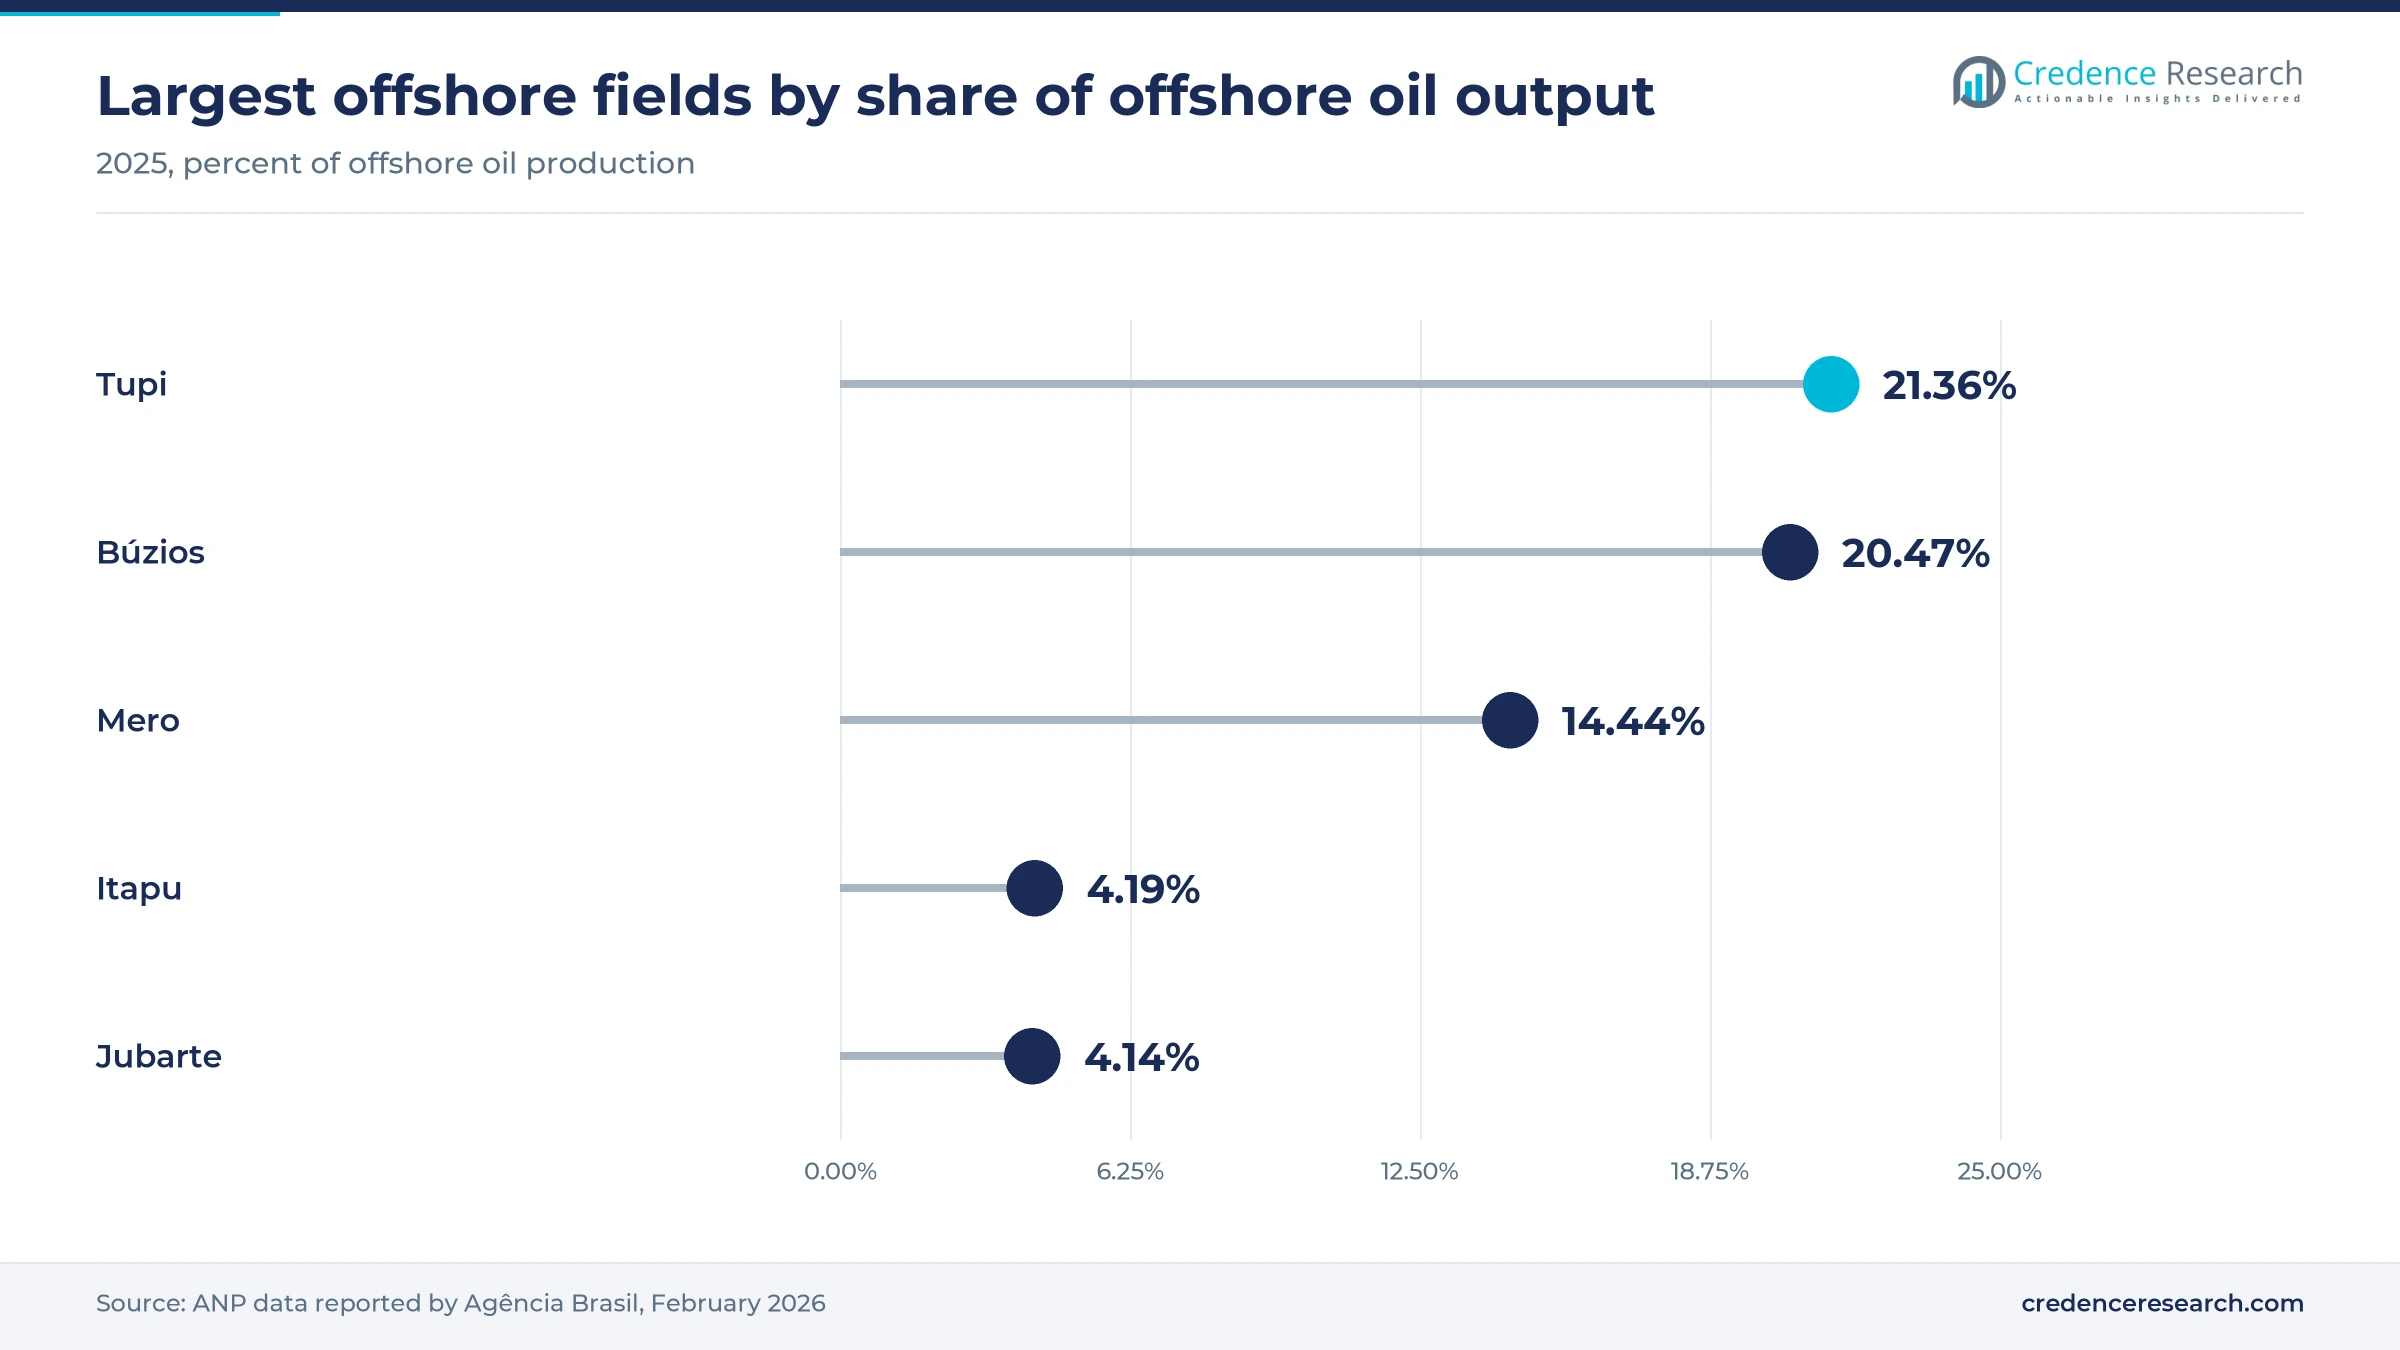
Petrobras is shifting from single-asset pilots toward twins of all offshore wells, which creates steady demand for simulation software and integration services. A twin developed by Florianópolis-based ESSS was tested on the FPSO Cidade de Anchieta and P-57 in the Jubarte field, and Petrobras said in August 2024 that it could raise production by about 1% once extended to all offshore producing and injection wells, Folha de Pernambuco reported. Petrobras bought the tool through a technology order, a contract route for problems with no commercial product. Jubarte supplied 4.14% of offshore oil output in 2025, so even small gains matter. Domestic software houses gain an entry route, while global vendors must match local engineering support.
Remote control rooms onshore replace offshore crews
Operators are shifting supervision of subsea inspection from vessels to onshore control rooms, which raises demand for low-latency links, video analytics and remote operating software. Petrobras ran three remote ROV pilots in 2023, two controlled from Aberdeen and one from Macaé, with round-trip communication under 250 milliseconds and zero operational failures, a Petrobras engineer wrote on the Society of Petroleum Engineers community site in July 2025. The first pilot alone covered eight flowline inspections near P-57 in January 2023, with Fugro, Subsea7 and Oceaneering operating the vehicles across the series. Control was confirmed up to 9.5 km from the platform. Remote control cuts offshore headcount and helicopter trips, so service firms that can certify remote operations under Petrobras rules gain an edge in inspection tenders.
Equatorial Margin exploration opens new subsurface data work
Frontier exploration off the northern coast creates an opening for seismic processing, reservoir modeling and real-time drilling data services in basins with no producing history. Ibama granted Petrobras a license on Oct. 20, 2025, to drill block FZA-M-059 in the Foz do Amazonas basin, 175 km off Amapá, with an initial phase of about five months, Agência Brasil reported. Petrobras said the Harpia system noted above will speed results for Equatorial Margin projects. Frontier wells carry high uncertainty, so operators buy more seismic surveys, pore-pressure prediction and live drilling monitoring per well. Suppliers with Amazon-region logistics and licensing experience are best placed if the first wells find oil.
Mature field buyers create an opening for low-cost monitoring
Independent operators taking over mature fields form a new buyer group for affordable monitoring, automation and production optimization. PRIO took over operatorship of the Campos Basin Peregrino field in November 2025 after Equinor sold its 40% operated stake for USD 2.33 billion, Equinor said. The field has produced about 300 million barrels since 2011, so its new operator needs to lift recovery from ageing wells. Brava Energia runs an integrated operations model at its Potiguar hub in Rio Grande do Norte and has copied it in Bahia, as noted above. These buyers want packaged, lower-cost tools rather than bespoke integration, which opens room for mid-sized vendors and local integrators.
Oil prices, buyer concentration and cyber risk weigh
Lower oil prices squeeze discretionary digital budgets
Petrobras cut its 2026 to 2030 investment plan by 2% in November 2025, when Brent traded near USD 63 a barrel against the USD 83 assumed in the previous plan, Bloomberg Línea reported. Digital projects that do not tie directly to output or safety are the easiest to delay when cash tightens. Software vendors selling enterprise licenses and open-ended pilots are most exposed. Suppliers that price on measured production gains or well-time savings face less risk of cancellation.
Dependence on one dominant buyer concentrates tender risk
Petrobras-operated fields delivered 90.03% of national output in December 2025, the ANP said, so a single buyer's tender calendar decides most supplier volumes. Petrobras buys through formal tenders under Law 13.303 of 2016, the state-company procurement law, which lengthens sales cycles and favors suppliers already qualified on its vendor lists. Smaller software firms are most exposed, because one delayed tender can erase a year of pipeline. Partnerships with qualified integrators and sales to independents reduce this concentration.
Cyber intrusions put subsurface and operations data at risk
The Everest ransomware group claimed in November 2025 that it held Petrobras seismic navigation data from Campos Basin surveys, a claim that remains unverified and on which Petrobras made no public statement, so it signals exposure rather than a proven loss. Wider connectivity across platforms enlarges the attack surface for control and data systems. Operators linking legacy control networks to cloud analytics are most exposed, and stricter network segmentation and monitoring add cost and delay to new digital projects.
Production plateau after 2029 caps new-asset spending
Petrobras expects its own total output to peak at 3.4 million barrels of oil equivalent per day in 2028 and 2029, its business plan says, as the Búzios build-out ends. Once fewer FPSOs arrive each year, hardware and integration awards tied to new units shrink. Automation vendors that depend on newbuild FPSO packages are most exposed after 2029. Brownfield optimization, life extension and decline management then become the main source of orders, which favors software and service suppliers.
Rio de Janeiro leads while the northern frontier grows
| Region | Value, 2025 (USD million) | Share, 2025 | CAGR, 2026–2035 |
|---|---|---|---|
| Rio de Janeiro | 656.9 | 70.0% | 6.5% |
| São Paulo | 103.2 | 11.0% | 7.3% |
| Northeast | 75.1 | 8.0% | 7.0% |
| Espírito Santo | 65.7 | 7.0% | 6.0% |
| North and Rest of Brazil | 37.5 | 4.0% | 8.5% |
Rio de Janeiro leads on pre-salt FPSOs and control rooms
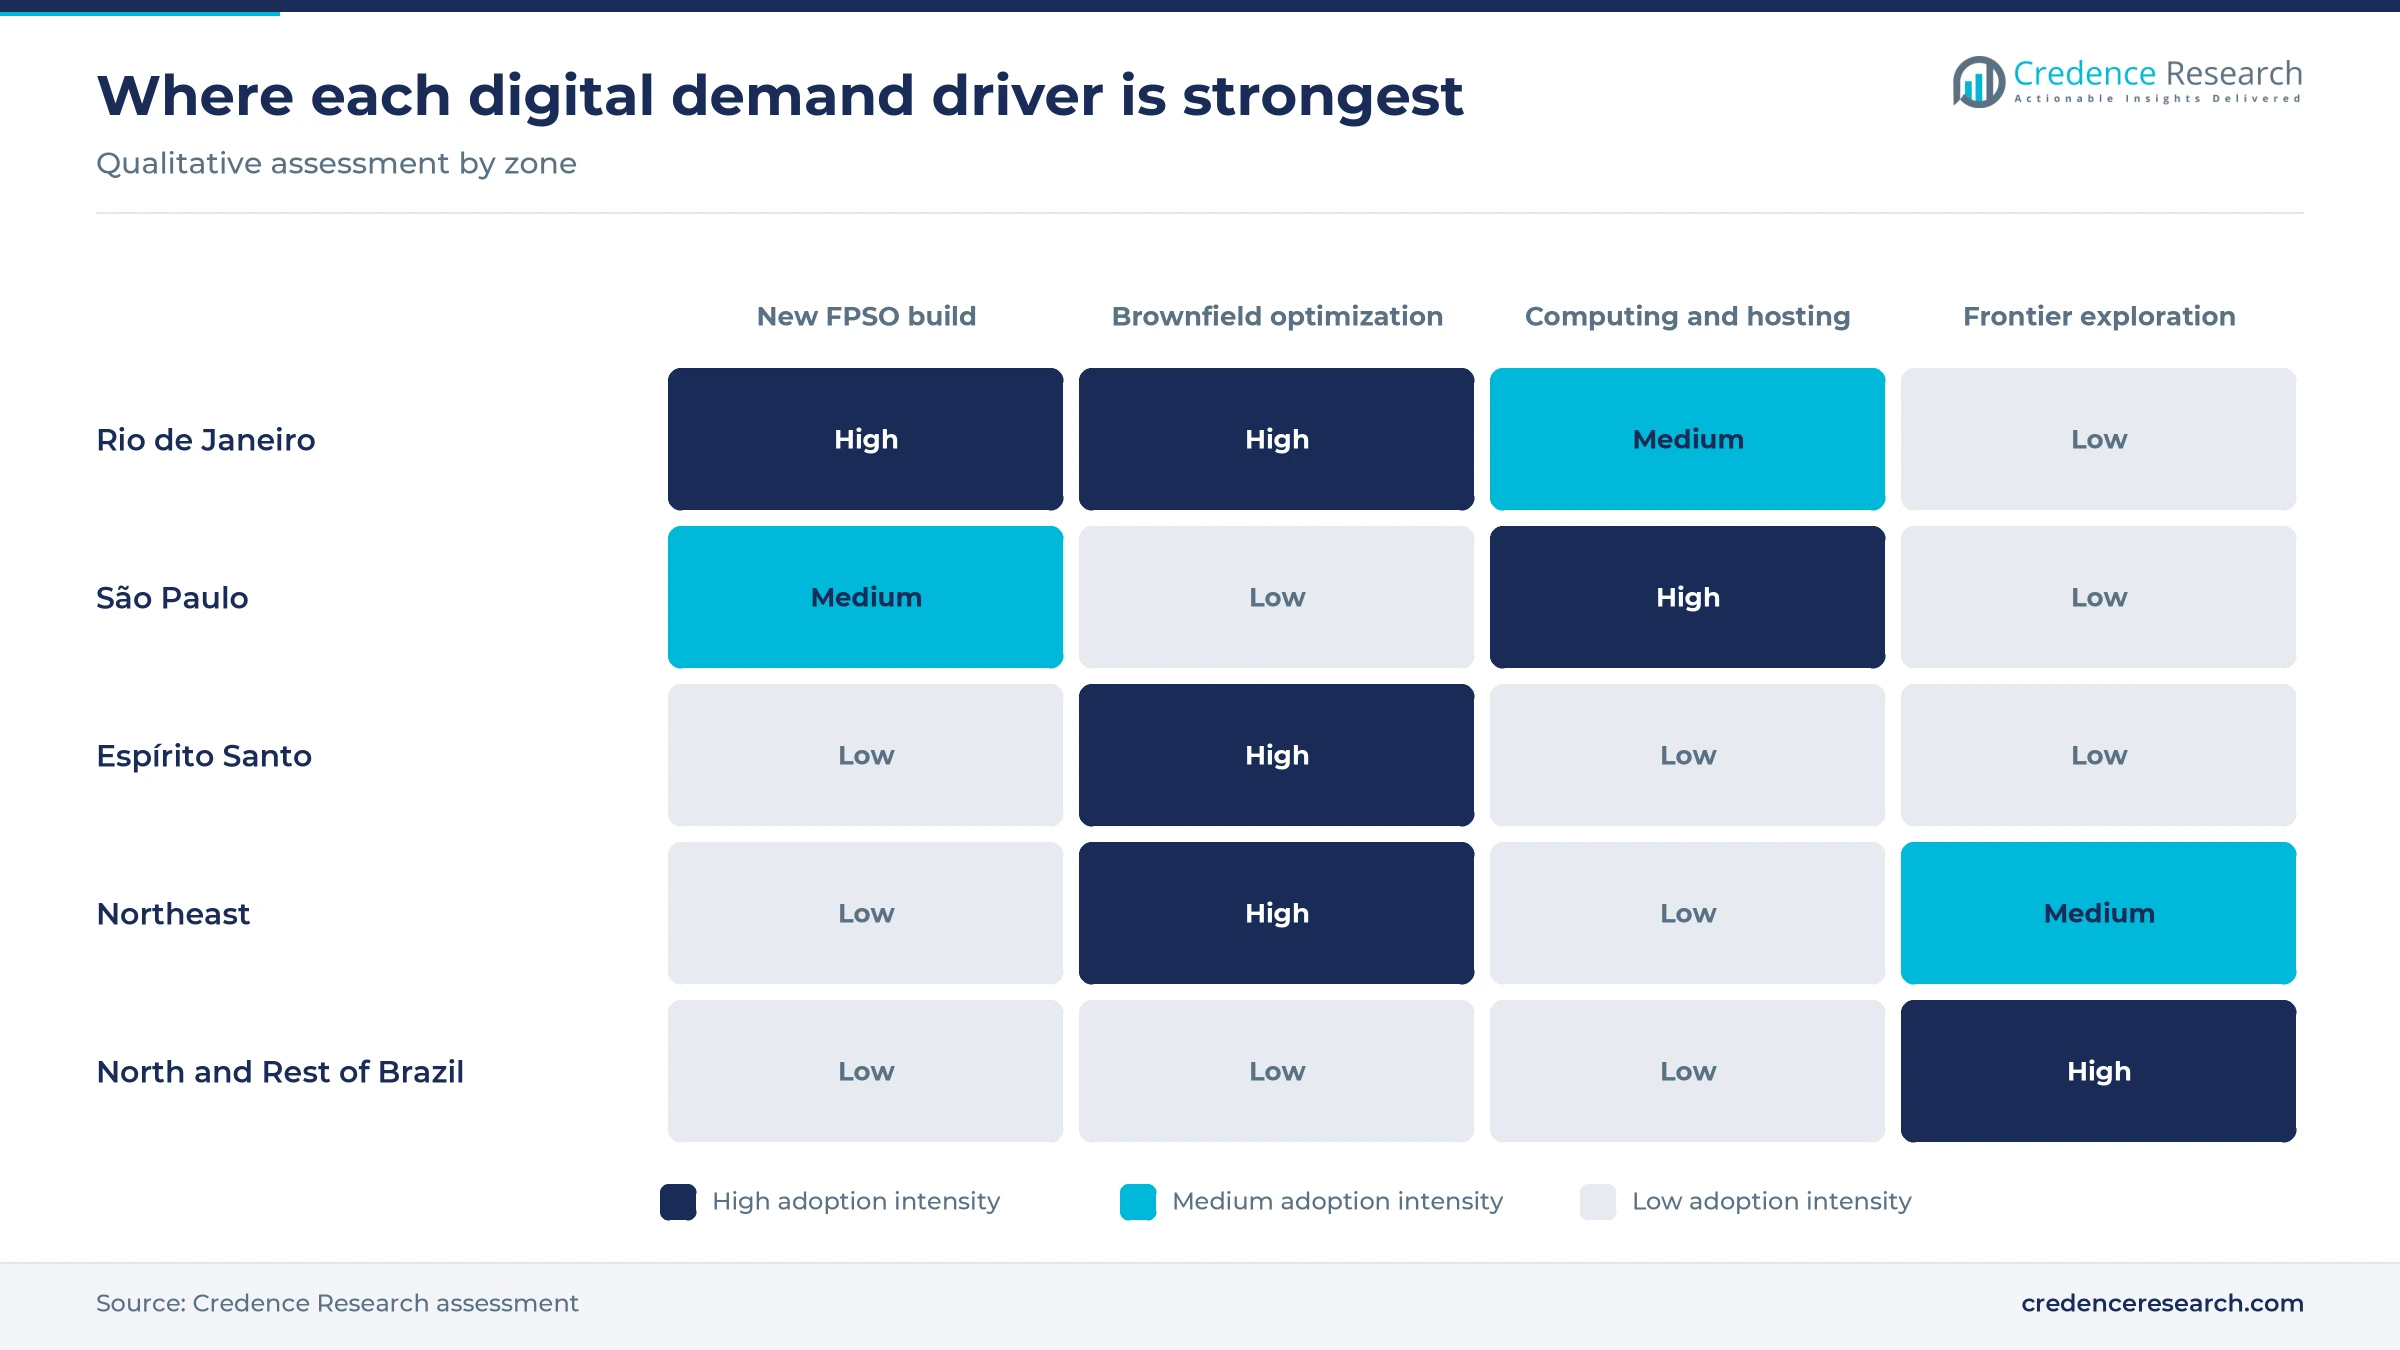
Rio de Janeiro held a regional share of 70.0% in 2025 and grows at 6.5% a year. The state accounted for 87.8% of the oil produced in Brazil in 2025, Agência Brasil reported, which makes the state the operating base for most FPSOs and their control rooms. FPSO Almirante Tamandaré at Búzios was the top oil installation in December 2025 at 238,960 barrels per day, the ANP said. Petrobras engineering centers and Macaé service bases keep integration and remote support work in the state.
São Paulo gains from computing sites and software buyers
São Paulo held a regional share of 11.0% in 2025 and grows at 7.3% a year. The state produced 4.89% of the country's oil in 2025, Agência Brasil reported, yet it draws a larger share of software and hosting spending than its output suggests. The Petrobras computing site in Greater ABC described above hosts seismic and reservoir workloads, and the state concentrates cloud regions, software developers and telecom carriers. Growth comes from hosting, analytics and integration contracts rather than field hardware.
Espírito Santo relies on mature fields that test new tools
Espírito Santo held a regional share of 7.0% in 2025 and grows at 6.0% a year. The state overtook São Paulo in 2025 to become the second-largest oil producer with 5.12% of national output, Agência Brasil reported. Its Jubarte field hosted the Petrobras twin pilots described in the trends section, which makes the state a proving ground for brownfield tools. Ageing post-salt fields slow hardware spending, so growth here rests on optimization software and life-extension monitoring.
Northeast onshore hubs adopt centralized well monitoring
The Northeast held a regional share of 8.0% in 2025 and grows at 7.0% a year. Brava Energia runs mature onshore fields in Rio Grande do Norte and Bahia, and its operations centers noted above show how independents centralize well, station and logistics data. Spending per well is low, so demand in the zone favors telemetry kits, hosted dashboards and shared operations centers over bespoke control systems. Suppliers with field crews near Candeias and the Potiguar hub gain, because onshore buyers expect fast local service.
North and rest of Brazil grows fastest on frontier exploration
The North and the rest of Brazil held a regional share of 4.0% in 2025 and grow at 8.5% a year, the fastest of the five zones. Frontier drilling off Amapá, licensed in October 2025 and described in the trends section, brings new demand for seismic processing, drilling data and remote support far from existing service bases. Long distances and limited infrastructure raise service costs, so suppliers that combine remote operations with local logistics gain most if exploration succeeds.
Drilling awards, FPSO orders and new computing sites
| Development | Status and market relevance |
|---|---|
| In January 2025, Petrobras awarded Halliburton a three-year integrated drilling contract for offshore fields using LOGIX automation and iCruise steering. | Contract awarded; work began in 2025. |
| In June 2025, Seatrium awarded ABB the electrical and automation package for Petrobras FPSOs P-84 and P-85. | Order placed; ABB builds topside systems in Singapore and switchboards in Sorocaba. |
| In October 2025, Petrobras put the Harpia supercomputer into operation for seismic processing and reservoir work. | Operational launch; Harpia replaces three older Petrobras HPC systems. |
| In November 2025, PRIO took over operatorship of Peregrino after Equinor closed the sale of its operated stake. | Transaction completed; a further stake sale awaits conditions precedent. |
| In May 2026, Petrobras put the first phase of its Elea-built data center in São Bernardo do Campo into operation. | First phase operational; capacity expands in stages as demand grows. |
Smart wells, drilling automation and seismic imaging
- Downhole valves and gauges let pre-salt producers control each zone of a well from the surface, the core of intelligent completion designs.
- Drilling automation and rotary steerable tools adjust trajectory and drilling parameters in real time, which shortens well time in deep pre-salt sections.
- Subsea condition monitoring tracks pumps, trees and flowlines from shore, which lets operators plan interventions before failures stop production.
- High-performance seismic imaging turns raw survey data into 3D subsurface images, which sharpens reservoir models and well placement.
Need a Custom Version of This Report?
Tailor the scope, geography, or segments to your exact requirements.
- Custom geography or segment scope
- Direct access to our analyst team
Service majors bundle software into well contracts
Competition in the Brazil digital oilfield solutions market is led by integrated service companies that bundle software into well and subsea work. SLB pairs its Delfi platform with OneSubsea equipment and monitoring, while Halliburton sells drilling automation and SmartWell completions under Petrobras contracts. Baker Hughes supplies subsea trees with topside controls, and Weatherford pairs well intervention with its Centro well construction optimization platform. ABB and Rockwell Automation win FPSO electrical, control and safety packages through shipyards, competing with other global control system vendors. ESSS shows that local software houses can win twin projects, and Microsoft supports Petrobras cloud work. Buyers judge suppliers on Petrobras qualification, in-country engineering crews, integration with existing control systems and proven results in pre-salt conditions. Price pressure is strongest in large Petrobras tenders, while independents value packaged tools and fast deployment.
How is the supply side organized?
The supply side serving Brazilian operators runs in three distinct tiers. Integrated service companies, led by SLB, Halliburton, Baker Hughes and Weatherford, sell automation, intelligent completions and real-time services inside multiyear well and subsea contracts. Automation and control vendors, led by ABB and Rockwell Automation with its Sensia joint venture, reach Petrobras mostly through FPSO yards such as Seatrium and Saipem. Software houses and cloud providers, from ESSS in Florianópolis to Microsoft, compete for subsurface and analytics work. Entry barriers sit in Petrobras vendor qualification and in-country support, while margins sit in software licenses and long-term service.
Automation, software and service suppliers buyers in Brazil shortlist
| Company | Type | Role in the market |
|---|---|---|
| SLB | Integrated service company | Sells Delfi software, OneSubsea systems and Subsea Live monitoring to Petrobras |
| Halliburton | Integrated service company | Provides automated drilling, SmartWell completions and real-time services offshore Brazil |
| Baker Hughes | Integrated service company | Supplies subsea trees with topside control cabinets and completion services |
| ABB | Automation supplier | Supplies FPSO electrical systems and System 800xA substation automation |
| Rockwell Automation | Automation supplier | Supplied automation and integrated control and safety systems for Petrobras FPSOs |
| Weatherford International | Well services provider | Runs Petrobras intervention services with its Centro real-time well optimization platform |
| ESSS | Domestic software house | Developed the Petrobras digital twin for offshore wells and platforms |
| Microsoft | Cloud provider | Partner in the Petrobras cloud computing competence center for analytics work |
Value shifts from new FPSOs to brownfield software
Credence Research's view is that value in Brazilian oilfield digitization is shifting from newbuild FPSO packages toward software and services on producing fields. Hardware leads today because Petrobras is still adding units at Búzios and other pre-salt fields, but the build-out slows after 2029. Twins, remote control rooms and production optimization tools then carry growth, as Petrobras and independents try to hold output from ageing wells. Suppliers that price on measured gains, keep engineering crews in Brazil and secure OT networks should gain the most share.
Estimates rest on output, capex and digital intensity
The report uses 2025 as the base year and 2026 to 2035 as the forecast period. The 2025 value carries forward the earlier Credence Research estimate for 2024 at its own growth rate, after a check against national oil and gas output, upstream capital and operating spending, and typical digital spending intensity supported that level. Market values come from the Credence Research model, and the regional, solution, application, process and deployment splits are Credence Research estimates informed by public data. Sources include ANP statistics, Petrobras releases and business plans, company announcements and business publishers. No interviews or surveys were used to build these estimates.
Búzios build-out and the post-2029 plateau set the path
Credence Research expects the market to reach USD 1.80 billion by 2035 as new pre-salt units start up, twins spread across offshore wells and independents digitize mature fields. Growth is strongest before 2030, when Petrobras adds its planned production systems, and then shifts toward software, hosting and remote services. Reservoir optimization and cloud-based deployment add value fastest, as operators run larger seismic and simulation workloads. Oil prices, tender delays and cyber incidents are the main risks to that path.
Oil prices and brownfield uptake set the range
The range to 2035 depends mainly on oil prices, which decide how much Petrobras and independents spend beyond core projects, and on how fast twins and remote operations spread across older fields. New FPSO packages support every case through 2029, because most units are already contracted. A frontier discovery would add exploration data work, while prolonged low prices would push buyers to defer software and integration projects.
| Scenario | CAGR, 2026–2035 | Value, 2035 | What has to hold |
|---|---|---|---|
| Downside | 5.1% | USD 1.57 billion | Brent stays near USD 60 and Petrobras defers software and integration projects |
| Base | 6.72% | USD 1.80 billion | Eight new systems arrive by 2030 and twin rollout reaches most offshore wells |
| Upside | 8.1% | USD 2.02 billion | Equatorial Margin finds oil and independents digitize mature fields quickly |
Frequently Asked Questions
How big is the Brazil digital oilfield solutions market?
How much oil does Brazil produce, and why does it matter here?
How do digital tools fit into oilfield services contracts in Brazil?
Which digital tools support directional drilling in Brazil?
How are subsea systems monitored in Brazilian fields?
Is cloud deployment growing in Brazilian oil and gas?
Which region leads digital oilfield spending in Brazil?
Who are the main suppliers in this market?
Table of Content
Chapter 1 Market Segmentation
- 1.1 Segmentation Framework
- 1.1.1 Product and Service Classification
- 1.1.2 Application and End-Use Classification
- 1.1.3 Technology and Solution Classification
- 1.1.4 Customer and Distribution Channel Classification
- 1.1.5 Geographic Segmentation
- 1.1.6 Market Segment Definitions and Boundaries
- 1.2 By Solution
- 1.2.1 Hardware
- 1.2.2 Software
- 1.2.3 Services
- 1.3 By Application
- 1.3.1 Offshore
- 1.3.2 Onshore
- 1.4 By Process
- 1.4.1 Production Optimization
- 1.4.2 Drilling Optimization
- 1.4.3 Reservoir Optimization
- 1.5 By Deployment
- 1.5.1 On-Premises
- 1.5.2 Cloud-Based
Chapter 2 Introduction
- 2.1 Report Objectives and Scope
- 2.2 Product Definition and Industry Terminology
- 2.3 Market Inclusions and Exclusions
- 2.4 Research Process
- 2.4.1 Primary Research and Expert Interviews
- 2.4.2 Secondary Research and Source Review
- 2.4.3 Top-Down and Bottom-Up Estimation
- 2.4.4 Data Triangulation and Verification
- 2.5 Market Size Measurement Basis
- 2.5.1 2025: USD 938.4 million → 2035: USD 1.80 billion
- 2.6 Historical and Forecast Reference Periods
- 2.6.1 Historical Period: 2018-2025
- 2.6.2 Base Year: 2025
- 2.6.3 Forecast Period: 2025-2035
- 2.7 Research Assumptions and Limitations
Chapter 3 Executive Summary
- 3.1 Market Snapshot and Key Findings
- 3.2 Base-Year Market Size, 2025
- 3.3 Forecast Market Size, 2035
- 3.4 Revenue and Volume Growth Outlook
- 3.5 Key Demand and Supply Indicators
- 3.6 Leading Market Segments
- 3.7 Fastest-Growing Market Opportunities
- 3.8 Regional Performance Highlights
- 3.9 Technology and Industry Transformation
- 3.10 Competitive Landscape Summary
- 3.11 Analyst View and Strategic Implications
Chapter 4 Brazil Digital Oilfield Solutions Market Trends and Developments
- 4.1 Historical Industry Development, 2018-2025
- 4.2 Recent Market Trends and Developments
- 4.3 Demand and Customer Behavior Trends
- 4.4 Technology and Product Innovation
- 4.5 Artificial Intelligence, Automation and Digitalization
- 4.6 Local Manufacturing and Supply Chain Realignment
- 4.7 Industry Partnerships, Mergers and Acquisitions
- 4.8 Sustainability and Circular Economy Developments
- 4.9 Government and Private Sector Investment Trends
- 4.10 Emerging Business Models and Commercialization
- 4.11 Industry Developments and Announcements
Chapter 5 Brazil Digital Oilfield Solutions Market Production, Supply and Demand Analysis
- 5.1 Demand Trend and Consumption Analysis, 2018-2025
- 5.2 Demand Forecast, 2025-2035
- 5.3 Production and Output Trend, 2018-2025
- 5.4 Production and Output Forecast, 2025-2035
- 5.5 Installed Capacity and Capacity Utilization
- 5.6 Company-Wise Production Plants and Statistics
- 5.6.1 Installed Production Capacity
- 5.6.2 Actual Production
- 5.6.3 Planned Capacity and Expansion Targets
- 5.7 Supply Chain Structure and Procurement Trends
- 5.8 Supply-Demand Gap and Bottlenecks
- 5.9 Import Dependence and Sourcing Structure
- 5.10 Contract Manufacturing and Outsourcing
- 5.11 Regional Supply and Demand Concentration
Chapter 6 Brazil Digital Oilfield Solutions Market Pricing Analysis
- 6.1 Pricing Structure and Measurement
- 6.2 Historical Pricing Trends, 2018-2025
- 6.3 Pricing Outlook, 2025-2035
- 6.4 Average Selling Price and Unit Economics
- 6.5 Pricing by Product and Market Segment
- 6.6 Geographic Pricing Differences
- 6.7 Key Input, Energy, Labor and Logistics Costs
- 6.8 Contract Pricing and Purchasing Models
- 6.9 Pricing Sensitivity and Competitive Positioning
- 6.10 Price, Margin and Profitability Implications
Chapter 7 Brazil Digital Oilfield Solutions Market Dynamics
- 7.1 Market Growth Drivers
- 7.1.1 Demand-Side Drivers
- 7.1.2 Technology and Innovation Drivers
- 7.1.3 Infrastructure and Investment Drivers
- 7.1.4 Regulatory and Policy Drivers
- 7.2 Market Restraints
- 7.2.1 Cost and Affordability Constraints
- 7.2.2 Technology and Adoption Barriers
- 7.2.3 Supply Chain and Operational Constraints
- 7.3 Market Challenges
- 7.3.1 Competitive Pressure and Margin Erosion
- 7.3.2 Skills, Infrastructure and Implementation Gaps
- 7.4 Emerging Market Opportunities
- 7.5 Market Dynamics Impact and Time-Horizon Assessment
Chapter 8 Brazil Digital Oilfield Solutions Value Chain Analysis
- 8.1 Industry Value Chain Overview
- 8.2 Upstream Suppliers and Critical Inputs
- 8.3 Technology and Component Providers
- 8.4 Manufacturing or Service Delivery
- 8.5 Distribution, Channel Partners and Integrators
- 8.6 Downstream Applications and End Users
- 8.7 Value Addition and Profit Pools
- 8.8 Vertical Integration and Outsourcing
- 8.9 Supplier Concentration and Risk
- 8.10 Supply Chain Localization and Resilience
Chapter 9 Brazil Digital Oilfield Solutions Market Regulations and Policies
- 9.1 Relevant Laws, Standards and Compliance Frameworks
- 9.2 Product, Service, Safety and Quality Requirements
- 9.3 Government Policies, Incentives and Subsidies
- 9.4 Imports, Exports and Trade Barriers
- 9.5 Public Procurement and Local Content Requirements
- 9.6 Environmental and Sustainability Compliance
- 9.7 Upcoming Policy Changes and Market Implications
Chapter 10 Brazil Digital Oilfield Solutions Market Hotspots and Opportunities
- 10.1 Market Opportunity Mapping and Growth Hotspots
- 10.2 High-Growth Applications and Customer Groups
- 10.3 Underserved Markets and White-Space Opportunities
- 10.4 Emerging Technology and Product Opportunities
- 10.5 New Capacity and Investment Hotspots
- 10.6 Market Entry and Expansion Opportunities
- 10.7 Distribution and Partnership Opportunities
- 10.8 Near-Term and Long-Term Commercial Potential
- 10.9 Opportunity Attractiveness and Execution Risks
Chapter 11 Brazil Digital Oilfield Solutions Market Outlook, 2025-2035
- 11.1 Market Size and Analysis
- 11.1.1 Revenue (Market Measurement: 2025: USD 938.4 million → 2035: USD 1.80 billion)
- 11.1.2 Market Volume and Quantity Sold
- 11.1.3 Historical Market Size, 2018-2025
- 11.1.4 Base-Year Market Size, 2025
- 11.2 Market Forecast, 2025-2035
- 11.2.1 Revenue Forecast to 2035
- 11.2.2 Volume Forecast to 2035
- 11.2.3 CAGR and Year-on-Year Growth
- 11.2.4 Incremental Revenue Opportunity
- 11.3 Forecast Assumptions and Scenario Analysis
- 11.3.1 Base-Case Forecast
- 11.3.2 Optimistic and Conservative Scenarios
- 11.3.3 Technology, Pricing and Policy Sensitivities
- 11.4 Market Attractiveness and Growth Outlook
Chapter 12 Brazil Digital Oilfield Solutions Market Segmentation and Outlook
- 12.1 Segmentation Summary and Market Shares, 2025
- 12.2 Largest and Fastest-Growing Segments
- 12.3 By Solution - Market Size and Forecast, 2025-2035
- 12.3.1 Segment Definition and Scope
- 12.3.2 Historical Market Size, 2018-2025
- 12.3.3 Revenue Forecast, 2025-2035
- 12.3.4 Volume Forecast, 2025-2035
- 12.3.5 Base-Year Market Share, 2025
- 12.3.6 Segment CAGR and Growth Drivers
- 12.3.7 Subsegment Market Size and Forecast
- 12.3.7.1 Hardware
- 12.3.7.2 Software
- 12.3.7.3 Services
- 12.3.8 Subsegment Pricing and Adoption Trends
- 12.3.9 Leading Suppliers and Competition
- 12.3.10 Regional Demand and Opportunities
- 12.4 By Application - Market Size and Forecast, 2025-2035
- 12.4.1 Segment Definition and Scope
- 12.4.2 Historical Market Size, 2018-2025
- 12.4.3 Revenue Forecast, 2025-2035
- 12.4.4 Volume Forecast, 2025-2035
- 12.4.5 Base-Year Market Share, 2025
- 12.4.6 Segment CAGR and Growth Drivers
- 12.4.7 Subsegment Market Size and Forecast
- 12.4.7.1 Offshore
- 12.4.7.2 Onshore
- 12.4.8 Subsegment Pricing and Adoption Trends
- 12.4.9 Leading Suppliers and Competition
- 12.4.10 Regional Demand and Opportunities
- 12.5 By Process - Market Size and Forecast, 2025-2035
- 12.5.1 Segment Definition and Scope
- 12.5.2 Historical Market Size, 2018-2025
- 12.5.3 Revenue Forecast, 2025-2035
- 12.5.4 Volume Forecast, 2025-2035
- 12.5.5 Base-Year Market Share, 2025
- 12.5.6 Segment CAGR and Growth Drivers
- 12.5.7 Subsegment Market Size and Forecast
- 12.5.7.1 Production Optimization
- 12.5.7.2 Drilling Optimization
- 12.5.7.3 Reservoir Optimization
- 12.5.8 Subsegment Pricing and Adoption Trends
- 12.5.9 Leading Suppliers and Competition
- 12.5.10 Regional Demand and Opportunities
- 12.6 By Deployment - Market Size and Forecast, 2025-2035
- 12.6.1 Segment Definition and Scope
- 12.6.2 Historical Market Size, 2018-2025
- 12.6.3 Revenue Forecast, 2025-2035
- 12.6.4 Volume Forecast, 2025-2035
- 12.6.5 Base-Year Market Share, 2025
- 12.6.6 Segment CAGR and Growth Drivers
- 12.6.7 Subsegment Market Size and Forecast
- 12.6.7.1 On-Premises
- 12.6.7.2 Cloud-Based
- 12.6.8 Subsegment Pricing and Adoption Trends
- 12.6.9 Leading Suppliers and Competition
- 12.6.10 Regional Demand and Opportunities
- 12.7 Segment Growth Comparison
- 12.8 Segment Attractiveness and Priority Matrix
Chapter 13 Brazil Digital Oilfield Solutions End-Use and Application Market Outlook
- 13.1 End-Use Industry and Customer Demand Structure
- 13.2 Leading Applications and Customer Groups
- 13.3 End-Use Market Size, Share and Forecast
- 13.4 Major End-Use Industry Deep Dives
- 13.4.1 Customer Requirements and Use Cases
- 13.4.2 Demand and Replacement Cycles
- 13.4.3 Technical and Regulatory Considerations
- 13.4.4 Purchasing and Procurement Models
- 13.4.5 Leading Vendors and Distribution Channels
- 13.4.6 Forecast and Commercial Opportunities
- 13.5 Emerging Applications and Cross-Segment Demand
- 13.6 End-Use Industry Investment Priorities
Chapter 14 Brazil Digital Oilfield Solutions Geographic Market Outlook, 2025-2035
- 14.1 Domestic Market Distribution and Demand Clusters
- 14.2 State- or Province-Wise Market Size and Forecast, 2025-2035
- 14.3 City and Metropolitan Market Outlook
- 14.4 Industrial, Manufacturing and Commercial Clusters
- 14.5 Geographic Concentration of Key End Users
- 14.6 Local Pricing and Purchasing Differences
- 14.7 Domestic Production Facilities and Capacity Map
- 14.8 Local Infrastructure and Project Pipeline
- 14.9 State-Level Policy and Incentive Differences
- 14.10 Subnational Investment Hotspots and Opportunities
- 14.11 Distribution and Logistics Networks
- 14.12 Domestic Competitive Footprint
Chapter 15 Brazil Digital Oilfield Solutions Technology, Innovation and Sustainability Outlook
- 15.1 Technology Landscape and Maturity
- 15.2 Product, Process and Service Innovation
- 15.3 AI, Automation and Digital Tools in the Industry
- 15.4 Technology Adoption and Performance Benchmarking
- 15.5 Innovation Pipeline and R&D Investment
- 15.6 Patent and Intellectual Property Trends
- 15.7 Energy Efficiency and Resource Management
- 15.8 Sustainability, Recycling and Circularity
- 15.9 Technology Roadmap, 2025-2035
- 15.10 Risks of Obsolescence and Technology Substitution
Chapter 16 Brazil Digital Oilfield Solutions Market Key Strategic Imperatives
- 16.1 Growth and Market Entry Priorities
- 16.2 High-Return Products and Segments
- 16.3 Pricing, Profitability and Cost Optimization
- 16.4 Technology Investment and Product Differentiation
- 16.5 Supply Chain Localization and Resilience
- 16.6 Distribution and Customer Acquisition
- 16.7 Partnership, Acquisition and Capacity Strategy
- 16.8 Regional Expansion Priorities
- 16.9 Short-, Medium- and Long-Term Actions
Chapter 17 Competition Outlook
- 17.1 Industry Competition Characteristics
- 17.2 Market Structure and Concentration
- 17.3 Market Share and Competitive Positioning, 2025
- 17.4 Company-Wise Revenue and Product Benchmarking
- 17.5 Production and Service Capacity Benchmarking
- 17.6 Technology, Pricing and Differentiation
- 17.7 Regional Footprint and Distribution Strength
- 17.8 Mergers, Acquisitions and Strategic Alliances
- 17.9 New Entrants and Competitive Threats
- 17.10 Porter's Five Forces and Industry Attractiveness
- 17.11 Competitive Outlook, 2025-2035
Chapter 18 Company Profiles
- 18.1 Company Coverage and Selection Criteria
- 18.2 SLB
- 18.2.1 Business Description
- 18.2.2 Company Ownership and Geographic Presence
- 18.2.3 Product and Service Portfolio
- 18.2.4 Manufacturing and Operating Footprint
- 18.2.5 Production Capacity and Expansion Plans
- 18.2.6 Financial Performance and Investment
- 18.2.7 Market Share and Competitive Position
- 18.2.8 Technology and Innovation Capabilities
- 18.2.9 Strategic Alliances or Partnerships
- 18.2.10 Recent Developments
- 18.2.11 Growth Strategy and Outlook
- 18.3 Halliburton
- 18.4 Baker Hughes
- 18.5 ABB
- 18.6 Rockwell Automation
- 18.7 Weatherford International
- 18.8 ESSS
- 18.9 Microsoft
- 18.10 Other Relevant Market Participants
Note: Every listed company is profiled on the structure shown under the first company. The company list is preliminary and may change based on research findings, market developments, data availability and client requirements.
Chapter 19 Disclaimer
- 19.1 Research and Forecast Disclaimer
- 19.2 Data Source and Estimation Limitations
Note: The depth of individual sections depends on data availability for this market. Volume, capacity, trade and other unit-based metrics are included where applicable.