
| REPORT ATTRIBUTE | DETAILS |
|---|---|
| Historical Period | 2019-2022 |
| Base Year | 2023 |
| Forecast Period | 2024-2032 |
| Building Energy Management Solutions (BEMS) Market Size 2024 | USD 4,705 Million |
| Building Energy Management Solutions (BEMS) Market, CAGR | 12.3% |
| Building Energy Management Solutions (BEMS) Market Size 2032 | USD 11,901.38 Million |
Market Overview:
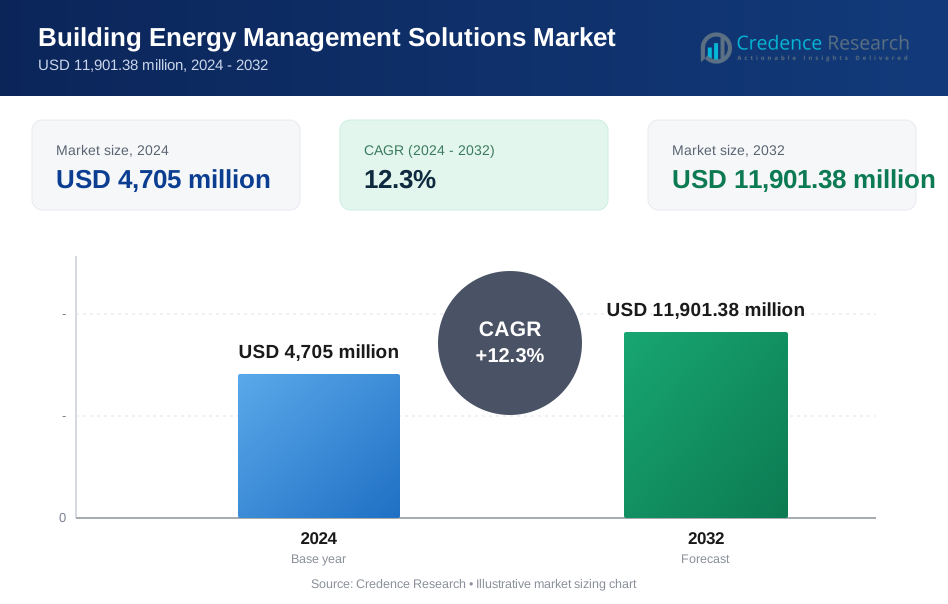
The global Building Energy Management Solutions (BEMS) Market size is projected to grow from USD 4,705 million in 2024 to USD 11,901.38 million by 2032, at a compound annual growth rate (CAGR) of 12.3% during the forecast period.
Key market drivers include the growing focus on reducing carbon footprints, government incentives supporting energy efficiency initiatives, and advancements in AI and IoT technologies. For instance, AI-powered building management systems can reduce energy consumption by up to 30% through intelligent control of HVAC systems. The integration of IoT devices in smart buildings is expected to grow from 1.7 billion units in 2020 to 3 billion units by 2025, facilitating more comprehensive and granular energy management. This growth in IoT adoption is enabling real-time monitoring, predictive maintenance, and automated energy optimization, leading to significant cost savings and improved building performance. Additionally, stringent building codes and regulations, such as the European Union's Energy Performance of Buildings Directive, are prompting organizations to implement energy-efficient solutions, further accelerating market adoption. The U.S. Department of Energy's Better Buildings Initiative has partnered with over 900 organizations, helping them save more than $8.4 billion in energy costs and improve energy efficiency by 20% on average. These initiatives, coupled with increasing awareness of climate change and its environmental impacts, are driving the demand for BEMS that integrate renewable energy sources, smart grids, and energy-efficient technologies.
Regionally, North America holds the largest market share, accounting for approximately 36.7% of the global BEMS market. This dominance is attributed to the region's robust adoption of smart technologies, high levels of commercial infrastructure, and government-led initiatives promoting sustainability. The U.S. Green Building Council reports that LEED-certified buildings consume 25% less energy and 11% less water compared to non-certified buildings, driving the adoption of energy management solutions. Europe follows closely, supported by stringent energy efficiency regulations and a strong push for decarbonization across industries. The Asia-Pacific region is expected to witness the fastest growth, fueled by rapid urbanization, increasing construction of commercial buildings, and rising demand for energy-efficient solutions in countries like China and India. For example, China's 14th Five-Year Plan emphasizes green development and energy efficiency, with targets to reduce energy consumption per unit of GDP by 13.5% over the five-year period. India's Energy Conservation Building Code (ECBC) is projected to lead to energy savings of about 300 billion kWh by 2030 and peak demand reduction of over 15 GW in a year. The Middle East and Africa region is also showing promising growth, with initiatives like the United Arab Emirates' Green Building Regulations and Specifications aiming to reduce energy consumption in buildings by up to 30%, driving the adoption of energy management systems in the region.
Market Insights:
- The market is projected to grow from USD 4,705 million in 2024 to USD 11,901.38 million by 2032, at a CAGR of 3%.
- Increasing adoption of smart technologies in buildings is driving the demand for energy management solutions.
- The rising focus on reducing energy consumption and carbon footprints is fueling market growth.
- AI, ML, and IoT integration in BEMS enables real-time monitoring and predictive analytics for optimized energy use.
- Stringent regulations promoting energy efficiency and sustainability are encouraging the adoption of BEMS.
- North America leads the market, supported by advanced infrastructure and government incentives for energy efficiency.
- The Asia-Pacific region is expected to experience the fastest growth due to rapid urbanization and increasing energy management adoption.
Market Drivers:
Government Regulations and Initiatives:
Stringent regulatory frameworks drive the adoption of building energy management solutions. These systems help ensure compliance with environmental regulations and building energy codes while promoting increased energy efficiency. For instance, the European Union's Energy Performance of Buildings Directive requires all new buildings to be nearly zero-energy buildings (NZEB) by 2021, driving the adoption of advanced energy management systems across the region. The implementation of these solutions has become crucial for meeting minimum energy efficiency standards and avoiding potential penalties across various facility types. For instance, in the United States, the Department of Energy's Better Buildings Initiative has partnered with over 900 organizations, helping them save more than $8.4 billion in energy costs and improve energy efficiency by 20% on average.
Technological Integration:
The integration of IoT and smart technologies revolutionizes building energy management through sophisticated building automation systems. These systems integrate HVAC, lighting, and security into a single monitoring and control platform. For instance, AI-powered building management systems can reduce energy consumption by up to 30% through intelligent control of HVAC systems. Advanced algorithms enable automated fault detection and diagnostics, allowing facility managers to proactively address equipment breakdowns and energy wastage while optimizing performance. For instance, the integration of IoT devices in smart buildings is expected to grow from 1.7 billion units in 2020 to 3 billion units by 2025, facilitating more comprehensive and granular energy management.
Sustainability Goals:
The growing emphasis on environmental sustainability drives market expansion. Smart building technologies, including occupancy sensors and asset performance management systems, facilitate intelligent energy management and continuous optimization of building performance. For instance, buildings and building construction sectors combined are responsible for 36% of global final energy consumption and nearly 40% of total direct and indirect CO2 emissions. These systems enable precise monitoring and control of energy usage through real-time data and feedback, resulting in significant energy savings and improved building energy performance. For instance, a study by the International Energy Agency found that digitalisation of buildings could cut total energy use in residential and commercial buildings between 2017 and 2040 by as much as 10%.
Cost Optimization:
Rising energy costs and operational expenses drive the adoption of energy management solutions. Studies show businesses can save up to almost 40% on average costs over a 12-month period through these systems. For instance, building automation systems integrated with HVAC and lighting control can save nearly 10-20% of total building electricity consumption. The solutions offer built-in cost-saving features such as lower power emission during peak periods and revenue-generating programs, while also identifying potential energy leaks for immediate return on investment. For instance, the U.S. Green Building Council reports that LEED-certified buildings consume 25% less energy and 11% less water compared to non-certified buildings, driving the adoption of energy management solutions.
Market Trends:
AI-Powered Analytics Integration:
The integration of artificial intelligence and machine learning capabilities revolutionizes building energy management. Advanced AI systems now process over 100 million data points daily, enabling real-time optimization of building systems. For instance, a study by the American Council for an Energy-Efficient Economy (ACEEE) found that AI-driven energy management systems can reduce a building's energy consumption by up to 20%. These solutions demonstrate remarkable efficiency improvements, with smart HVAC controllers achieving 24-35% energy savings and automated lighting systems reducing consumption by up to 40% while maintaining optimal comfort levels. For instance, the U.S. Department of Energy reports that AI-powered building management systems can reduce HVAC energy use by up to 30% through predictive maintenance and optimized scheduling.
IoT and Smart Sensor Implementation
The deployment of sophisticated IoT sensors and devices transforms building operations through comprehensive monitoring networks. Modern buildings typically incorporate 500-1,000 sensors per 100,000 square feet of space, providing granular control over various systems. For instance, a report by Navigant Research predicts that the number of connected devices in commercial buildings will reach 483 million units by 2022, up from 194 million in 2015. Advanced sensor networks enable precise environmental control, with smart economizers demonstrating energy savings ranging from 22-90%, averaging 57% reduction in cooling energy consumption. For instance, a case study by the Lawrence Berkeley National Laboratory found that implementing smart sensors and controls in a large office building resulted in a 29% reduction in HVAC energy use.
Cloud-Based Management Solutions:
Cloud platforms are revolutionizing building energy management by processing over 200 billion data points annually across connected buildings. These solutions achieve 99.9% uptime while enabling real-time monitoring and automated documentation. For instance, a study by Verdantix found that cloud-based energy management systems can reduce energy costs by up to 30% in commercial buildings. The integration of cloud-based systems has shown particular effectiveness in large facilities, with buildings exceeding 290 kW achieving energy reductions of 15-30% through automated control strategies. For instance, the GSA's Green Proving Ground program demonstrated that cloud-based analytics platforms could identify energy savings opportunities worth $13 million annually across just 55 buildings in their portfolio.
Renewable Energy Integration:
Building management systems increasingly incorporate renewable energy sources, with solar integration showing 25-35% improvements in overall energy efficiency. For instance, the National Renewable Energy Laboratory (NREL) reports that integrating solar PV with building energy management systems can reduce a commercial building's energy consumption by up to 40%. Smart grid technologies enable participation in demand response programs, reducing peak load demands by up to 40%. A study by the Rocky Mountain Institute found that buildings participating in demand response programs can reduce their peak electricity demand by 10-20%, leading to significant cost savings. These systems contribute to significant environmental benefits, with integrated buildings demonstrating 30-50% lower carbon emissions compared to conventional structures. For instance, the U.S. Green Building Council reports that LEED-certified buildings produce 34% lower carbon emissions compared to the average commercial building.
Market Challenges Analysis:
High Implementation Costs:
The substantial initial investment required for Building Energy Management Systems (BEMS) poses a significant barrier to adoption, particularly for small and medium enterprises. For instance, the deployment of a basic Building Management System costs on average $2.5 to $7 per square meter, which is equal to at least $250,000 for a 100,000 square foot building. The Department of Energy (DOE) and Environmental Protection Agency (EPA) requirements for sophisticated monitoring and control systems further increase implementation costs. Organizations face challenges in balancing the need for advanced features with budget constraints. For instance, a study by the American Council for an Energy-Efficient Economy (ACEEE) found that AI-driven energy management systems can reduce a building's energy consumption by up to 20%, but the high upfront costs often deter smaller businesses from adopting these technologies.
Technical Complexity and Integration:
The Federal Communications Commission (FCC) guidelines on system interoperability present significant challenges for organizations implementing BEMS. The complexity of integrating new technologies with existing infrastructure and ensuring seamless data exchange between different systems creates substantial operational hurdles. For instance, many buildings have legacy HVAC, lighting, and other systems that may use proprietary protocols or communication standards, making it difficult to integrate them seamlessly with BEMS. The shortage of skilled personnel capable of designing, implementing, and maintaining customized BEMS solutions further compounds these challenges. Additionally, the integration process may disrupt normal building operations, leading to downtime and productivity losses, as reported in studies by Abuimara et al. (2021) and Sofos et al. (2020).
Data Security and Privacy Concerns:
The Federal Trade Commission (FTC) and National Institute of Standards and Technology (NIST) impose strict requirements regarding data protection and cybersecurity. The integration of IoT devices and cloud computing creates multiple entry points for potential cyber threats, making systems vulnerable to attacks. For instance, a report by Robert Half Technology found that UK CIOs believe the top three IT risks that face businesses over the next five years will be data breaches, cybersecurity threats, and keeping up with technological advancements. Organizations must ensure robust security measures while maintaining compliance with evolving data protection regulations. For instance, the NIST Cybersecurity Framework provides organizations with a risk-based compilation of guidelines to help them identify, implement, and improve cybersecurity practices. However, implementing these measures can be complex and resource-intensive, particularly for smaller organizations with limited IT capabilities.
Awareness and Adoption Barriers:
The Department of Energy highlights significant challenges in awareness and adoption, particularly among smaller enterprises. For instance, a study by the SIDBI found that only 17% of MSMEs have started with sustainability policies in their organization, while 9% of the companies have not started sustainability operations at all. The lack of understanding about system benefits and potential return on investment creates hesitation in implementation. For instance, a survey by Rimm Sustainability reported that 39% of MSMEs feel that sustainability reporting costs too much, and 60% of companies find it difficult to communicate sustainability's business value, according to Morgan Stanley. Additionally, resistance to new technologies and organizational change, coupled with limited access to technical expertise, impedes widespread adoption of BEMS solutions. This knowledge gap often relegates sustainability initiatives, including BEMS implementation, to the periphery of core business strategies.
Market Opportunities:
The building energy management solutions (BEMS) market presents significant opportunities driven by the increasing demand for energy efficiency across residential, commercial, and industrial sectors. As global awareness of climate change grows, there is a greater push for reducing carbon footprints and optimizing energy use in buildings. Government regulations and incentives promoting sustainability, coupled with rising energy costs, are creating favorable conditions for the adoption of BEMS. These solutions provide building owners and facility managers with tools to reduce operational costs, improve energy efficiency, and comply with stringent environmental regulations, making them essential for modern building management.
Furthermore, the integration of emerging technologies such as artificial intelligence (AI), machine learning (ML), and the Internet of Things (IoT) into BEMS offers an opportunity to enhance system capabilities, enabling predictive analytics, real-time energy optimization, and automation. As smart building infrastructure grows, BEMS can become a crucial part of smart cities and urban developments, offering a broader market for innovative solutions. Additionally, the increasing construction of green buildings and the adoption of renewable energy sources, such as solar and wind power, further drive the demand for advanced energy management solutions. This presents a tremendous opportunity for market players to innovate and expand their product offerings, capturing a significant share of the growing demand for sustainable building solutions.
Market Segmentation Analysis:
By Component
The market includes Hardware, Software, and Services. Hardware components consist of sensors, meters, and controllers that monitor and manage energy consumption. Software solutions provide analytics, visualization, and control platforms to optimize energy use. Services encompass installation, maintenance, and consulting to ensure efficient system operation.
By End User
The market is divided into residential, commercial, and industrial sectors. The commercial sector holds the largest share, driven by the need for energy-efficient office buildings, retail spaces, and hospitality establishments. The industrial sector is also a significant contributor, with manufacturers and factories increasingly adopting BEMS to optimize energy use and reduce operational costs. The residential sector is growing steadily, fueled by increasing consumer interest in smart home technologies and energy-efficient solutions.
Segmentations:
By Component:
- Hardware
- Software
- Sensors
- Actuators
- Controls
- Others
By End User:
- Industrial
- Commercial
- Government
- Residential
- Others
By Region:
- North America
- The U.S.
- Canada
- Mexico
- Europe
- Germany
- France
- The U.K.
- Italy
- Spain
- Rest of Europe
- Asia Pacific
- China
- Japan
- India
- South Korea
- South-east Asia
- Rest of Asia Pacific
- Latin America
- Brazil
- Argentina
- Rest of Latin America
- Middle East & Africa
- GCC Countries
- South Africa
- Rest of the Middle East and Africa
Regional Analysis:
North America
North America dominates the BEMS market, accounting for 40% of the global market share in 2024. The region is a leader in adopting smart building technologies due to a combination of factors, including advanced infrastructure, strong regulatory support for energy efficiency, and a high demand for energy-saving solutions across residential, commercial, and industrial buildings. For instance, the U.S. Department of Energy reports that buildings in the U.S. account for nearly 40% of the nation's total energy consumption, highlighting the critical need for effective BEMS solutions. The United States holds a significant portion of the market, supported by federal and state-level initiatives, including incentives for energy efficiency and green building certifications like LEED. For instance, the U.S. Green Building Council reports that LEED-certified buildings consume 25% less energy and 11% less water compared to non-certified buildings. Canada follows closely, with growing investments in energy-efficient building technologies, particularly in urban centers.
Europe
Europe holds the second-largest market share, contributing 30%. The region is characterized by stringent regulations and a strong commitment to reducing carbon emissions, which has spurred the adoption of BEMS. For instance, the European Union's Energy Performance of Buildings Directive requires all new buildings to be nearly zero-energy buildings (NZEB) by 2021, driving the adoption of advanced energy management systems across the region. Countries like Germany, France, and the UK lead the way, with high demand for energy-efficient buildings and significant investment in smart technologies. For instance, the UK's Green Deal program has helped improve energy efficiency in over 1 million homes since its inception. Europe's growing focus on sustainable urban development and decarbonization is also boosting the market for BEMS solutions.
Asia-Pacific
Asia-Pacific is expected to witness the fastest growth, with a market share of 20% by 2032. Rapid urbanization, industrialization, and the increasing focus on energy-efficient buildings in countries like China, India, and Japan are key drivers. For instance, China's 14th Five-Year Plan (2021-2025) emphasizes green development and energy efficiency, with targets to reduce energy consumption per unit of GDP by 13.5% over the five-year period. Government initiatives aimed at reducing energy consumption, such as China's green building policies, are accelerating market adoption. For instance, India's Energy Conservation Building Code (ECBC) is projected to lead to energy savings of about 300 billion kWh by 2030 and peak demand reduction of over 15 GW in a year. The region's large construction sector and growing middle class further contribute to the increasing demand for energy management solutions.
Latin America and the Middle East & Africa
Latin America and the Middle East & Africa collectively account for 10% of the global market. In Latin America, countries like Brazil and Mexico are embracing energy-efficient building practices due to improving economic conditions and growing environmental awareness. The Middle East & Africa is experiencing slower adoption, but rising investments in infrastructure and a focus on sustainability are expected to drive growth in the coming years. For instance, the United Arab Emirates' Green Building Regulations and Specifications aim to reduce energy consumption in buildings by up to 30%, driving the adoption of energy management systems in the region.
Key Player Analysis:
- Schneider Electric
- Siemens AG
- Johnson Controls International plc
- Honeywell International Inc.
- Trane Technologies plc
- Emerson Electric Co.
- Verdigris Technologies
- BuildingIQ
- Verdigris Technologies
- Verdigris Technologies
Competitive Analysis:
The building energy management solutions (BEMS) market is highly competitive, with several key players dominating the landscape. Major companies such as Schneider Electric, Siemens AG, and Johnson Controls International lead the market by offering comprehensive and innovative solutions that cater to energy efficiency, sustainability, and smart building technologies. For instance, Schneider Electric's EcoStruxure Building Operation platform has demonstrated energy savings of up to 30% in commercial buildings. These companies leverage their extensive R&D capabilities, global presence, and strong partnerships to continuously enhance their product offerings. Emerging players like BuildingIQ and Verdigris Technologies focus on advanced technologies, including AI, IoT, and cloud-based solutions, to provide real-time analytics, predictive insights, and automation in energy management. For example, BuildingIQ's 5i platform has shown to reduce HVAC energy consumption by 10-25% in commercial buildings. As energy efficiency becomes a top priority for businesses and governments, competition intensifies among both established and new players. Strategic acquisitions, collaborations, and technological advancements are key strategies employed by market leaders to maintain their competitive edge and capture new market opportunities. For instance, Johnson Controls' acquisition of EasyIO in 2019 expanded its building automation portfolio. Additionally, regulatory pressures and the demand for sustainable solutions continue to shape the competitive dynamics of the market, with the global green building market expected to reach $433.64 billion by 2024, driving innovation in BEMS.
Recent Developments:
- In October 2024, Schneider Electric announced plans to acquire a 75% stake in U.S.-based Motivair, a specialist in liquid cooling for high-performance computing. This acquisition aims to bolster Schneider's capabilities in efficient cooling solutions essential for modern data centers, driven by the growing demand due to generative AI and large language models like Chat-GPT.
- In July 2024, Johnson Controls agreed to sell its residential and light commercial HVAC business to Bosch for $8.1 billion. This strategic move is part of Johnson Controls' focus on providing commercial building solutions.
- In April 2024, Emerson Electric announced plans to sell its remaining 40% stake in its former climate technologies business to Blackstone for approximately $3.5 billion. This follows Blackstone's acquisition of a 55% stake in May 2023, which valued the unit at $14 billion.
- In April 2024, Schneider Electric announced a collaboration with Crux, a sustainable-finance technology company, and Silfab Solar, a solar-module developer, to purchase production-tax credits. This partnership utilizes a new tax credit swap, facilitated by the Inflation Reduction Act (IRA), which simplifies the transfer of tax credits from non-profitable renewable energy companies to profitable entities. This move increases capital availability for the renewable power industry.
Market Concentration & Characteristics:
The Building Energy Management Solutions (BEMS) market is moderately concentrated, with a few large players dominating the landscape while several emerging companies drive innovation. Major players like Schneider Electric, Siemens AG, Johnson Controls, and Honeywell International hold significant market shares, leveraging extensive R&D investments and global distribution networks to offer comprehensive energy management solutions. These companies focus on delivering energy-efficient, automated, and scalable systems that integrate smart technologies, such as AI and IoT, to meet the increasing demand for sustainable energy solutions. The market is characterized by rapid technological advancements and a growing emphasis on sustainability, with energy optimization becoming a top priority for businesses and governments worldwide. Additionally, regulatory pressure on energy consumption and carbon reduction is encouraging the adoption of BEMS. Emerging players are contributing through niche innovations and specialized solutions, particularly in cloud-based and AI-driven technologies, enhancing overall market diversity.
Report Coverage:
The research report offers an in-depth analysis based on Component, End User, and Region. It details leading market players, providing an overview of their business, product offerings, investments, revenue streams, and key applications. Additionally, the report includes insights into the competitive environment, SWOT analysis, current market trends, as well as the primary drivers and constraints. Furthermore, it discusses various factors that have driven market expansion in recent years. The report also explores market dynamics, regulatory scenarios, and technological advancements that are shaping the industry. It assesses the impact of external factors and global economic changes on market growth. Lastly, it provides strategic recommendations for new entrants and established companies to navigate the complexities of the market.
Future Outlook:
- Integration of AI and machine learning will revolutionize building management through predictive analytics, enabling proactive maintenance and automated optimization of energy consumption.
- Advanced IoT sensor networks will expand to incorporate 500-1,000 sensors per 100,000 square feet, providing granular control and real-time monitoring of building systems.
- Cloud-based platforms will process over 200 billion data points annually, enabling centralized access and control across multiple locations while maintaining 99.9% uptime.
- Edge computing implementation will enhance real-time decision-making capabilities and improve system responsiveness by processing data locally.
- Integration of renewable energy sources will optimize energy consumption, with solar integration showing 25-35% improvements in overall energy efficiency.
- Smart grid technologies will enable enhanced demand response programs, reducing peak load demands by up to 40% through automated load management.
- Implementation of occupant-centric design features will create personalized environments that automatically adjust based on individual preferences and real-time data.
- Advanced cybersecurity measures will incorporate enhanced encryption and secure communication protocols to protect against emerging cyber threats.
- Cross-platform compatibility will improve, enabling seamless integration between various building systems and third-party applications.
- Building automation systems will achieve up to 20% reduction in energy consumption through IoT-enabled management systems and smart controls
Request a Free Sample
Fill in your details and we'll send you a free sample report.
- Sample data tables & charts
- Research methodology
Need a Custom Version of This Report?
Tailor the scope, geography, or segments to your exact requirements.
- Custom geography or segment scope
- Direct access to our analyst team
Frequently Asked Questions
What is the current size of the Building Energy Management Solutions Market?
What factors are driving the growth of the Building Energy Management Solutions Market?
What are some challenges faced by the Building Energy Management Solutions Market?
Who are the major players in the Building Energy Management Solutions Market?
Which segment is leading the market share?
Table of Content
Chapter 1. Report Introduction
- 1.1 Report Description & Purpose
- 1.1.1 Report Title & Market Definition
- 1.1.2 Unique Selling Propositions (USP) & Key Differentiators
- 1.1.3 Value Proposition for Stakeholders
- 1.2 Research Objectives
- 1.2.1 Market Sizing Objectives (Volume & Revenue)
- 1.2.2 Segmentation Objectives
- 1.2.3 Competitive Intelligence Objectives
- 1.2.4 Forecast & Scenario Objectives
- 1.3 Report Scope
- 1.3.1 Building Energy Management Solutions Scope – Types & Subtypes Covered
- 1.3.2 Geographic Scope – Regions & Countries Covered
- 1.3.3 Historical Period, Base Year & Forecast Period (2024; forecast to 2032)
- 1.3.4 Inclusions & Exclusions
- 1.4 HS Code & Classification Framework
- 1.5 Currency, Units & Pricing Basis
- 1.6 Target Stakeholders
- 1.7 Limitations & Assumptions
Chapter 2. Executive Summary
- 2.1 Global Building Energy Management Solutions Market Snapshot
- 2.1.1 Market Size – Historical (2024) & Forecast (2024-2032) (2024: USD 4,705 million → 2032: USD 11,901.38 million)
- 2.1.2 Volume & Revenue – Global Totals
- 2.1.3 Key Market Highlights – Top Five Facts
- 2.2 Building Energy Management Solutions Market Segmentation Snapshot
- 2.2.1 Market Split by Region – 2024 vs. 2032
- 2.3 Competitive Snapshot
- 2.3.1 Top 10 Players by Revenue Share – 2024
- 2.3.2 Top 10 Players by Volume Share – 2024
- 2.3.3 Recent Strategic Developments (18-Month Summary)
- 2.4 Key Investment Highlights & Strategic Conclusions
Chapter 3. Building Energy Management Solutions Market Dynamics & Industry Analysis
- 3.1 Market Overview & Context
- 3.1.1 Building Energy Management Solutions Market Position in the Broader Automotive Value Chain
- 3.1.2 OEM vs. Replacement Market Dynamics
- 3.1.3 Market Maturity & Development Stage by Region
- 3.2 Building Energy Management Solutions Market Drivers
- 3.3 Building Energy Management Solutions Market Restraints & Challenges
- 3.4 Building Energy Management Solutions Market Opportunities
- 3.5 Porter's Five Forces Analysis
- 3.5.1 Threat of New Entrants
- 3.5.2 Bargaining Power of Suppliers
- 3.5.3 Bargaining Power of Buyers
- 3.5.4 Threat of Substitutes
- 3.5.5 Competitive Rivalry – Intensity Assessment
- 3.6 Building Energy Management Solutions Value Chain Analysis
- 3.6.1 Upstream – Raw Material/Input Suppliers
- 3.6.1.1 Raw Material/Input 1
- 3.6.1.2 Raw Material/Input 2
- 3.6.1.3 Raw Material/Input 3
- 3.6.2 Midstream – Production/Manufacturing/Service Delivery
- 3.6.2.1 Production/Process Overview
- 3.6.2.2 Key Facility Locations & Capacity by Manufacturer
- 3.6.3 Downstream – Distribution & End Consumer
- 3.6.3.1 Primary Channel – B2B/OEM
- 3.6.3.2 Secondary Channels – Dealer, Retail, Online, Direct
- 3.6.4 Value Chain Profitability Analysis
- 3.6.1 Upstream – Raw Material/Input Suppliers
- 3.7 PESTEL Analysis
- 3.7.1 Political Factors
- 3.7.2 Economic Factors
- 3.7.3 Social Factors
- 3.7.4 Technological Factors
- 3.7.5 Environmental Factors
- 3.7.6 Legal Factors
- 3.8 Building Energy Management Solutions Supply Chain Analysis
- 3.8.1 Raw Material/Input Supply Risk Assessment
- 3.8.2 Manufacturing Concentration Risk (Geographic Exposure)
- 3.8.3 Trade Disruption Impact Analysis
- 3.9 Regulatory & Policy Landscape
Note: The regulatory and policy landscape section covers regulations based on their applicability to the market, Building Energy Management Solutions category, geography, and scope of the study. Only regulatory frameworks with a material impact on operations, compliance, trade, sustainability, or market access are analyzed in detail.
Chapter 4. Key Investment Pockets & Opportunity Analysis
- 4.1 Building Energy Management Solutions Market Attractiveness Analysis
- 4.1.1 By Region – Investment Attractiveness Matrix (Volume × CAGR)
- 4.2 Absolute Revenue Growth Opportunity
- 4.2.1 By Region – Absolute USD Growth Through 2032
- 4.3 Incremental Volume Opportunity
- 4.3.1 By Region – Incremental Volume Through 2032
- 4.3.2 Segment – Incremental Volume
- 4.4 Emerging Submarket Opportunity Deep Dive (Subject to Applicability)
- 4.5 Emerging Market Opportunity Scorecards
- 4.5.1 United States
- 4.5.2 Europe
- 4.5.3 Asia
- 4.5.4 Middle East & Africa
Note: Emerging Market Opportunity Scorecards will be included based on relevance and strategic importance. Regions listed are indicative and may vary depending on data availability and market dynamics.
Chapter 5. Building Energy Management Solutions Import-Export Analysis & Trade Flows
- 5.1 Global Trade Overview
- 5.1.1 Global Export Value by Country (2024)
- 5.1.2 Global Export Volume by Country (2024)
- 5.1.3 Global Import Value by Country (2024)
- 5.1.4 Global Import Volume by Country (2024)
- 5.1.5 Net Trade Balance by Country (2024)
- 5.2 Export Analysis – Segment
- 5.2.1 Type 1 (HS Code)
- 5.2.2 Type 2 (HS Code)
- 5.2.3 Type 3 (HS Code)
- 5.2.4 Type 4 (HS Code)
- 5.2.5 Type 5 (HS Code)
- 5.3 Import Analysis – Segment
- 5.3.1 Type 1 (HS Code)
- 5.3.2 Type 2 (HS Code)
- 5.3.3 Type 3 (HS Code)
- 5.3.4 Type 4 (HS Code)
- 5.3.5 Type 5 (HS Code)
- 5.4 Average Unit Trade Prices
- 5.4.1 Average Export Price – Segment & Country
- 5.4.2 Average Import Price – Segment & Source Country
- 5.4.3 Price Trends (2024)
- 5.5 Key Trade Route Analysis
- 5.5.1 Trade Route 1
- 5.5.2 Trade Route 2
- 5.5.3 Trade Route 3
- 5.5.4 Trade Route 4
- 5.5.5 Trade Route 5
- 5.6 Trade Policy Impact Assessment
- 5.6.1 US Anti-Dumping & Section 301 Tariffs
- 5.6.2 EU Customs Union Impact
- 5.6.3 Major Free Trade Agreements
- 5.6.4 USMCA Rules of Origin
Note: Trade policy analysis will be included only where relevant to the Building Energy Management Solutions market.
Chapter 6. Competitive Landscape & Company Benchmarking
- 6.1 Building Energy Management Solutions Market Concentration & Structure
- 6.1.1 Herfindahl-Hirschman Index (HHI) – vs. 2024
- 6.1.2 Tier 1, Tier 2 & Tier 3 Market Structure
- 6.1.3 Global, Regional & Local Player Dynamics
- 6.2 Building Energy Management Solutions Market Share Analysis – 2024
- 6.2.1 Global Revenue Share by Company
- 6.2.2 Global Volume Share by Company
- 6.2.3 Regional Revenue Share
- 6.2.4 Market Share Evolution ( vs. 2024)
- 6.2.5 OEM Segment Share by Company
- 6.2.6 Replacement Segment Share by Company
- 6.3 Production/Delivery Capacity & Facility Analysis
- 6.3.1 Global Installed Capacity
- 6.3.2 Capacity Utilization Rates
- 6.3.3 Production/Output Volume
- 6.3.4 Facility Locations & Capacity Map
- 6.3.5 Planned Capacity Additions
- 6.4 Building Energy Management Solutions Competitive Benchmarking Matrix
- 6.4.1 Revenue, Volume, CAGR & Profitability Comparison
- 6.4.2 Channel Revenue Mix
- 6.4.3 Geographic Revenue Exposure
- 6.4.4 R&D Intensity
- 6.4.5 Sustainability Maturity
- 6.5 Strategic Developments in Building Energy Management Solutions (Last 24 Months)
- 6.5.1 Mergers, Acquisitions & Divestments
- 6.5.2 New Building Energy Management Solutions Launches
- 6.5.3 Facility Expansions
- 6.5.4 Strategic Alliances, Joint Ventures & Partnerships
- 6.5.5 Distribution Expansion & Market Entry
- 6.5.6 Sustainability & ESG Initiatives
- 6.6 Competitive Strategy Mapping
- 6.6.1 Leader, Challenger, Follower & Niche Classification
- 6.6.2 Pricing Strategy Comparison
- 6.6.3 Channel Strategy Matrix
Note: Strategic developments are included based on their materiality and the availability of reliable information.
Chapter 7. Global Building Energy Management Solutions Market – By Distribution Channel
- 7.1 Segment Overview
- 7.1.1 Volume & Revenue Split by Channel (2024 & 2032)
- 7.1.2 Channel Mix Evolution (2024-2032)
Chapter 8. Regional Market Analysis – Global Overview
- 8.1 Global Regional Overview
- 8.1.1 Regional Volume Share
- 8.1.2 Regional Revenue Share
- 8.1.3 Regional Volume by Region
- 8.1.4 Regional Revenue by Region
- 8.1.5 Regional Forecast Through 2032
- 8.2 Cross-Regional Segment Analysis
- 8.2.1 By Distribution Channel
- 8.2.2 By Brand/Price Tier
Chapter 9. North America Building Energy Management Solutions Market
- 9.1 United States
- 9.2 Canada
- 9.3 Mexico
Chapter 10. Europe Building Energy Management Solutions Market
- 10.1 Germany
- 10.2 France
- 10.3 Italy
- 10.4 United Kingdom
- 10.5 Spain
- 10.6 Poland
- 10.7 Russia
- 10.8 Netherlands
- 10.9 Belgium
- 10.10 Sweden
- 10.11 Denmark
- 10.12 Norway
- 10.13 Rest of Europe
Chapter 11. Asia Pacific Building Energy Management Solutions Market
- 11.1 China
- 11.2 India
- 11.3 Japan
- 11.4 South Korea
- 11.5 Thailand
- 11.6 Indonesia
- 11.7 Vietnam
- 11.8 Malaysia
- 11.9 Australia
- 11.10 Rest of Asia Pacific
Chapter 12. Latin America Building Energy Management Solutions Market
- 12.1 Brazil
- 12.2 Argentina
- 12.3 Colombia
- 12.4 Chile
- 12.5 Rest of Latin America
Chapter 13. Middle East Building Energy Management Solutions Market
- 13.1 Saudi Arabia
- 13.2 United Arab Emirates
- 13.3 Turkey
- 13.4 Israel
- 13.5 Iran
- 13.6 Rest of the Middle East
Chapter 14. Africa Building Energy Management Solutions Market
- 14.1 South Africa
- 14.2 Egypt
- 14.3 Nigeria
- 14.4 Morocco
- 14.5 Rest of Africa
Chapter 15. Building Energy Management Solutions Company Profiles
- 15.1 [Company 01]
- 15.1.1 Company Overview
- 15.1.2 Key Management Personnel
- 15.1.3 Products & Services Portfolio
- 15.1.4 Financial Performance
- 15.1.5 Key Market Focus & Geographic Presence
- 15.1.6 Recent Developments & Strategic Initiatives
Note: The company profile list is preliminary and may change based on research findings, market developments, data availability, and client requirements.
Chapter 16. Appendices
- Appendix A – List of Abbreviations & Acronyms
- Appendix B – Industry Classification Code Reference – Full Series
- Appendix C – Production & Capacity Data Tables
- Appendix D – End-Use & Demand Base Tables
- Appendix E – Consumption & Replacement Rate Assumptions
- Appendix F – ASP Reference Tables
- Appendix G – Manufacturing & Facility Database
- Appendix H – Import-Export Data Tables
- Appendix I – Regulatory Summary Tables
- Appendix J – Primary Research Participant List (Anonymized)
- Appendix K – Primary Research Questionnaire Framework
- Appendix L – Data Sources & Bibliography
- Appendix M – Market Size Divergence & Source Comparison
Chapter 17. Research Methodology
- 17.1 Research Framework & Philosophy
- 17.2 Secondary Research – Sources, Hierarchy & Data Extraction
- 17.3 Data Modeling – Bottom-Up & Top-Down Market Sizing
- 17.4 Primary Research – Stakeholder Framework, LOI & Sample Sizes
- 17.5 Forecast Methodology – Regression, Scenario & Sensitivity Analysis
- 17.6 Quality Control – Four-Layer Validation Framework
- 17.7 Limitations & Standard Assumptions
- 17.8 Disclaimer
