Market Overview:
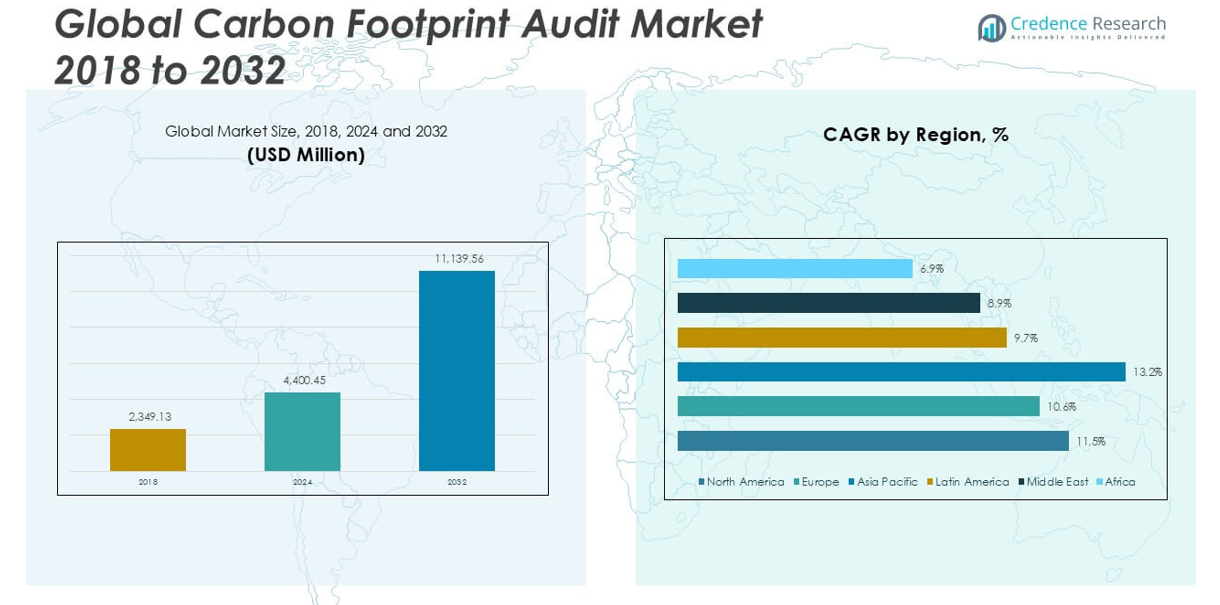
The Carbon Footprint Audit market size was valued at USD 2,349.13 million in 2018, reached USD 4,400.45 million in 2024, and is anticipated to reach USD 11,139.56 million by 2032, growing at a CAGR of 11.47% during the forecast period.
| REPORT ATTRIBUTE |
DETAILS |
| Historical Period |
2020-2023 |
| Base Year |
2024 |
| Forecast Period |
2025-2032 |
| Carbon Footprint Audit Market Size 2024 |
USD 4,400.45 million |
| Carbon Footprint Audit Market, CAGR |
11.47% |
| Carbon Footprint Audit Market Size 2032 |
USD 11,139.56 million |
The Carbon Footprint Audit market is led by key players such as SAP SE, IBM Corporation, Schneider Electric, Carbon Trust, SGS SA, Bureau Veritas, DEKRA SE, Intertek Group plc, TÜV SÜD AG, and Enviance. These companies dominate through robust service portfolios, technological innovation, and strong global presence. They offer comprehensive solutions encompassing carbon footprint calculation, verification, and consulting services tailored to diverse industry needs. Regionally, North America holds the largest market share at 43.0% in 2024, driven by stringent environmental regulations and early adoption of ESG compliance frameworks. Europe follows with a 27.7% share, supported by progressive sustainability policies and corporate carbon reduction initiatives.
Market Insights
- The Carbon Footprint Audit market was valued at USD 2,349.13 million in 2018, reached USD 4,400.45 million in 2024, and is expected to reach USD 11,139.56 million by 2032, growing at a CAGR of 11.47% during the forecast period.
- Growth is primarily driven by increasing regulatory mandates on carbon disclosure, rising global sustainability commitments, and corporate net-zero targets across manufacturing, energy, and logistics sectors.
- A key trend is the integration of audit platforms with ESG reporting systems and cloud-based deployment models, enhancing scalability and accuracy while driving demand from SMEs.
- The market is moderately consolidated, with players like SAP SE, IBM, Schneider Electric, and SGS SA leading through advanced digital solutions and global service coverage; Carbon Footprint Auditing holds the largest service type share in 2024.
- Regionally, North America dominates with a 43.0% share, followed by Europe (27.7%) and Asia Pacific (21.2%); high implementation costs remain a key barrier for SMEs.
Access crucial information at unmatched prices!
Request your sample report today & start making informed decisions powered by Credence Research Inc.!
Download Sample
Market Segmentation Analysis:
By Service Type
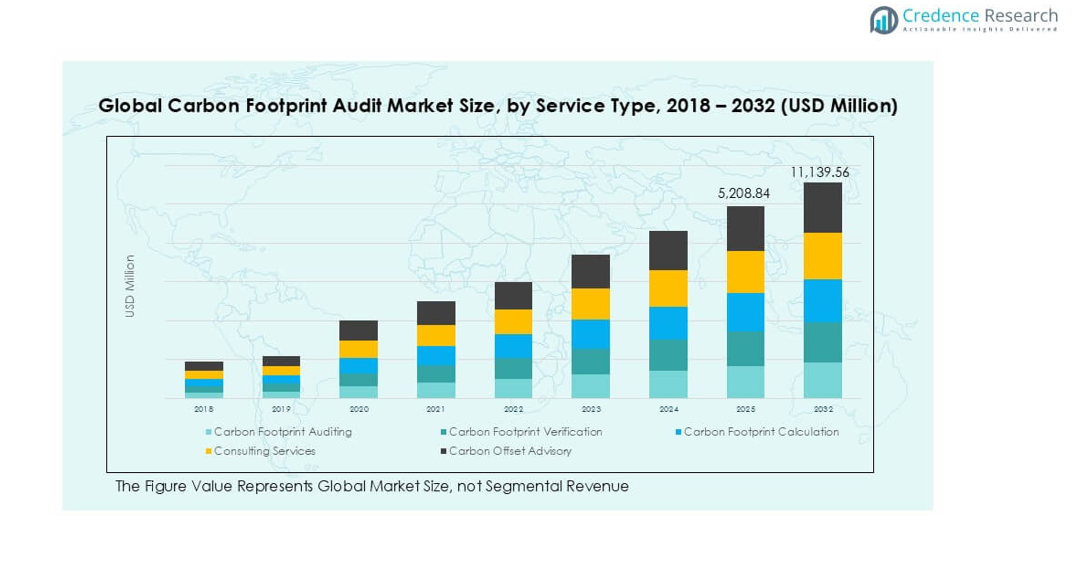
The Carbon Footprint Audit market, when segmented by service type, is led by Carbon Footprint Auditing, accounting for the largest market share in 2024. This dominance stems from increasing regulatory pressures on companies to assess and disclose their environmental impact, especially in emission-intensive industries. Carbon Footprint Calculation and Verification services are also gaining traction due to growing demand for standardized and transparent reporting frameworks such as the GHG Protocol and ISO 14064. Consulting Services and Carbon Offset Advisory are expanding steadily, driven by corporate net-zero goals and the need for expert guidance in emission reduction strategies.
- For instance, Schneider Electric has conducted over 1,300 carbon audits globally and helped clients identify more than 128 million metric tons of CO₂e emissions across their operations.
By Deployment Mode
In terms of deployment, Cloud-Based Solutions dominate the market, holding a substantial share in 2024. Their rapid adoption is fueled by the scalability, real-time data access, and lower operational costs they offer. As organizations increasingly focus on digital transformation and sustainability tracking, cloud platforms provide seamless integration with data sources and analytics tools. On-premises solutions, while still relevant in sectors with strict data control policies, are witnessing slower growth due to higher upfront costs and maintenance requirements. The shift towards cloud adoption is expected to continue, supported by advancements in AI-driven sustainability platforms.
- For instance, IBM’s Envizi ESG Suite supports over 500 data types across more than 100 countries, enabling cloud-based carbon auditing for multinational corporations with complex reporting needs.
By Industry Vertical
Among industry verticals, the Manufacturing sector leads the Carbon Footprint Audit market, contributing the highest revenue share in 2024. High energy consumption and carbon output in manufacturing drive the need for regular audits and footprint assessments. The Energy & Utilities segment closely follows, propelled by regulatory mandates and the global transition to clean energy. Transportation & Logistics also demonstrates robust growth, influenced by rising emissions from supply chain activities. Meanwhile, IT & Telecom and Others are emerging as key contributors as digital infrastructure companies face mounting pressure to disclose and reduce carbon emissions across their operations.
Market Overview
Stringent Environmental Regulations and Compliance Mandates
Governments and international bodies are enforcing stricter regulations to curb carbon emissions, prompting organizations to adopt carbon footprint audits. Frameworks like the Paris Agreement and country-specific mandates such as carbon taxation and ESG disclosure requirements are accelerating demand. Businesses across sectors must comply with these evolving policies, making regular carbon audits a necessity. This regulatory push is particularly strong in high-emission industries like manufacturing, energy, and logistics, where non-compliance risks legal penalties and reputational damage, thereby fueling market growth.
- For instance, TÜV SÜD AG has issued over 25,000 certificates under ISO 14064 and other environmental compliance schemes, ensuring client adherence to international carbon reporting standards.
Rising Corporate Sustainability Initiatives
Corporate commitments to sustainability and net-zero goals are significantly driving the adoption of carbon footprint audits. Companies are increasingly integrating Environmental, Social, and Governance (ESG) metrics into their strategic frameworks to meet stakeholder expectations and enhance brand credibility. Voluntary climate pledges and investor-driven reporting pressures have led to increased demand for accurate carbon accounting and reduction roadmaps. As firms aim to align operations with global sustainability standards, carbon footprint auditing becomes a critical tool for measuring progress and identifying emission hotspots.
- For instance, SAP SE reported helping over 23,000 companies calculate and manage carbon emissions using its SAP Cloud for Sustainable Enterprises platform.
Technological Advancements in Emission Tracking and Analytics
The integration of digital technologies such as AI, IoT, and blockchain in carbon auditing has improved data accuracy, transparency, and process efficiency. These innovations enable real-time tracking, automated data collection, and predictive analysis of emissions across complex operations. Cloud-based platforms further support remote accessibility and scalable audit solutions. As organizations seek more efficient and cost-effective ways to manage environmental data, technology-driven carbon auditing solutions are witnessing increased adoption, contributing to the market’s rapid expansion.
Key Trends & Opportunities
Integration with ESG Reporting Frameworks
An emerging trend is the seamless integration of carbon footprint audit tools with global ESG reporting frameworks such as CDP, GRI, and SASB. Organizations are streamlining sustainability reporting by embedding audit insights into their annual disclosures. This integration enhances transparency and simplifies regulatory compliance while supporting stakeholder communication. The convergence of ESG and carbon footprint auditing creates a compelling opportunity for service providers to develop comprehensive solutions that combine financial, environmental, and operational metrics into a unified platform.
- For instance, Carbon Trust has enabled more than 6,000 companies to disclose emissions to CDP, contributing directly to over 15,000 climate-related reports in the past five years.
Expansion of Carbon Audit Services in SMEs
Traditionally focused on large enterprises, carbon footprint auditing is now gaining traction among small and medium-sized enterprises (SMEs). With increased awareness and accessible cloud-based solutions, SMEs are investing in emission assessments to align with supply chain sustainability standards and attract eco-conscious consumers. This trend opens a vast untapped market, particularly in emerging economies where regulatory frameworks are maturing. Service providers offering scalable, low-cost solutions tailored for SMEs stand to benefit significantly from this growing segment.
Growing Adoption of Carbon Offset Advisory Services
With many companies unable to eliminate all emissions internally, carbon offset advisory services are becoming a valuable complement to footprint audits. Businesses are turning to verified carbon offset programs, such as reforestation and renewable energy projects, to compensate for residual emissions. As scrutiny increases over the credibility of offset claims, expert advisory services help ensure compliance with recognized standards and proper investment in verifiable projects. This presents a strong growth avenue for firms specializing in carbon market strategies and offsets.
Key Challenges
Data Collection Complexity and Standardization Issues
A major challenge in the carbon footprint audit market lies in the complexity of collecting accurate, consistent data across diverse operations and geographies. Companies often struggle with fragmented systems, inconsistent reporting formats, and limited internal expertise, resulting in unreliable audits. The absence of universally accepted methodologies further complicates comparisons across industries. These issues can hinder transparency, reduce audit credibility, and slow the adoption of carbon auditing, particularly for organizations with global operations and decentralized data sources.
- For instance, Bureau Veritas manages data from over 140,000 site assessments annually, yet emphasizes the need for harmonized frameworks to support consistent global audit quality.
High Implementation Costs for Small Enterprises
Despite technological progress, the upfront cost of comprehensive carbon audits remains a barrier for small and medium enterprises. Expenses associated with software integration, expert consultations, and training can deter budget-constrained firms from adopting these services. Without government incentives or simplified audit models, many SMEs continue to prioritize core business activities over sustainability tracking. This cost barrier limits market penetration and slows the broader democratization of carbon auditing across industry verticals and regions.
Regional Analysis
North America
North America leads the Carbon Footprint Audit market, accounting for the largest market share of 43.0% in 2024, with a valuation rising from USD 1,019.81 million in 2018 to USD 1,890.37 million in 2024, and projected to reach USD 4,798.76 million by 2032, growing at a CAGR of 11.5%. The region’s dominance is driven by stringent environmental regulations, strong ESG investment trends, and early adoption of carbon auditing technologies. The U.S. in particular has seen widespread integration of sustainability frameworks across industries, especially in manufacturing, energy, and tech, which continue to propel audit service demand.
- For instance, Intertek Group plc supports over 3,000 North American clients through its CarbonClear™ assurance framework, delivering site-specific emission performance metrics across complex supply chains.
Europe
Europe holds the second-largest market share of 27.7% in 2024, with its Carbon Footprint Audit market valued at USD 675.00 million in 2018, rising to USD 1,219.42 million in 2024, and anticipated to reach USD 2,908.68 million by 2032, at a CAGR of 10.6%. The region’s growth is underpinned by robust climate policies, such as the EU Green Deal and Fit for 55 Package, which mandate strict emission disclosures. Widespread corporate sustainability initiatives and carbon neutrality goals across European industries—especially in automotive, logistics, and heavy manufacturing—continue to bolster the market’s expansion.
- For instance, DEKRA SE conducted more than 10,000 carbon audits across Europe in 2023 alone, including audits for leading automakers and transportation firms under ISO 14067 compliance standards.
Asia Pacific
Asia Pacific is the fastest-growing regional market with a CAGR of 13.2%, projected to grow from USD 461.23 million in 2018 to USD 934.99 million in 2024, and reach USD 2,674.78 million by 2032, holding a market share of 21.2% in 2024. Rapid industrialization, urbanization, and increasing pressure to curb emissions in China, India, and Southeast Asia are key growth drivers. As regional governments introduce carbon pricing mechanisms and sustainability mandates, industries are investing in carbon audits to remain competitive and attract international stakeholders. The region also benefits from a growing base of tech-enabled carbon audit startups.
Latin America
Latin America accounted for 4.5% of the global market share in 2024, with the market valued at USD 106.00 million in 2018, reaching USD 195.98 million in 2024, and projected to grow to USD 436.40 million by 2032, at a CAGR of 9.7%. Growth is driven by an increasing focus on environmental compliance and sustainable practices in sectors such as mining, agriculture, and oil & gas. While still emerging, regional governments are enhancing regulatory frameworks, and companies are recognizing the need for transparent emission reporting to access international trade and investment channels.
Middle East
The Middle East held a market share of 2.4% in 2024, with values growing from USD 61.62 million in 2018 to USD 104.83 million in 2024, and expected to reach USD 220.83 million by 2032, at a CAGR of 8.9%. As countries in the Gulf Cooperation Council (GCC) diversify their economies beyond oil, there is a rising push toward clean energy and sustainable industrial practices. National sustainability agendas and net-zero commitments by countries like the UAE and Saudi Arabia are encouraging large corporations to conduct regular carbon footprint audits, especially in the energy and infrastructure sectors.
Africa
Africa represents the smallest share of the global market, at 1.2% in 2024, growing from USD 25.48 million in 2018 to USD 54.87 million in 2024, and forecasted to reach USD 100.12 million by 2032, with a CAGR of 6.9%. The region’s growth is gradually picking up as awareness around climate change and international funding for sustainability programs increases. While infrastructure and policy challenges remain, sectors such as mining, agriculture, and utilities are beginning to adopt emission auditing practices to comply with international standards and unlock climate-linked investment opportunities.
Market Segmentations:
By Service Type:
- Carbon Footprint Auditing
- Carbon Footprint Verification
- Carbon Footprint Calculation
- Consulting Services
- Carbon Offset Advisory
By Deployment Mode:
- Cloud-Based Solutions
- On-Premises Solutions
By Industry Vertical:
- Manufacturing
- Energy & Utilities
- Transportation & Logistics
- IT & Telecom
- Others
By Geography
- North America
- Europe
- Germany
- France
- U.K.
- Italy
- Spain
- Rest of Europe
- Asia Pacific
- China
- Japan
- India
- South Korea
- South-east Asia
- Rest of Asia Pacific
- Latin America
- Brazil
- Argentina
- Rest of Latin America
- Middle East & Africa
- GCC Countries
- South Africa
- Rest of the Middle East and Africa
Competitive Landscape
The Carbon Footprint Audit market is moderately consolidated, with key players focusing on technological innovation, strategic collaborations, and service diversification to strengthen their market position. Major companies such as SAP SE, IBM Corporation, Schneider Electric, and Carbon Trust dominate the landscape through integrated platforms that combine carbon tracking, reporting, and advisory services. These firms leverage advanced analytics, AI, and cloud-based systems to offer scalable solutions tailored to enterprise needs. Certification and verification giants like SGS SA, Bureau Veritas, DEKRA SE, and TÜV SÜD AG provide essential third-party audit and compliance services, often in alignment with international standards. Competitive intensity is driven by rising regulatory compliance, demand for ESG integration, and the growing need for credible emissions reporting. Mergers, acquisitions, and product innovation continue to shape the competitive dynamics of the sector.
- For instance, SGS SA conducted over 90,000 sustainability verifications and issued 12,000+ audit reports in 2023 alone, positioning itself as a global leader in environmental compliance services.
Shape Your Report to Specific Countries or Regions & Enjoy 30% Off!
Key Player Analysis
- SAP SE
- IBM Corporation
- Schneider Electric
- Carbon Trust
- Enviance
- SGS SA
- Bureau Veritas
- DEKRA SE
- Intertek Group plc
- TÜV SÜD AG
Recent Developments
- In July 2025, SAP implements a “green ledger” approach, allowing companies to track carbon and financial resources in parallel, optimizing carbon management and audit readiness.
- In July 2025, TÜV SÜD updates its Carbon Reduction Plan, outlining transparent emissions reporting for audit and Net Zero commitments.
- In July 2025, the Carbon Trust’s organizational carbon footprint label will confirm that a company’s carbon footprint and emission reductions have been independently verified and are publicly tracked. This label signifies that the company’s commitment to mitigating climate change has been validated by an independent third party, adhering to international standards.
- In May 2025, Bureau Veritas partners with dsm-firmenich on carbon value programs for animal protein, leveraging audit mechanics for sustainable practices.
- In May 2025, Schneider Electric launches a major energy efficiency audit initiative, committing to 25 comprehensive audits across different facilities at their own expense to drive down business carbon footprints
Market Concentration & Characteristics
The Carbon Footprint Audit Market exhibits a moderately consolidated structure, with a limited number of global players holding significant market share. It is characterized by strong competition among established firms such as SAP SE, IBM Corporation, Schneider Electric, and SGS SA, which offer comprehensive carbon tracking, verification, and advisory services. The market reflects a high level of technological integration, including cloud-based platforms, AI-driven analytics, and automated data collection tools. Demand concentrates primarily in developed economies where environmental regulations and ESG mandates are firmly in place. Emerging economies present growth potential but face challenges related to awareness, infrastructure, and cost. The market relies heavily on regulatory compliance, corporate sustainability goals, and third-party verification services to ensure audit credibility. Large enterprises dominate demand due to the complexity of their operations and stronger pressure from stakeholders to report emissions. Small and medium-sized enterprises are entering the market at a slower pace due to budget constraints and lack of internal expertise. The service landscape is diverse, including auditing, consulting, calculation, verification, and offset advisory. Companies that provide integrated, scalable, and standards-compliant solutions hold a competitive edge. Certifications from recognized international bodies further influence market positioning. Demand for independent audits and transparent reporting continues to grow across manufacturing, energy, logistics, and IT sectors.
Report Coverage
The research report offers an in-depth analysis based on Service Type, Deployment Mode, Industry Vertical and Geography. It details leading market players, providing an overview of their business, product offerings, investments, revenue streams, and key applications. Additionally, the report includes insights into the competitive environment, SWOT analysis, current market trends, as well as the primary drivers and constraints. Furthermore, it discusses various factors that have driven market expansion in recent years. The report also explores market dynamics, regulatory scenarios, and technological advancements that are shaping the industry. It assesses the impact of external factors and global economic changes on market growth. Lastly, it provides strategic recommendations for new entrants and established companies to navigate the complexities of the market.
Future Outlook
- The Carbon Footprint Audit market will continue to grow steadily, driven by rising global climate commitments and mandatory emissions reporting.
- Increasing adoption of ESG frameworks will make carbon auditing an integral part of corporate sustainability strategies.
- Cloud-based audit solutions will gain traction due to their scalability, accessibility, and ease of integration with enterprise systems.
- Demand for third-party verification services will rise as companies seek credibility and compliance with international standards.
- Small and medium enterprises will increasingly adopt audit services, supported by simplified, cost-effective digital tools.
- Asia Pacific will emerge as a key growth region due to rapid industrialization and evolving environmental regulations.
- Carbon offset advisory services will expand as companies look to neutralize residual emissions through verified projects.
- Integration of AI, blockchain, and big data analytics will enhance the accuracy and efficiency of audit processes.
- Public and investor pressure will continue to push companies toward transparent carbon disclosure and independent assessments.
- Strategic partnerships between audit providers, technology firms, and regulatory bodies will shape the future market landscape.


