
Statutory deadlines now drive most verification spending
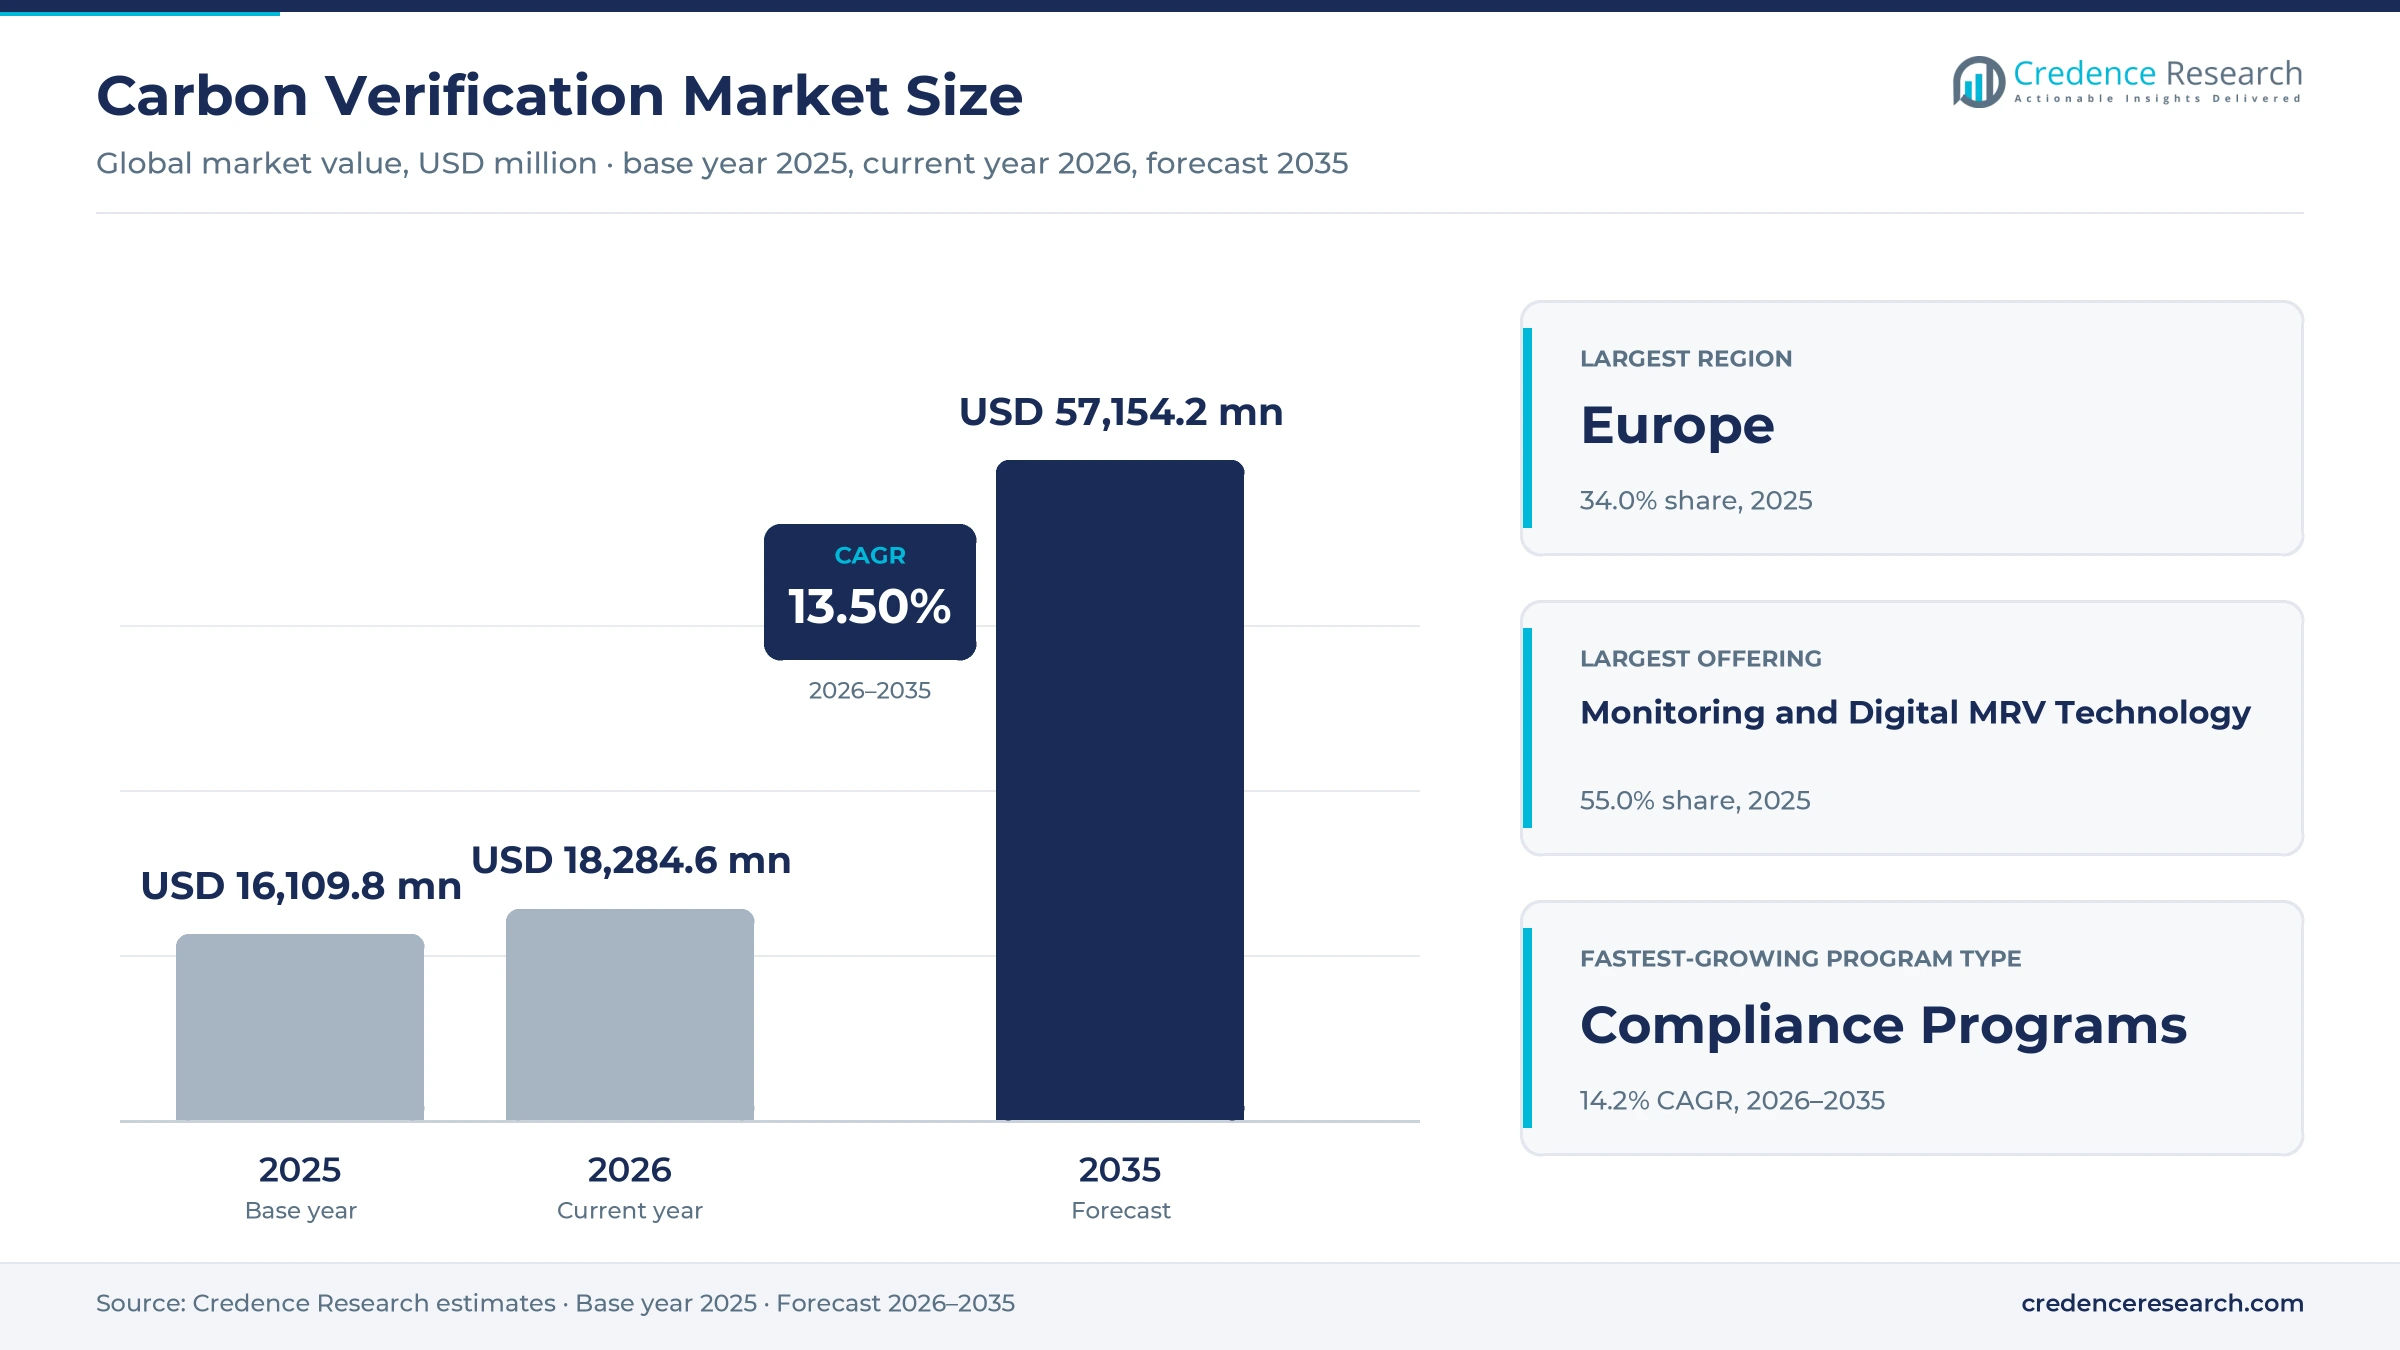
The global carbon verification market was valued at USD 16.11 billion in 2025 and is projected to increase from USD 18.28 billion in 2026 to USD 57.15 billion by 2035, registering a CAGR of 13.50% during 2026–2035. Demand comes from power producers, heavy industry, airlines, shipping lines, listed companies and carbon project developers that need an accredited third party to confirm emissions inventories, reduction claims and credit issuances before regulators, registries or investors accept them. Europe held the largest regional share, 34.0% in 2025, because EU ETS operators, shipping companies and CBAM goods producers must file verified reports. Asia Pacific is the fastest-growing region at 14.8% a year as China, India and Japan move industrial emitters onto verified compliance cycles. The main commercial change is the move from voluntary checks to statutory verification, since border carbon rules and disclosure laws now attach a cost or a penalty to unverified data, which favors accredited verifiers with installation-level engineering skills.
Verified emissions data now carries a price under carbon rules
The market counts third-party verification, validation and assurance of greenhouse gas inventories, emission reductions, removals and product carbon footprints, together with the monitoring instruments and digital MRV platforms that produce verification-grade data. Companies buy verification as annual engagements tied to a reporting deadline, while project developers pay a validation fee once and a verification fee for each issuance period.
Advice on reducing emissions, the sale of offset credits themselves and reporting software without an assurance function are excluded. Value sits with accredited verifiers and audit firms that sign the opinion, with engineering specialists that inspect plants and project sites, and with technology vendors whose sensors and platforms cut the hours each engagement needs.
Carbon Verification Market Insights
- The global carbon verification market was valued at USD 16.11 billion in 2025 and is projected to reach USD 57.15 billion by 2035, growing at a 13.50% CAGR during 2026–2035.
- Europe held 34.0% of 2025 value because EU ETS installations, aircraft operators and shipping companies must file verified emissions reports by March 31 each year.
- Voluntary programs held 52.0% of 2025 value, while compliance programs grow fastest at 14.2% a year as CBAM and Asian trading schemes require verified data.
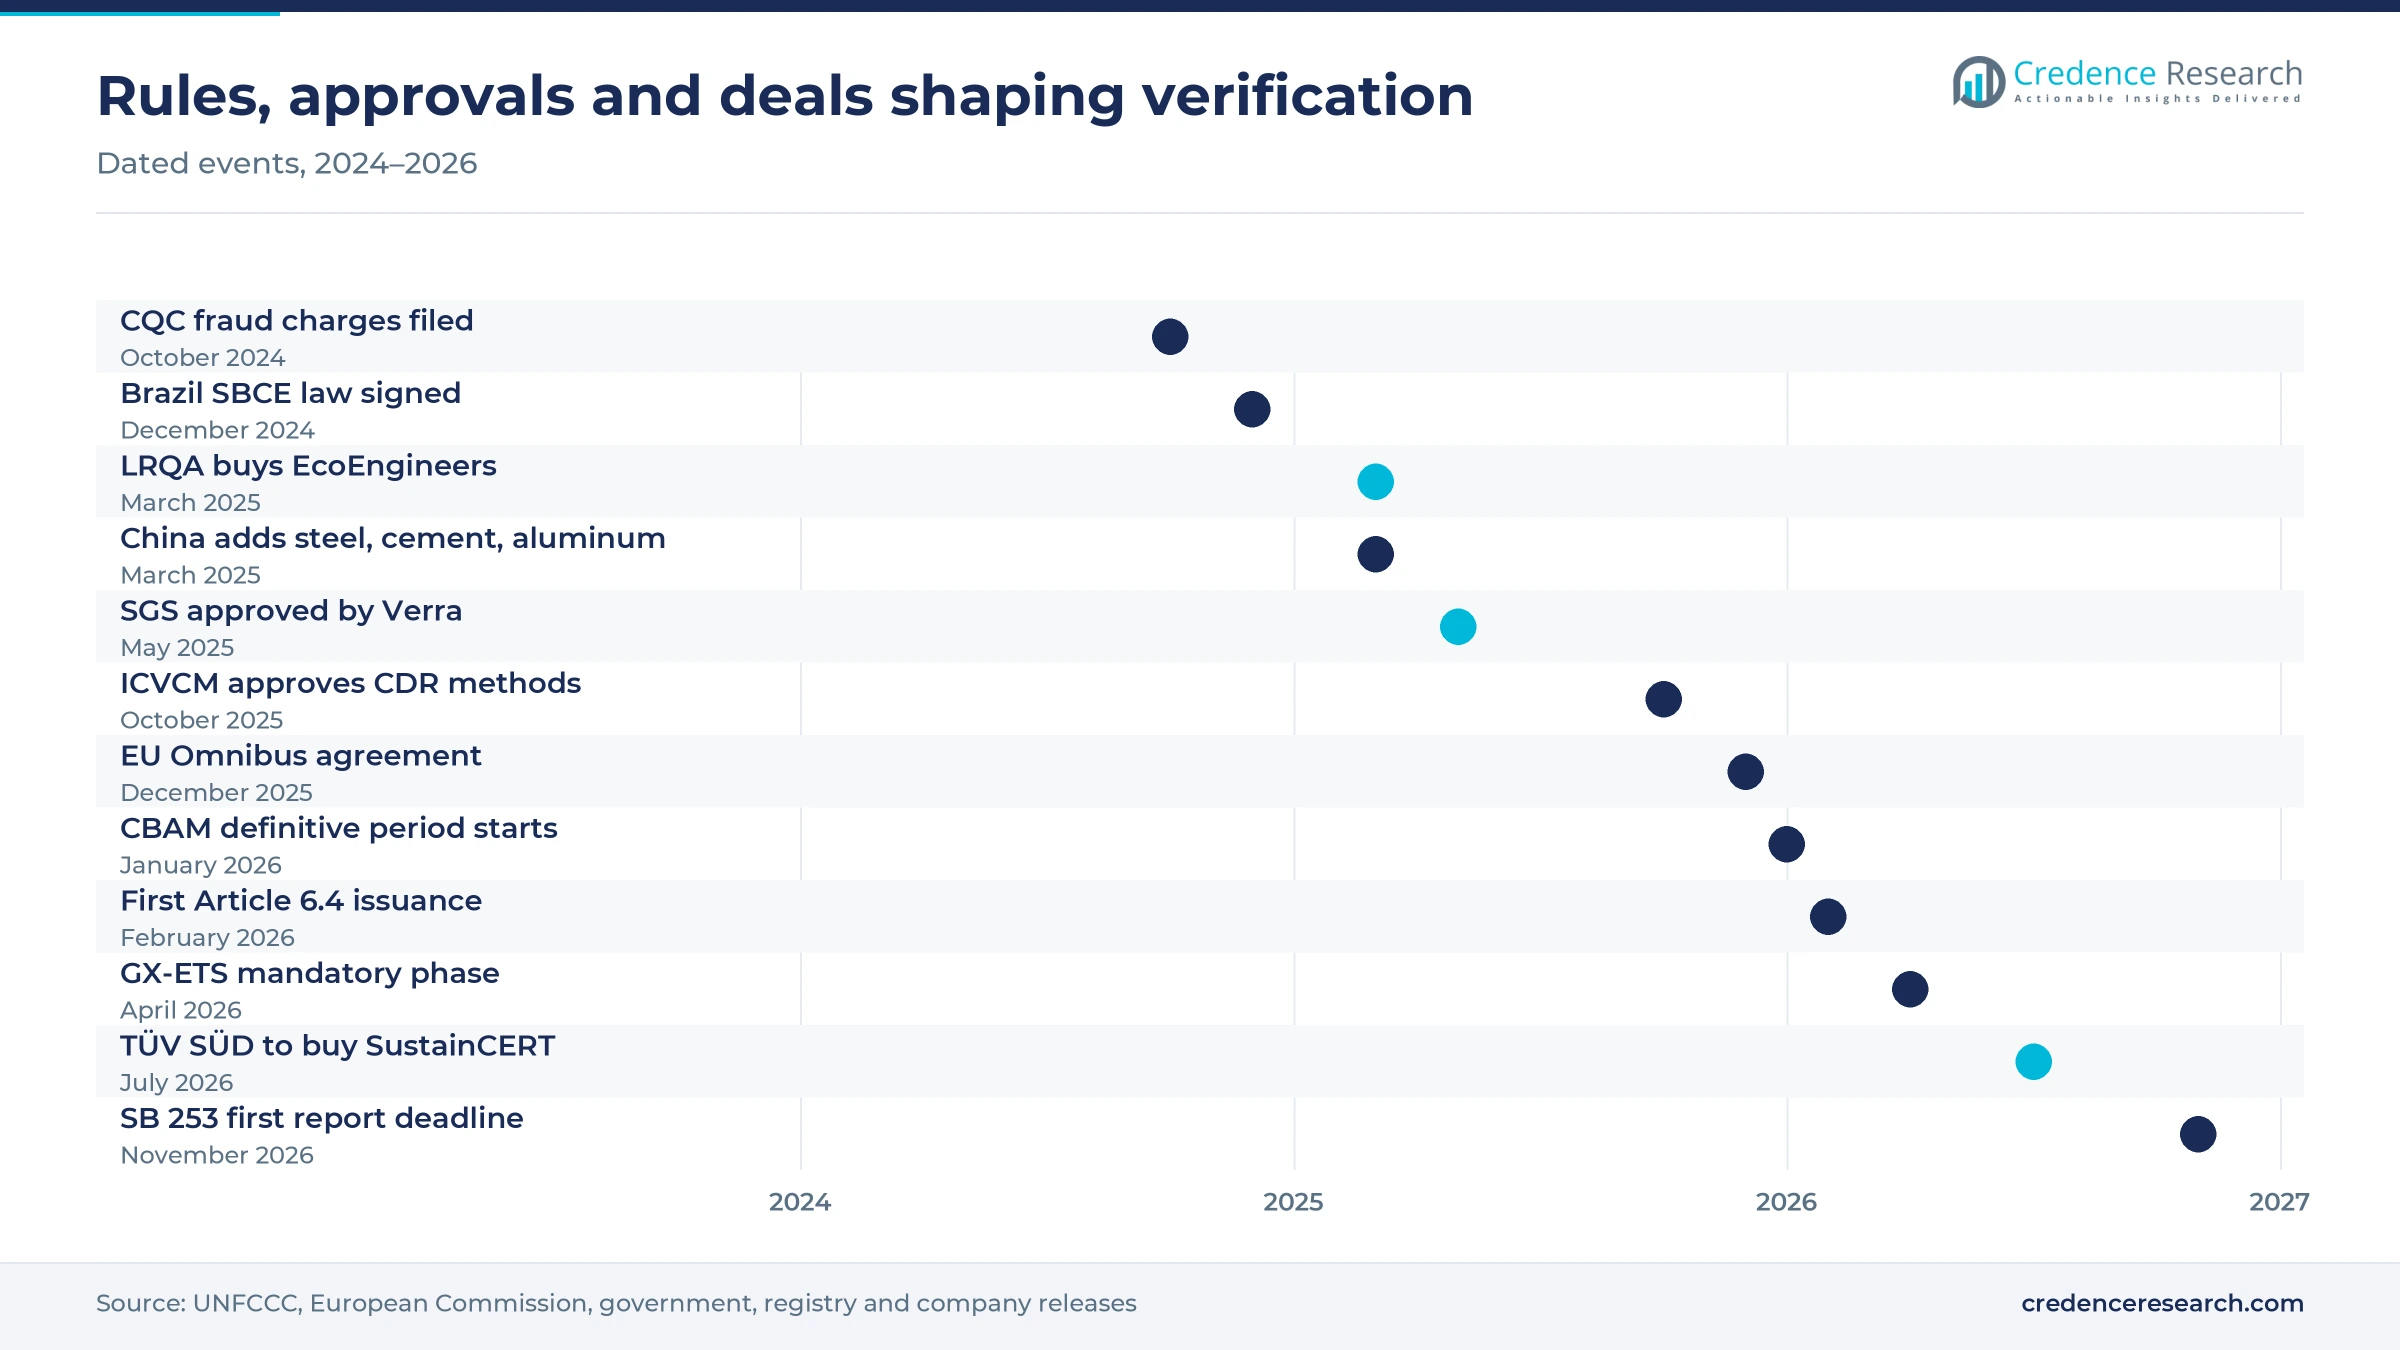
- The UN Article 6.4 Supervisory Body approved the first issuance of Paris Agreement credits on Feb. 26, 2026, for a clean-cooking program in Myanmar.
- TÜV SÜD announced the acquisition of SustainCERT in July 2026, adding a digital verification platform to a large testing and certification group.
Digital MRV tools lead as compliance programs grow fastest
Monitoring and data platforms lead and also grow fastest
Based on offering, the market is categorized into monitoring and digital MRV technology, verification and assurance services and validation and certification services. Monitoring and Digital MRV Technology led with 55.0% of 2025 value because monitors, meters and data platforms are bought for every obligated installation, while assurance fees recur once per cycle. It also grows fastest at 14.4% a year as verifiers buy software, and TÜV SÜD announced in July 2026 that it is buying SustainCERT for its verification platform. Verification and assurance services rank second, and an IFAC study of about 1,400 large companies found 75% obtained 2024 assurance, with audit firms performing 59% of engagements.
Investor-driven inventories lead as compliance cycles grow faster
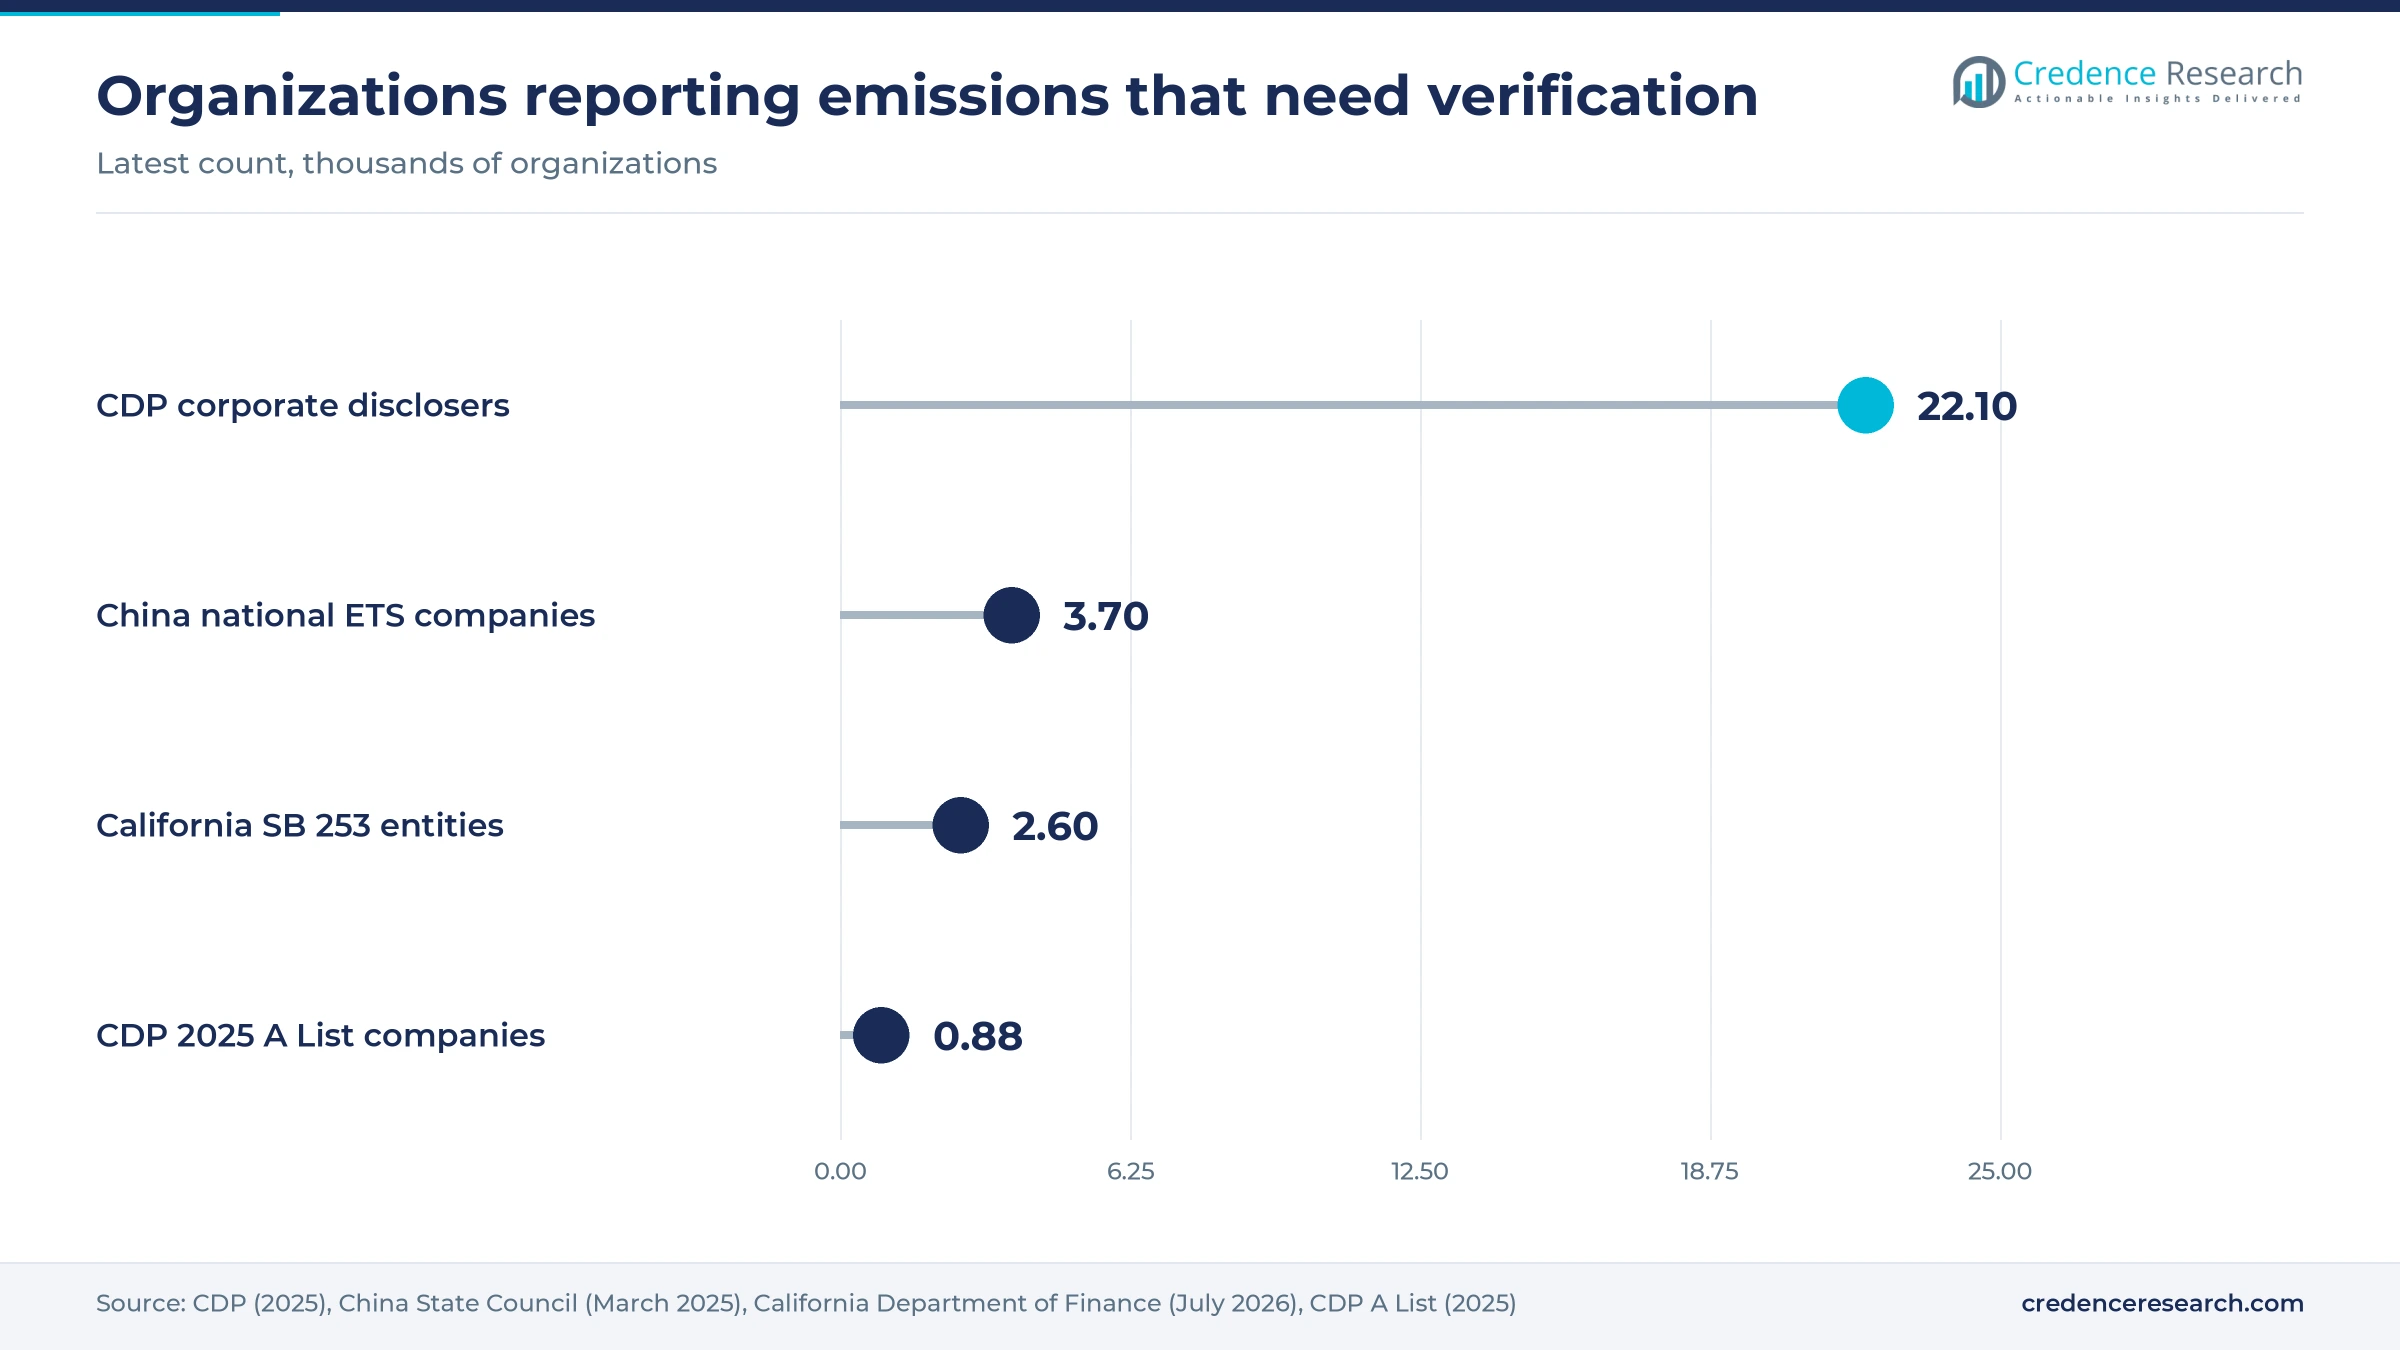
Based on program type, the market is categorized into voluntary programs and compliance programs. Voluntary Programs led with 52.0% of 2025 value because investor questionnaires and net-zero targets drive most corporate inventory checks, and more than 22,100 companies disclosed environmental data through CDP in 2025, according to CDP. Compliance Programs grow fastest at 14.2% a year as Asian schemes add obligated emitters, and India's Bureau of Energy Efficiency granted its first carbon verification accreditations, including one to Bureau Veritas India, in February 2026 as obligated industrial entities move onto verified cycles.
Power plants anchor demand while heavy industry adds the most
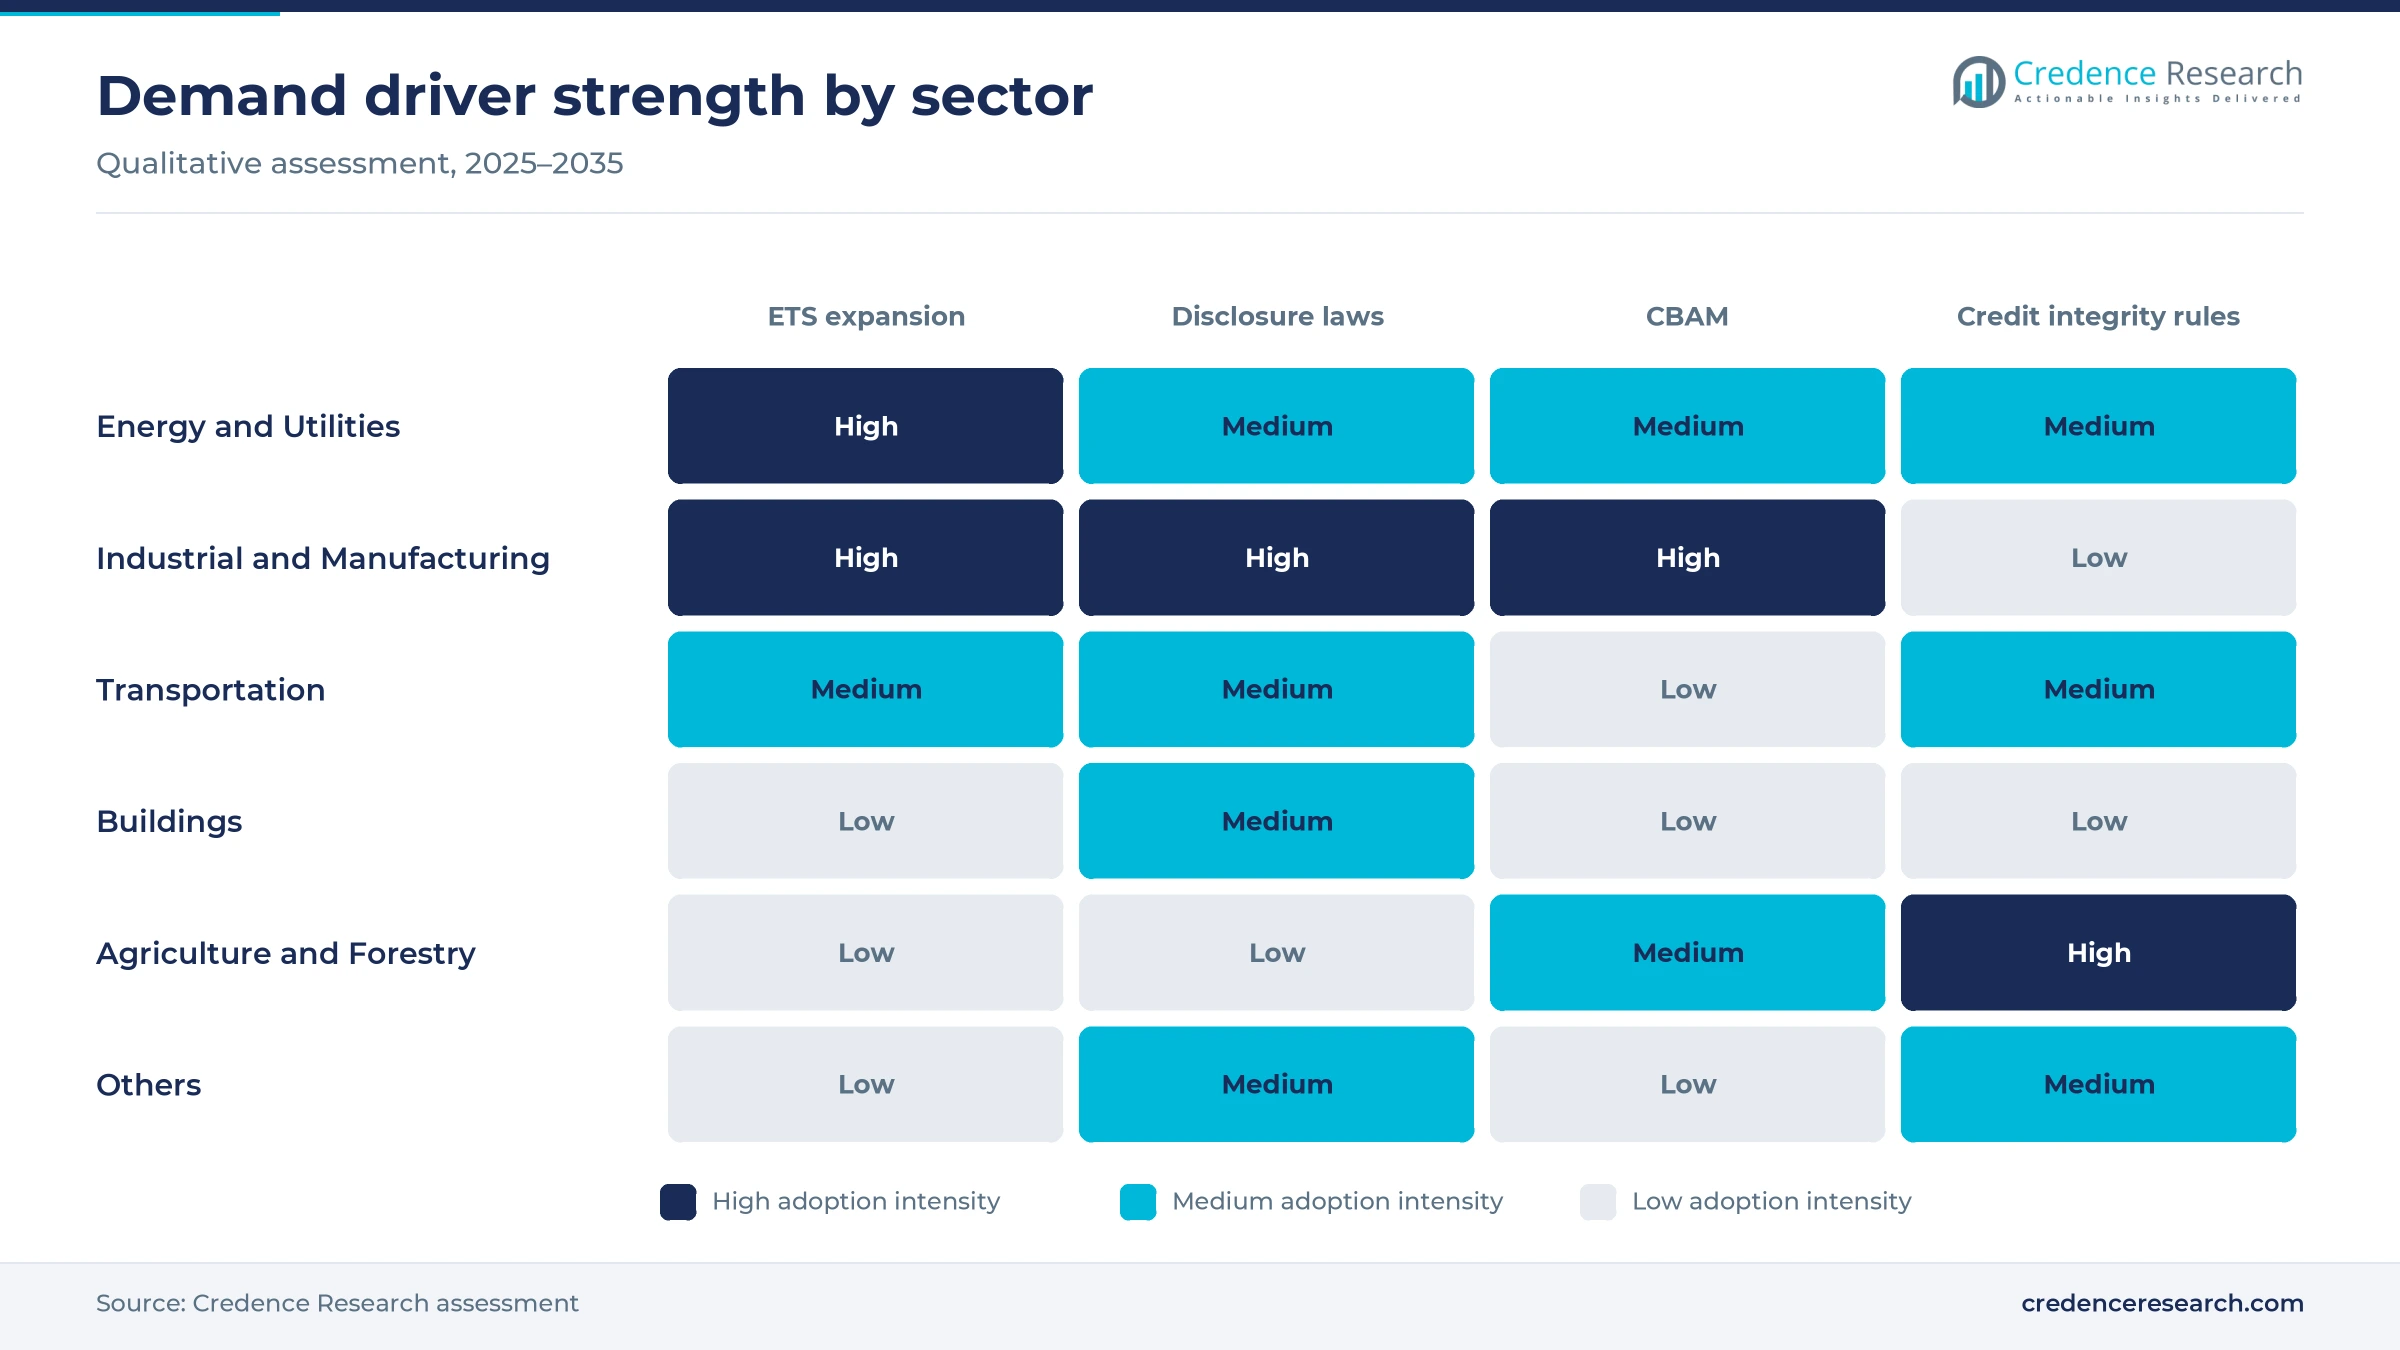
Based on sector, the market is categorized into energy and utilities, industrial and manufacturing, transportation, buildings, agriculture and forestry and others, which include water and wastewater. Energy and Utilities led with 31.0% of 2025 value because power plants were the first sector placed under most trading schemes, and China's national market already covers about 2,200 coal-fired power companies emitting about 5 billion tons of CO2 a year. Industrial and Manufacturing grows fastest at 14.4% a year as about 1,500 steel, cement and electrolytic aluminum producers, emitting about 3 billion tons, joined that market in 2025 while CBAM targets the same products.
| Segment Group | Leading Sub-segment | Share, 2025 | Fastest-growing Sub-segment | CAGR, 2026–2035 |
|---|---|---|---|---|
| By Offering | Monitoring and Digital MRV Technology | 55.0% | Monitoring and Digital MRV Technology | 14.4% |
| By Program Type | Voluntary Programs | 52.0% | Compliance Programs | 14.2% |
| By Sector | Energy and Utilities | 31.0% | Industrial and Manufacturing | 14.4% |
Fees track site count, data quality and assurance level
Verification is priced as a fixed engagement fee set by the number of sites, emission sources and the assurance level, not by the tons covered. Corporate Scope 1 and Scope 2 assurance under California's rule works out to roughly USD 54,000 per company, derived from the state's USD 141 million annual estimate for about 2,600 companies, while a carbon project audit costs far less per engagement. Registry levies then add a per-credit charge on top of the audit fee. Reasonable assurance, more sites and poor metering raise fees, while remote review and digital data lower them. Large verifiers protect margins through multi-year framework contracts with multinational clients.
| Engagement or charge | Typical price or fee | Basis |
|---|---|---|
| Scope 1 and 2 limited assurance, California | About USD 54,000 per company a year | Credence Research estimate from the California Department of Finance SB 253 assessment, July 2026 |
| Carbon project validation or verification audit | USD 10,000–30,000 per audit cycle | Listed range, IEF wiki carbon market reference, 2026 |
| Verra VCU issuance levy | USD 0.23 per metric ton of reductions claimed, from Jan. 1, 2025 | Verra fee schedule update |
| CBAM default value markup if unverified | 10% in 2026, 20% in 2027, 30% in 2028 | SCS Global Services, 2026 |
Request a Free Sample
Fill in your details and we'll send you a free sample report.
- Sample data tables & charts
- Research methodology
Trading schemes, disclosure laws and CBAM lift demand
New emissions trading schemes multiply verified compliance cycles
Each new emissions trading system creates a recurring verification obligation, because allowances are allocated and surrendered against verified tons rather than self-reported figures. According to the World Bank, 80 carbon pricing instruments were operating in 2025 and covered about 28% of global greenhouse gas emissions, up from 12% a decade earlier. Japan's GX-ETS entered its mandatory phase on April 1, 2026, for companies emitting at least 100,000 metric tons of CO2 a year, and their FY2025–26 emissions must be third-party verified in early 2027. Brazil's Law No. 15,042 of December 2024 adds a regulated market that will need verifiers once its MRV system is deployed. Compliance programs carry the fastest program-type growth noted above, and verifiers with industrial engineering staff gain the most work.
Disclosure laws turn emissions assurance into an annual purchase
Mandatory climate disclosure converts assurance from a reputational choice into a budget line, since the opinion must accompany a filing with a fixed date. California's SB 253 covers about 2,600 companies with more than USD 1 billion in revenue, and the state's regulatory impact assessment puts the annual assurance cost at about USD 141 million. The Air Resources Board will accept 2026 reports with or without limited assurance, and it plans a transition to reasonable assurance by 2030. The IAASB's ISSA 5000 standard, published in November 2024 and effective for periods beginning on or after Dec. 15, 2026, gives audit firms and other practitioners one global basis for these engagements. That common standard lowers switching costs for buyers and sharpens price competition.
CBAM makes installation audits the route to lower border costs
The EU Carbon Border Adjustment Mechanism rewards verified data, because importers that rely on default values pay more for each ton of embedded emissions. Default values carry markups of 10% in 2026, 20% in 2027 and 30% in 2028, according to SCS Global Services. Actual emissions must be checked by verifiers accredited by EU or EEA national accreditation bodies, with first accreditations expected around September 2026 and the first verification reports from January 2027. Declarants then finalize the 2026 declaration in September 2027, and a threshold of 50 tons of goods per importer keeps small buyers out. Steel, aluminum, cement and fertilizer plants in Asia and the Middle East become new clients, which favors verifiers with multilingual site teams.
Paris Agreement crediting raises the bar for project verification
Compliance buyers now absorb a larger share of offset credits, and they require verification to rules set by governments rather than by private registries alone. According to the World Bank, compliance demand for carbon credits almost tripled in 2024 while voluntary buyer growth was negligible. The UN Article 6.4 Supervisory Body approved the first Paris Agreement credit issuance on Feb. 26, 2026, for a clean-cooking program in Myanmar, with crediting about 40% below what the older CDM rules would have issued, the UNFCCC said. Credits authorized for Korea can be used in the Korean Emissions Trading System. This shift sends project audits toward verifiers accredited under UN and national rules, and stricter baselines lengthen each engagement.
Consolidation and remote review reshape verifier work
Consolidation rises as testing groups buy specialist verifiers
Large testing and certification groups are shifting toward acquisitions to add carbon market accreditations faster than they could build them, creating openings for specialist teams across fuels, removals and nature projects. LRQA acquired EcoEngineers, a U.S. auditing and advisory firm focused on the energy transition, in March 2025, its 5th acquisition in five months. SGS gained four approvals as a validation and verification body within 13 months, from Isometric in April 2025, Verra in May 2025, Cercarbono in October 2025 and the International Carbon Registry in May 2026. Each accreditation opens a new registry pipeline, so buyers can use one verifier across several standards. Independent boutiques face a choice between selling and specializing, because accreditation requires fixed investment while project budgets cap engagement fees.
Verification shifts toward remote data review and targeted site visits
Regulators and verifiers are shifting toward data-driven review to handle more engagements, creating openings for monitoring hardware, digital MRV platforms and ESG data software across industrial sites. SCS Global Services says roughly two-thirds of CBAM verification work is remote document review and one-third is on-site assessment. The European Commission amended the EU ETS accreditation and verification rules through Implementing Regulation (EU) 2025/1192 of June 18, 2025, covering aspects of data verification. Small aviation emitters below 25,000 metric tons of CO2 a year can submit reports generated with Eurocontrol tools without further verification. Verifiers that standardize remote evidence review can serve more clients per auditor, while sites with poor metering face longer and costlier visits.
Non-EU exporters open a new pool of installation audit clients
CBAM creates a supply gap for accredited verifiers outside Europe, because verification takes place at the installation where goods are made and few local firms hold EU accreditation. Non-EU companies can apply to any EU or EEA national accreditation body that offers CBAM accreditation, and SCS Global Services says its application was accepted by the Dutch accreditation council RvA, with full accreditation expected by the end of 2026. Every importer above the 50-ton annual threshold must file, so EU customers press exporters for verified values. The European Commission has proposed adding 180 downstream steel and aluminum products from 2028. A failure to surrender certificates costs EUR 100 per ton of CO2 plus the unpaid amount, which gives exporters a measurable reason to buy verified data. Verifiers with offices in exporting countries can sell CBAM audits alongside national ETS work.
Engineered removals create an opening for geoscience verifiers
Engineered carbon removal is a small but technically demanding opening, because geological storage, bio-oil injection and direct air capture need measurement skills that forestry verifiers rarely hold. The Integrity Council for the Voluntary Carbon Market approved six engineered removal methodologies for its CCP label on Oct. 1, 2025, and said 24 Isometric projects are expected to issue more than 3.2 million credits a year. Only about 30,000 engineered removal credits had been issued at that point. The same decision approved a revised afforestation methodology, VM0047, with 52 early-stage projects expected to issue 6.5 million credits a year. Verifiers that combine geoscience and nature expertise can win longer engagements, and SGS already holds Isometric approval.
Fraud, rollbacks and accreditation gaps constrain growth
Data fraud cases raise liability for verifiers
Falsified project data erodes trust in verification opinions and shifts liability toward the verifier. On Oct. 2, 2024, U.S. prosecutors charged former CQC executives with fraud, alleging that false cookstove performance data were sent to a registry and to validation and verification bodies, and the company settled with the CFTC for USD 1 million. China's Ministry of Ecology and Environment named four technical service companies in March 2022 for helping emitters manipulate data. Verifiers now carry higher sampling and site-visit costs, which squeezes fixed-fee contracts.
Omnibus cuts shrink the EU corporate assurance pipeline
The EU Omnibus agreement of December 2025 narrows CSRD reporting to companies with more than 1,000 employees and net turnover above EUR 450 million, which reduces the previous scope by around 90%, according to Rödl & Partner. Planned reasonable assurance was dropped, so engagements stay at the cheaper limited level. Audit firms and verifiers that hired for thousands of mid-sized clients now carry spare capacity, and mid-sized EU companies may move emissions checks back to voluntary, lower-budget engagements.
Accreditation bottlenecks compress the first CBAM and India cycles
New compliance cycles start before enough accredited capacity exists, which concentrates work in short windows. Only EU or EEA national accreditation bodies can grant CBAM accreditation, and the first approvals were expected around September 2026, only four months before verification reports could be issued. India's first compliance cycle under its trading scheme got under way while the Bureau of Energy Efficiency was still adding accredited agencies to its list. Operators that book late face higher fees or default values, and verifiers without accreditation lose these clients to larger groups.
Fixed audit fees limit verification on small projects
Fixed verification costs weigh hardest on small carbon projects, whose credit volumes may not cover an audit. The IEF wiki, a carbon market reference site, lists typical verifier fees of USD 10,000 to USD 30,000 per audit cycle, before a Verra issuance levy of USD 0.23 per metric ton claimed, in force since Jan. 1, 2025. A community cookstove or small forestry project issuing a few thousand credits a year can spend a large part of its revenue on assurance. Developers respond by lengthening verification intervals, which delays issuance and reduces annual demand for verifier hours.
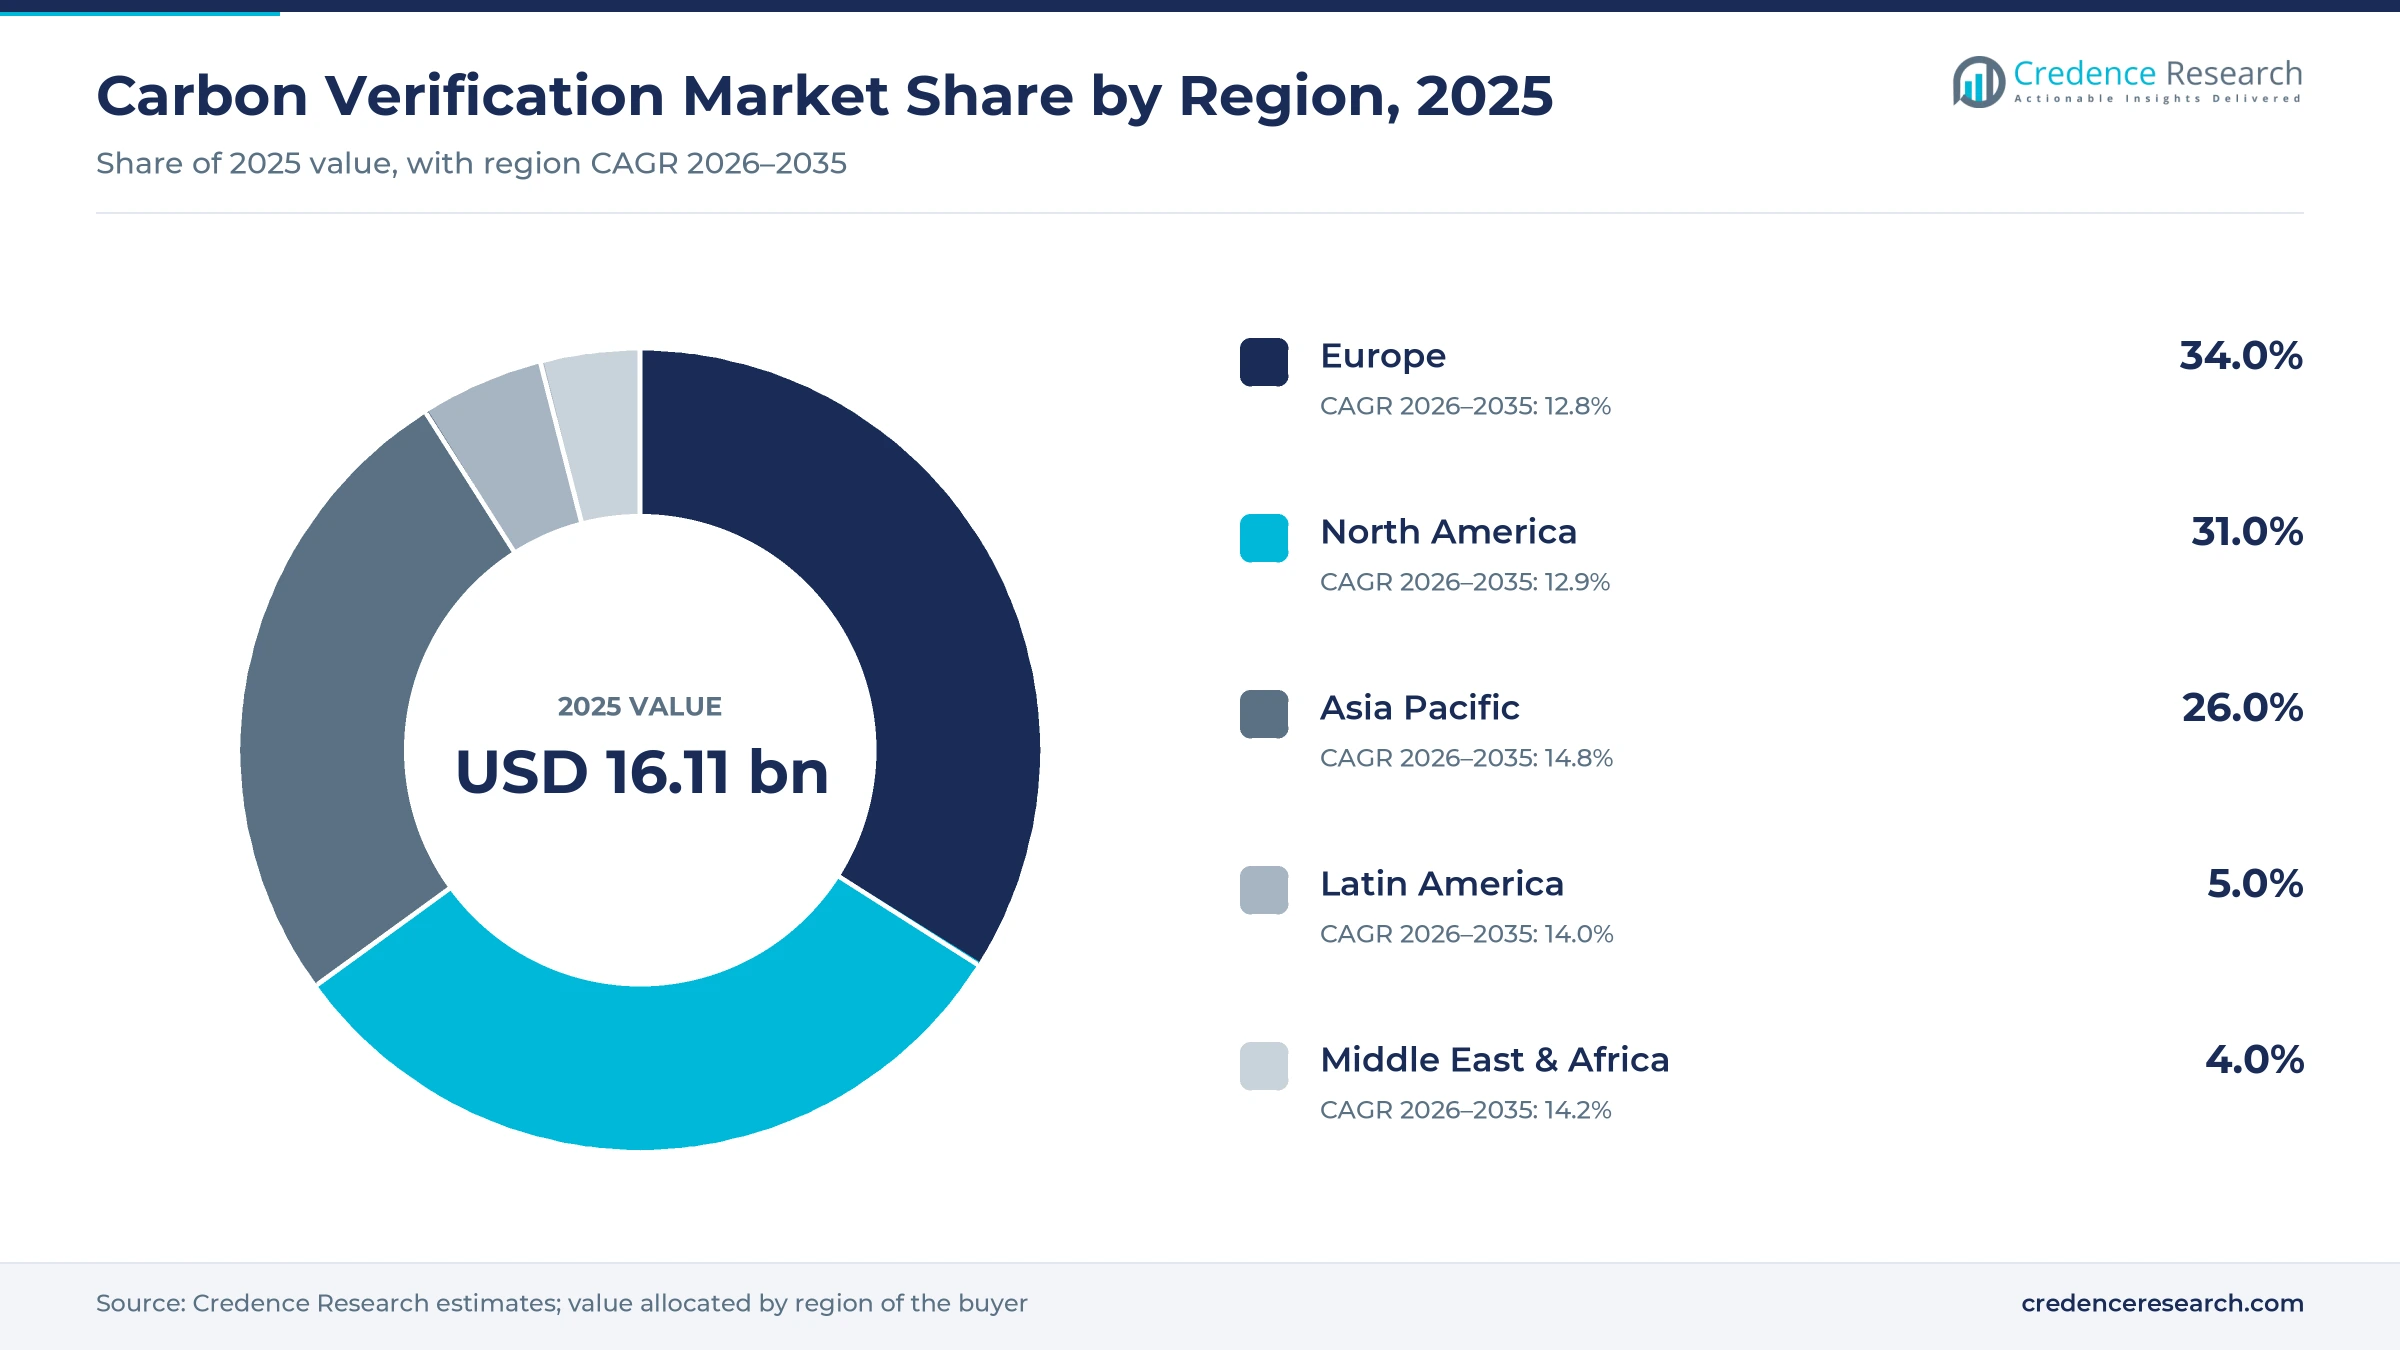
Europe leads as Asia Pacific grows fastest
Regional value follows where verification is written into law, since compliance deadlines decide when and how often emitters buy audits. Europe and North America together held about 65% of 2025 demand, while Asia Pacific adds the largest number of newly obligated emitters.
| Region | Value, 2025 (USD billion) | Share, 2025 | CAGR, 2026–2035 |
|---|---|---|---|
| Europe | 5.48 | 34.0% | 12.8% |
| North America | 4.99 | 31.0% | 12.9% |
| Asia Pacific | 4.19 | 26.0% | 14.8% |
| Latin America | 0.81 | 5.0% | 14.0% |
| Middle East & Africa | 0.64 | 4.0% | 14.2% |
Europe leads on mature ETS rules and CBAM audits
Europe held 34.0% of 2025 value and grows at 12.8% a year, the slowest pace among the five regions because its compliance base is already mature. The European Commission requires every EU ETS installation, aircraft operator and shipping company to submit an emissions report checked by an accredited verifier by March 31, and it tightened verifier accreditation rules in June 2025. The CBAM timetable described above adds installation audits outside the bloc, while the Omnibus cut to CSRD scope removes part of the corporate assurance pipeline.
North America grows on California disclosure and fuel audits
North America held 31.0% of 2025 value and grows at 12.9% a year. California is the main new source of work, since the Air Resources Board set Nov. 10, 2026, as the first deadline for Scope 1 and Scope 2 reports from companies with more than USD 1 billion in revenue. Low-carbon fuel programs keep demand for specialist auditors, which explains LRQA's purchase of EcoEngineers. The CQC case described above raised diligence costs for U.S. project developers and their verifiers.
Asia Pacific grows fastest as three large schemes verify at once
Asia Pacific held 26.0% of 2025 value and grows fastest at 14.8% a year because three large economies are moving from voluntary reporting to verified compliance at the same time. China's national market now spans power, steel, cement and aluminum, Japan's GX-ETS requires verified FY2025–26 emissions in early 2027, and India granted its first verification accreditations in February 2026. Local verifiers hold an advantage on language and site access, but exporters facing CBAM also need EU-accredited teams, which favors multinational groups with Asian offices.
Latin America builds a regulated market on Brazil's new law
Latin America held 5.0% of 2025 value and grows at 14.0% a year. Brazil's Law No. 15,042 of Dec. 11, 2024, created the SBCE, which requires emitters above 10,000 metric tons of CO2e a year to report and those above 25,000 metric tons to join the regulated market. The law deploys an MRV system in a later phase, after a governing body is set up, so compliance demand builds only toward the end of the decade. Forest and land-use projects keep voluntary validation work steady in the meantime.
Middle East and Africa grow from Gulf crediting and exports
The Middle East and Africa held 4.0% of 2025 value and grow at 14.2% a year from a small base. The Qatar-based Global Carbon Council received CCP-eligible status from the Integrity Council in May 2026 and reports more than 213 registered projects and more than 15 million credits issued, which creates validation work for Gulf energy and African clean-energy projects. Gulf aluminum and fertilizer producers that export to Europe also face CBAM installation audits from 2027.
Acquisitions and registry approvals mark 2025–2026
| Development | Status and market relevance |
|---|---|
| In March 2025, LRQA acquired EcoEngineers, a U.S. auditing and advisory firm focused on low-carbon fuels, carbon markets and climate policy. | Completed acquisition. It was LRQA's fifth deal in five months and adds U.S. fuel-program audit capacity. |
| In May 2025, SGS received approval from Verra as a validation and verification body under the Verified Carbon Standard, covering sectors from energy to forestry and carbon capture and storage. | Approval. SGS can now audit projects on the largest voluntary registry, adding to its Isometric approval of April 2025. |
| In October 2025, the Integrity Council for the Voluntary Carbon Market approved six engineered carbon removal methodologies from Gold Standard and Isometric for its CCP label. | Approval. Verifiers can now audit CCP-labeled removal credits, a pipeline described in the opportunities section. |
| In February 2026, the Article 6.4 Supervisory Body approved the first issuance of credits under the Paris Agreement Crediting Mechanism for a clean-cooking program in Myanmar. | Approval, subject to a 14-day appeal period. It sets the first precedent for verified credits under the UN mechanism. |
| In July 2026, TÜV SÜD announced the acquisition of SustainCERT, a Luxembourg-based verifier founded by the Gold Standard Foundation in 2018. | Announced acquisition with undisclosed terms. It adds a digital verification platform and carbon market accreditations to TÜV SÜD. |
Monitoring and digital MRV cut the cost of each opinion
- Continuous monitoring measures stack gases directly, and continuous emission monitoring systems give verifiers measured data in place of fuel-based estimates at power and cement plants.
- Digital MRV platforms stream meter and sensor data to the verifier, which cuts sampling work and lets registries issue credits on shorter cycles.
- Remote sensing uses satellite and aerial imagery to check forest cover and site activity, which reduces travel for nature projects.
- Assurance standards such as ISO 14064-3 and ISSA 5000 set the evidence and sampling rules, which lets buyers compare opinions from audit firms and engineering verifiers.
Need a Custom Version of This Report?
Tailor the scope, geography, or segments to your exact requirements.
- Custom geography or segment scope
- Direct access to our analyst team
Testing groups and audit firms compete for assurance
Competition splits between engineering-based verifiers, which hold sector accreditations and send auditors to plants and project sites, and audit firms, which sell emissions assurance alongside the financial audit. DNV, Bureau Veritas, SGS, TÜV SÜD, TÜV Rheinland, Intertek and LRQA compete on the breadth of their accreditations across ETS, CBAM and voluntary registries and on office networks in exporting countries. SCS Global Services focuses on offset project verification and CBAM work. KPMG, PwC and EY win where companies want one provider for financial and sustainability assurance. Most of the engineering groups also operate across the wider testing, inspection and certification sector, so they can bundle emissions audits with product and safety certification. Price competition is strongest in routine project verification, while complex removal audits and reasonable assurance reward specialist teams.
Accredited groups and audit firms split the supply side
The supply side is concentrated at the top and fragmented below. Global testing groups such as DNV, Bureau Veritas, SGS, TÜV SÜD and LRQA hold the broadest accreditation lists across ETS, CBAM and voluntary registries, while audit firms performed most assurance engagements in the IFAC study noted above. Many national verifiers serve local trading schemes and offset programs. Entry barriers come from accreditation, which takes months and requires sector-qualified auditors, and from liability exposure. Margins are likely highest in reasonable assurance and complex removal audits, although firms rarely disclose them. Several groups also sell ESG advisory services and must keep them apart from audits to stay independent.
Companies profiled and their roles in this market
| Company | Type | Role in the market |
|---|---|---|
| DNV AS | Engineering verifier | Corporate inventory and CDP verification and carbon project validation |
| Bureau Veritas SA | Engineering verifier | ISO 14064 verification, carbon footprint verification and voluntary market audits |
| SGS SA | Engineering verifier | Verifier under Verra, Isometric, Cercarbono and the International Carbon Registry |
| TÜV SÜD AG | Engineering verifier | Emissions verification and the SustainCERT digital verification platform |
| TÜV Rheinland AG | Engineering verifier | Greenhouse gas and carbon footprint verification |
| Intertek Group plc | Engineering verifier | ISO 14064-1 third-party greenhouse gas verification |
| LRQA | Engineering verifier | EU ETS and regulatory scheme verification and EcoEngineers fuel audits |
| SCS Global Services | Project and CBAM verifier | Offset project verification and CBAM verification |
| KPMG International | Audit firm | Limited and reasonable assurance of corporate emissions statements |
| PricewaterhouseCoopers International Limited (PwC) | Audit firm | Sustainability and emissions assurance for listed companies |
| Ernst & Young Global Limited (EY) | Audit firm | Sustainability and emissions assurance for listed companies |
Verification is turning into a regulated annual service
Credence Research's view is that verification is becoming a regulated annual service rather than a discretionary sustainability purchase. Most new volume comes from statutory deadlines in Europe, China, India, Japan and California, while voluntary credit verification grows more slowly and carries higher liability. Verifiers that hold accreditations across several schemes and can staff installation audits in exporting countries will take share. Compliance work in Asia Pacific, where China, Japan and India are all starting verified compliance cycles, will add the largest pool of new engagements through 2035. The main uncertainty is policy, since the EU Omnibus showed that assurance requirements can be cut quickly, and the forecast assumes no comparable rollback in Asian schemes.
Obligated entities and engagement fees anchor the model
The report uses 2025 as the base year and forecasts to 2035. Market values come from the Credence Research model, which starts from the number of organizations and installations under verification obligations, typical engagement fees and spending on monitoring and digital MRV tools. Monitoring hardware and data platforms account for more than half of the total, while fee-based verification and assurance services form a smaller pool of about USD 6 billion. The model then checks the total against regulator and company disclosures. The core demand base for 2025 includes more than 22,000 disclosing companies and about 3,700 companies in China's national trading scheme. Regional and segment splits are Credence Research estimates built from obligated entity counts. Sources include regulator and government releases, accreditation and registry documents, company announcements and reputable trade press. No interviews or surveys were conducted for this edition, and the earlier 2024 base was rolled forward to 2025 while its growth rate was replaced.
Fixed compliance cycles carry demand through 2035
Through 2035 the market should grow at a 13.50% CAGR as CBAM installation audits, Asian trading schemes and mandatory disclosure rules move verification onto fixed annual cycles. Compliance work will take a larger share of value, while voluntary credit verification grows more slowly and concentrates on removals and CCP-labeled projects. Monitoring and digital MRV tools will absorb a rising share of each engagement budget as verifiers replace site sampling with streamed data. The main risks are further disclosure rollbacks, fraud cases that raise liability and accreditation bottlenecks. By 2035, large emitters in Europe and Asia are likely to buy verification much as they buy a financial audit.
Compliance rollout speed sets the range of outcomes
The outcome depends on how quickly new compliance schemes reach full verification cycles and whether disclosure rules keep their assurance clauses. The base case assumes CBAM verification starts on schedule in 2027 and the Asian schemes complete their first verified cycles. Further disclosure rollbacks or a weak voluntary credit market would slow growth. Faster use of Article 6 credits in national schemes and earlier reasonable assurance would lift demand above the base path.
| Scenario | CAGR, 2026–2035 | Value, 2035 | What has to hold |
|---|---|---|---|
| Downside | 10.5% | USD 44.91 billion | Disclosure rules weaken further and CBAM verification is delayed or simplified |
| Base | 13.50% | USD 57.15 billion | CBAM, China, India and Japan complete verified cycles on current schedules |
| Upside | 16.0% | USD 69.54 billion | Reasonable assurance arrives early and Article 6 credit trading scales across Asia |
Frequently Asked Questions
How big is the carbon verification market?
What do carbon verification services include?
What is third-party carbon verification?
How are carbon credits validated and verified?
Which companies provide verification and assurance?
Which region leads the market?
How does CBAM affect verification demand?
What could slow growth in this market?
Table of Content
Chapter 1 Market Segmentation
- 1.1 Segmentation Framework
- 1.1.1 Product and Service Classification
- 1.1.2 Application and End-Use Classification
- 1.1.3 Technology and Solution Classification
- 1.1.4 Customer and Distribution Channel Classification
- 1.1.5 Geographic Segmentation
- 1.1.6 Market Segment Definitions and Boundaries
- 1.2 By Offering
- 1.2.1 Monitoring and Digital MRV Technology
- 1.2.2 Verification and Assurance Services
- 1.2.3 Validation and Certification Services
- 1.3 By Program Type
- 1.3.1 Voluntary Programs
- 1.3.2 Compliance Programs
- 1.4 By Sector
- 1.4.1 Energy and Utilities
- 1.4.2 Industrial and Manufacturing
- 1.4.3 Transportation
- 1.4.4 Buildings
- 1.4.5 Agriculture and Forestry
- 1.4.6 Others
Chapter 2 Introduction
- 2.1 Report Objectives and Scope
- 2.2 Product Definition and Industry Terminology
- 2.3 Market Inclusions and Exclusions
- 2.4 Research Process
- 2.4.1 Primary Research and Expert Interviews
- 2.4.2 Secondary Research and Source Review
- 2.4.3 Top-Down and Bottom-Up Estimation
- 2.4.4 Data Triangulation and Verification
- 2.5 Market Size Measurement Basis
- 2.5.1 2025: USD 16.11 billion → 2035: USD 57.15 billion
- 2.6 Historical and Forecast Reference Periods
- 2.6.1 Historical Period: 2018-2025
- 2.6.2 Base Year: 2025
- 2.6.3 Forecast Period: 2025-2035
- 2.7 Research Assumptions and Limitations
Chapter 3 Executive Summary
- 3.1 Market Snapshot and Key Findings
- 3.2 Base-Year Market Size, 2025
- 3.3 Forecast Market Size, 2035
- 3.4 Revenue and Volume Growth Outlook
- 3.5 Key Demand and Supply Indicators
- 3.6 Leading Market Segments
- 3.7 Fastest-Growing Market Opportunities
- 3.8 Regional Performance Highlights
- 3.9 Technology and Industry Transformation
- 3.10 Competitive Landscape Summary
- 3.11 Analyst View and Strategic Implications
Chapter 4 Global Carbon Verification Market Trends and Developments
- 4.1 Historical Industry Development, 2018-2025
- 4.2 Recent Market Trends and Developments
- 4.3 Demand and Customer Behavior Trends
- 4.4 Technology and Product Innovation
- 4.5 Artificial Intelligence, Automation and Digitalization
- 4.6 Local Manufacturing and Supply Chain Realignment
- 4.7 Industry Partnerships, Mergers and Acquisitions
- 4.8 Sustainability and Circular Economy Developments
- 4.9 Government and Private Sector Investment Trends
- 4.10 Emerging Business Models and Commercialization
- 4.11 Industry Developments and Announcements
Chapter 5 Global Carbon Verification Market Production, Supply and Demand Analysis
- 5.1 Demand Trend and Consumption Analysis, 2018-2025
- 5.2 Demand Forecast, 2025-2035
- 5.3 Production and Output Trend, 2018-2025
- 5.4 Production and Output Forecast, 2025-2035
- 5.5 Installed Capacity and Capacity Utilization
- 5.6 Company-Wise Production Plants and Statistics
- 5.6.1 Installed Production Capacity
- 5.6.2 Actual Production
- 5.6.3 Planned Capacity and Expansion Targets
- 5.7 Supply Chain Structure and Procurement Trends
- 5.8 Supply-Demand Gap and Bottlenecks
- 5.9 Import Dependence and Sourcing Structure
- 5.10 Contract Manufacturing and Outsourcing
- 5.11 Regional Supply and Demand Concentration
Chapter 6 Global Carbon Verification Market Pricing Analysis
- 6.1 Pricing Structure and Measurement
- 6.2 Historical Pricing Trends, 2018-2025
- 6.3 Pricing Outlook, 2025-2035
- 6.4 Average Selling Price and Unit Economics
- 6.5 Pricing by Product and Market Segment
- 6.6 Geographic Pricing Differences
- 6.7 Key Input, Energy, Labor and Logistics Costs
- 6.8 Contract Pricing and Purchasing Models
- 6.9 Pricing Sensitivity and Competitive Positioning
- 6.10 Price, Margin and Profitability Implications
Chapter 7 Global Carbon Verification Market Dynamics
- 7.1 Market Growth Drivers
- 7.1.1 Demand-Side Drivers
- 7.1.2 Technology and Innovation Drivers
- 7.1.3 Infrastructure and Investment Drivers
- 7.1.4 Regulatory and Policy Drivers
- 7.2 Market Restraints
- 7.2.1 Cost and Affordability Constraints
- 7.2.2 Technology and Adoption Barriers
- 7.2.3 Supply Chain and Operational Constraints
- 7.3 Market Challenges
- 7.3.1 Competitive Pressure and Margin Erosion
- 7.3.2 Skills, Infrastructure and Implementation Gaps
- 7.4 Emerging Market Opportunities
- 7.5 Market Dynamics Impact and Time-Horizon Assessment
Chapter 8 Global Carbon Verification Value Chain Analysis
- 8.1 Industry Value Chain Overview
- 8.2 Upstream Suppliers and Critical Inputs
- 8.3 Technology and Component Providers
- 8.4 Manufacturing or Service Delivery
- 8.5 Distribution, Channel Partners and Integrators
- 8.6 Downstream Applications and End Users
- 8.7 Value Addition and Profit Pools
- 8.8 Vertical Integration and Outsourcing
- 8.9 Supplier Concentration and Risk
- 8.10 Supply Chain Localization and Resilience
Chapter 9 Global Carbon Verification Market Regulations and Policies
- 9.1 Relevant Laws, Standards and Compliance Frameworks
- 9.2 Product, Service, Safety and Quality Requirements
- 9.3 Government Policies, Incentives and Subsidies
- 9.4 Imports, Exports and Trade Barriers
- 9.5 Public Procurement and Local Content Requirements
- 9.6 Environmental and Sustainability Compliance
- 9.7 Data Protection, AI and Cybersecurity Compliance
- 9.8 Upcoming Policy Changes and Market Implications
Chapter 10 Global Carbon Verification Market Hotspots and Opportunities
- 10.1 Market Opportunity Mapping and Growth Hotspots
- 10.2 High-Growth Applications and Customer Groups
- 10.3 Underserved Markets and White-Space Opportunities
- 10.4 Emerging Technology and Product Opportunities
- 10.5 New Capacity and Investment Hotspots
- 10.6 Market Entry and Expansion Opportunities
- 10.7 Distribution and Partnership Opportunities
- 10.8 Near-Term and Long-Term Commercial Potential
- 10.9 Opportunity Attractiveness and Execution Risks
Chapter 11 Global Carbon Verification Market Outlook, 2025-2035
- 11.1 Market Size and Analysis
- 11.1.1 Revenue (Market Measurement: 2025: USD 16.11 billion → 2035: USD 57.15 billion)
- 11.1.2 Market Volume and Quantity Sold
- 11.1.3 Historical Market Size, 2018-2025
- 11.1.4 Base-Year Market Size, 2025
- 11.2 Market Forecast, 2025-2035
- 11.2.1 Revenue Forecast to 2035
- 11.2.2 Volume Forecast to 2035
- 11.2.3 CAGR and Year-on-Year Growth
- 11.2.4 Incremental Revenue Opportunity
- 11.3 Forecast Assumptions and Scenario Analysis
- 11.3.1 Base-Case Forecast
- 11.3.2 Optimistic and Conservative Scenarios
- 11.3.3 Technology, Pricing and Policy Sensitivities
- 11.4 Market Attractiveness and Growth Outlook
Chapter 12 Global Carbon Verification Market Segmentation and Outlook
- 12.1 Segmentation Summary and Market Shares, 2025
- 12.2 Largest and Fastest-Growing Segments
- 12.3 By Offering - Market Size and Forecast, 2025-2035
- 12.3.1 Segment Definition and Scope
- 12.3.2 Historical Market Size, 2018-2025
- 12.3.3 Revenue Forecast, 2025-2035
- 12.3.4 Volume Forecast, 2025-2035
- 12.3.5 Base-Year Market Share, 2025
- 12.3.6 Segment CAGR and Growth Drivers
- 12.3.7 Subsegment Market Size and Forecast
- 12.3.7.1 Monitoring and Digital MRV Technology
- 12.3.7.2 Verification and Assurance Services
- 12.3.7.3 Validation and Certification Services
- 12.3.8 Subsegment Pricing and Adoption Trends
- 12.3.9 Leading Suppliers and Competition
- 12.3.10 Regional Demand and Opportunities
- 12.4 By Program Type - Market Size and Forecast, 2025-2035
- 12.4.1 Segment Definition and Scope
- 12.4.2 Historical Market Size, 2018-2025
- 12.4.3 Revenue Forecast, 2025-2035
- 12.4.4 Volume Forecast, 2025-2035
- 12.4.5 Base-Year Market Share, 2025
- 12.4.6 Segment CAGR and Growth Drivers
- 12.4.7 Subsegment Market Size and Forecast
- 12.4.7.1 Voluntary Programs
- 12.4.7.2 Compliance Programs
- 12.4.8 Subsegment Pricing and Adoption Trends
- 12.4.9 Leading Suppliers and Competition
- 12.4.10 Regional Demand and Opportunities
- 12.5 By Sector - Market Size and Forecast, 2025-2035
- 12.5.1 Segment Definition and Scope
- 12.5.2 Historical Market Size, 2018-2025
- 12.5.3 Revenue Forecast, 2025-2035
- 12.5.4 Volume Forecast, 2025-2035
- 12.5.5 Base-Year Market Share, 2025
- 12.5.6 Segment CAGR and Growth Drivers
- 12.5.7 Subsegment Market Size and Forecast
- 12.5.7.1 Energy and Utilities
- 12.5.7.2 Industrial and Manufacturing
- 12.5.7.3 Transportation
- 12.5.7.4 Buildings
- 12.5.7.5 Agriculture and Forestry
- 12.5.7.6 Others
- 12.5.8 Subsegment Pricing and Adoption Trends
- 12.5.9 Leading Suppliers and Competition
- 12.5.10 Regional Demand and Opportunities
- 12.6 Segment Growth Comparison
- 12.7 Segment Attractiveness and Priority Matrix
Chapter 13 Global Carbon Verification Geographic Market Outlook, 2025-2035
- 13.1 Regional Market Size and Share, 2025
- 13.2 Regional Market Forecast, 2025-2035
- 13.3 Regional Pricing, Production and Demand Differences
- 13.4 North America
- 13.4.1 United States
- 13.4.2 Canada
- 13.4.3 Mexico
- 13.5 Europe
- 13.5.1 Germany
- 13.5.2 France
- 13.5.3 Italy
- 13.5.4 United Kingdom
- 13.5.5 Spain
- 13.5.6 Poland
- 13.5.7 Russia
- 13.5.8 Netherlands
- 13.5.9 Belgium
- 13.5.10 Sweden
- 13.5.11 Denmark
- 13.5.12 Norway
- 13.5.13 Rest of Europe
- 13.6 Asia Pacific
- 13.6.1 China
- 13.6.2 India
- 13.6.3 Japan
- 13.6.4 South Korea
- 13.6.5 Thailand
- 13.6.6 Indonesia
- 13.6.7 Vietnam
- 13.6.8 Malaysia
- 13.6.9 Australia
- 13.6.10 Rest of Asia Pacific
- 13.7 Latin America
- 13.7.1 Brazil
- 13.7.2 Argentina
- 13.7.3 Colombia
- 13.7.4 Chile
- 13.7.5 Rest of Latin America
- 13.8 Middle East
- 13.8.1 Saudi Arabia
- 13.8.2 United Arab Emirates
- 13.8.3 Turkey
- 13.8.4 Israel
- 13.8.5 Iran
- 13.8.6 Rest of the Middle East
- 13.9 Africa
- 13.9.1 South Africa
- 13.9.2 Egypt
- 13.9.3 Nigeria
- 13.9.4 Morocco
- 13.9.5 Rest of Africa
- 13.10 Regional Investment, Policy and Supply Chain Differences
- 13.11 Regional Competitive Landscape
- 13.12 Geographic Growth Hotspots
Chapter 14 Global Carbon Verification Technology, Innovation and Sustainability Outlook
- 14.1 Technology Landscape and Maturity
- 14.2 Product, Process and Service Innovation
- 14.3 AI, Automation and Digital Tools in the Industry
- 14.4 Technology Adoption and Performance Benchmarking
- 14.5 Innovation Pipeline and R&D Investment
- 14.6 Patent and Intellectual Property Trends
- 14.7 Energy Efficiency and Resource Management
- 14.8 Sustainability, Recycling and Circularity
- 14.9 Technology Roadmap, 2025-2035
- 14.10 Risks of Obsolescence and Technology Substitution
Chapter 15 Global Carbon Verification Market Key Strategic Imperatives
- 15.1 Growth and Market Entry Priorities
- 15.2 High-Return Products and Segments
- 15.3 Pricing, Profitability and Cost Optimization
- 15.4 Technology Investment and Product Differentiation
- 15.5 Supply Chain Localization and Resilience
- 15.6 Distribution and Customer Acquisition
- 15.7 Partnership, Acquisition and Capacity Strategy
- 15.8 Regional Expansion Priorities
- 15.9 Short-, Medium- and Long-Term Actions
Chapter 16 Competition Outlook
- 16.1 Industry Competition Characteristics
- 16.2 Market Structure and Concentration
- 16.3 Market Share and Competitive Positioning, 2025
- 16.4 Company-Wise Revenue and Product Benchmarking
- 16.5 Production and Service Capacity Benchmarking
- 16.6 Technology, Pricing and Differentiation
- 16.7 Regional Footprint and Distribution Strength
- 16.8 Mergers, Acquisitions and Strategic Alliances
- 16.9 New Entrants and Competitive Threats
- 16.10 Porter's Five Forces and Industry Attractiveness
- 16.11 Competitive Outlook, 2025-2035
Chapter 17 Company Profiles
- 17.1 Company Coverage and Selection Criteria
- 17.2 DNV AS
- 17.2.1 Business Description
- 17.2.2 Company Ownership and Geographic Presence
- 17.2.3 Product and Service Portfolio
- 17.2.4 Manufacturing and Operating Footprint
- 17.2.5 Production Capacity and Expansion Plans
- 17.2.6 Financial Performance and Investment
- 17.2.7 Market Share and Competitive Position
- 17.2.8 Technology and Innovation Capabilities
- 17.2.9 Strategic Alliances or Partnerships
- 17.2.10 Recent Developments
- 17.2.11 Growth Strategy and Outlook
- 17.3 Bureau Veritas SA
- 17.4 SGS SA
- 17.5 TÜV SÜD AG
- 17.6 TÜV Rheinland AG
- 17.7 Intertek Group plc
- 17.8 LRQA
- 17.9 SCS Global Services
- 17.10 KPMG International
- 17.11 PricewaterhouseCoopers International Limited (PwC)
- 17.12 Ernst & Young Global Limited (EY)
- 17.13 Other Relevant Market Participants
Note: Every listed company is profiled on the structure shown under the first company. The company list is preliminary and may change based on research findings, market developments, data availability and client requirements.
Chapter 18 Disclaimer
- 18.1 Research and Forecast Disclaimer
- 18.2 Data Source and Estimation Limitations
Note: The depth of individual sections depends on data availability for this market. Volume, capacity, trade and other unit-based metrics are included where applicable.

