
Market Overview
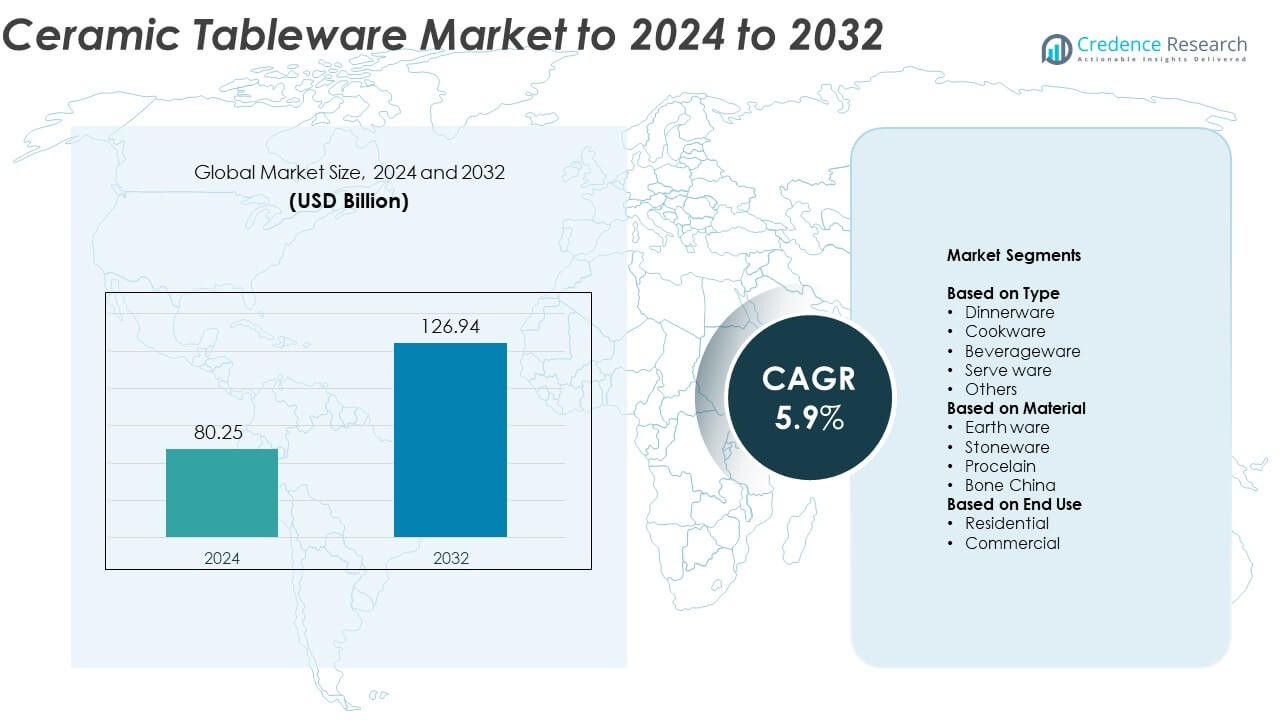
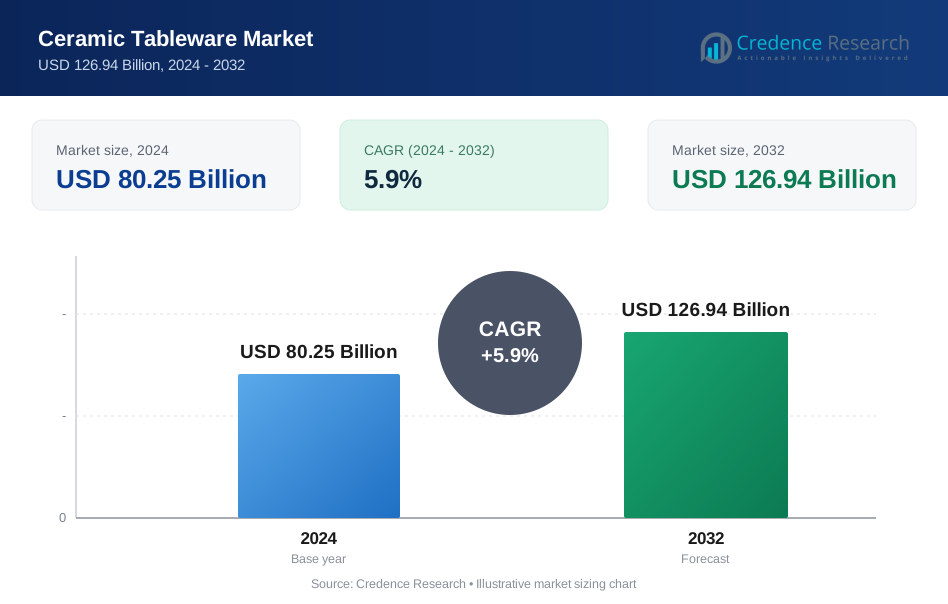
The Ceramic Tableware Market size was valued at USD 80.25 Billion in 2024 and is anticipated to reach USD 126.94 Billion by 2032, at a CAGR of 5.9% during the forecast period.
| REPORT ATTRIBUTE | DETAILS |
|---|---|
| Historical Period | 2020-2023 |
| Base Year | 2024 |
| Forecast Period | 2025-2032 |
| Ceramic Tableware Market Size 2024 | USD 80.25 Billion |
| Ceramic Tableware Market, CAGR | 5.9% |
| Ceramic Tableware Market Size 2032 | USD 126.94 Billion |
The ceramic tableware market features strong participation from major players such as Villeroy & Boch, Denby Pottery Company, Corelle Brands, Rosenthal GmbH, Arabia, and Steelite. These companies focus on quality craftsmanship, modern designs, and sustainable production practices to meet evolving consumer preferences. North America leads the market with around 34% share in 2024, supported by high household spending and an expanding hospitality industry. Europe follows with about 28% share, driven by established luxury brands and strong cultural ties to fine dining. Asia-Pacific, holding nearly 27% share, remains the fastest-growing region due to large-scale production, urbanization, and rising consumer incomes.
Market Insights
- The ceramic tableware market was valued at USD 80.25 Billion in 2024 and is projected to reach USD 126.94 Billion by 2032, growing at a CAGR of 5.9%.
- Rising demand for premium and stylish tableware, coupled with increasing hospitality sector expansion, is driving steady market growth across both residential and commercial applications.
- Sustainable production methods and growing interest in artisanal and handmade ceramics are key trends shaping product innovation and consumer preference.
- The market is moderately fragmented, with global and regional players competing through design innovation, material quality, and sustainability-driven differentiation.
- North America leads with 34% share, followed by Europe at 28% and Asia-Pacific at 27%, while dinnerware remains the top segment, holding about 44% share of the overall market.
Market Segmentation Analysis:
By Type
Dinnerware dominates the ceramic tableware market, accounting for nearly 44% share in 2024. Its dominance is driven by extensive use in households, restaurants, and hospitality establishments. The rising trend of premium dining culture and the growing popularity of home décor-driven dining sets further boost demand. Manufacturers focus on aesthetic designs, durability, and dishwasher-safe features, strengthening adoption across both residential and commercial spaces. Cookware and beverageware segments are expanding steadily due to innovations in heat-resistant and lightweight materials catering to modern kitchen preferences.
- For instance, RAK Porcelain lifted tableware capacity to 34–36 million pieces annually in 2024.
By Material
Porcelain leads the market with around 39% share in 2024, owing to its superior finish, translucence, and high durability. Its popularity stems from wide acceptance in premium restaurants and high-end households. The growing preference for luxurious and elegant table settings supports porcelain’s dominance. Stoneware follows due to its strength and affordability, appealing to mid-range consumers. Continuous advancements in glazing and eco-friendly production techniques also drive material innovation, ensuring sustainable growth across product lines.
- For instance, the Fiesta Tableware Company produces approximately 3,000 dozen to 5,000 dozen dishes per week at its West Virginia plant, which is roughly 60,000 pieces per day.
By End Use
The residential segment holds the largest market share of approximately 61% in 2024. Growth is supported by rising urbanization, increasing disposable incomes, and lifestyle shifts favoring home dining experiences. Consumers are investing in stylish, coordinated tableware sets that reflect modern aesthetics and functionality. Online retail expansion and growing awareness of ceramic durability further accelerate residential demand. The commercial segment continues to gain traction through the hospitality sector’s expansion, including hotels, cafés, and catering services emphasizing design consistency and quality presentation.
Key Growth Drivers
Rising Demand for Premium and Aesthetic Tableware
The growing consumer inclination toward elegant, durable, and design-oriented ceramic tableware is a major driver. Urban households and hospitality sectors increasingly favor high-quality products that enhance dining experiences. Rising disposable incomes and the popularity of home décor trends further stimulate demand for luxury and handcrafted ceramic collections. Manufacturers are introducing new designs and glazing technologies to cater to style-conscious consumers, strengthening the premiumization trend in both residential and commercial segments.
- For instance, Villeroy & Boch is now active in around 140 markets worldwide and has approximately 12,000 employees globally, as of its 2024 annual reports and 2025 press releases.
Expansion of the Hospitality and Foodservice Sector
Rapid growth in the hospitality and foodservice industries is fueling market expansion. Restaurants, hotels, and catering businesses are investing in durable, heat-resistant, and visually appealing ceramic tableware to enhance presentation. Global tourism recovery and rising café culture encourage bulk procurement of standardized designs. The increasing focus on aesthetic dining experiences across luxury and mid-tier establishments continues to boost steady demand for ceramic tableware across developed and emerging economies.
- For instance, Steelite manufactures ~500,000 tableware pieces weekly and ships to 140+ countries.
Advancements in Manufacturing and Sustainable Materials
Innovations in ceramic production processes, such as improved kiln technologies and energy-efficient glazing, are key contributors to market growth. Manufacturers are increasingly adopting eco-friendly raw materials and water-saving techniques to align with sustainability goals. The development of lightweight and chip-resistant ceramics enhances usability and lifespan, attracting both consumers and commercial buyers. These technological and environmental advancements improve product quality, cost efficiency, and environmental compliance, driving broader market adoption.
Key Trends & Opportunities
Growth of Online and Omnichannel Retail
The surge in e-commerce platforms is reshaping ceramic tableware distribution. Consumers prefer online shopping due to access to diverse designs, competitive pricing, and home delivery options. Brands are expanding their digital presence through direct-to-consumer models and collaborations with online retailers. Enhanced visualization tools and virtual catalogs support customer engagement, offering opportunities for manufacturers to reach global markets while optimizing inventory and logistics through data-driven insights.
- For instance, Maisons du Monde reported that online sales accounted for 30.9% of its total sales in Q2 2023.
Shift Toward Sustainable and Artisanal Products
Rising environmental awareness is boosting demand for eco-friendly, handmade, and locally sourced ceramic products. Consumers increasingly choose lead-free, recyclable, and ethically produced tableware. Artisanal ceramics, characterized by unique designs and cultural craftsmanship, appeal to niche and premium buyers. This trend encourages small-scale producers and global brands alike to adopt sustainable practices, enhancing their market positioning and brand value in an environmentally conscious marketplace.
- For instance, Denby treats ~20 million litres of process water and recycles 100,000 litres of glaze yearly.
Key Challenges
High Production Costs and Energy Dependence
Ceramic tableware manufacturing requires significant energy for firing and glazing, making production costs sensitive to fuel and electricity price fluctuations. The expense of maintaining quality control and skilled labor also increases overall operational costs. These factors limit profit margins and hinder scalability, particularly for small and medium-sized producers. Manufacturers are exploring renewable energy sources and process optimization to mitigate these challenges and maintain competitiveness.
Competition from Substitute Materials
Alternative materials such as glass, stainless steel, and melamine present strong competition to ceramic products. These substitutes offer durability, lightweight handling, and lower cost, making them attractive to both residential and commercial users. The challenge intensifies as new materials incorporate appealing designs and colors that rival ceramics. To sustain market relevance, ceramic producers focus on product differentiation through design innovation, sustainability credentials, and premium quality assurance.
Regional Analysis
North America
North America holds the largest share of about 34% in the ceramic tableware market in 2024. Growth is supported by high consumer spending on home décor and dining aesthetics. The strong presence of hospitality chains and premium restaurant culture further enhances product adoption. Manufacturers emphasize innovative designs and durable materials to match the region’s preference for luxury and sustainability. The increasing trend of home dining and e-commerce retail channels also boosts sales, particularly in the United States and Canada, where premium ceramic dinnerware enjoys consistent demand across both residential and commercial sectors.
Europe
Europe accounts for nearly 28% share of the ceramic tableware market in 2024, driven by strong cultural ties to fine dining and artisanal craftsmanship. Countries like Germany, France, and the United Kingdom lead with high consumption of premium and designer ceramics. Sustainability-focused consumers increasingly prefer eco-friendly materials and ethically sourced products. The region’s established hospitality and tourism sectors further support market growth. Rising demand for handmade and locally produced tableware continues to strengthen Europe’s position as a key hub for both traditional and modern ceramic innovations.
Asia-Pacific
Asia-Pacific represents around 27% share of the ceramic tableware market in 2024 and is the fastest-growing region. Expanding middle-class income, urbanization, and growth in restaurant culture drive regional demand. China, Japan, and India dominate production and consumption due to strong manufacturing capabilities and local cultural use of ceramics. The rise of e-commerce platforms and affordable product ranges also expand consumer reach. Increasing export opportunities and government support for sustainable manufacturing enhance competitiveness, making Asia-Pacific a critical hub for global ceramic tableware production and innovation.
Latin America
Latin America captures nearly 7% share of the ceramic tableware market in 2024. Market growth is supported by expanding urban populations and growing interest in premium lifestyle products. Brazil and Mexico lead regional consumption due to a rise in middle-income households and hospitality development. Increasing adoption of Western dining trends and the popularity of artisanal designs strengthen regional demand. Local manufacturers focus on cost-effective production while importing advanced ceramic technologies to improve product quality and aesthetic appeal across residential and commercial applications.
Middle East & Africa
The Middle East & Africa hold about 4% share in the ceramic tableware market in 2024. Growth is driven by rapid expansion in the hospitality and tourism industries, especially in the United Arab Emirates and Saudi Arabia. Rising demand for elegant and high-quality dining ware in hotels, restaurants, and luxury homes supports market development. The growing expatriate population and increasing investment in retail and catering sectors further contribute to regional sales. Imported premium brands and growing local ceramic production are enhancing availability across diverse consumer segments.
Market Segmentations:
By Type
- Dinnerware
- Cookware
- Beverageware
- Serve ware
- Others
By Material
- Earth ware
- Stoneware
- Procelain
- Bone China
By End Use
- Residential
- Commercial
By Geography
- North America
- U.S.
- Canada
- Mexico
- Europe
- Germany
- France
- U.K.
- Italy
- Spain
- Rest of Europe
- Asia Pacific
- China
- Japan
- India
- South Korea
- South-east Asia
- Rest of Asia Pacific
- Latin America
- Brazil
- Argentina
- Rest of Latin America
- Middle East & Africa
- GCC Countries
- South Africa
- Rest of the Middle East and Africa
Competitive Landscape
The competitive landscape of the ceramic tableware market includes prominent players such as Villeroy & Boch, Denby Pottery Company, Corelle Brands, Rosenthal GmbH, Arabia, Steelite, Portmeirion Group, Royal Doulton, Fiskars Group, Lenox Corporation, Mikasa, Noritake Co., Ltd., Spode, Churchill China PLC, and Royal Worcester. The market is characterized by a blend of global manufacturers and regional producers focusing on design innovation, product quality, and sustainability. Leading companies emphasize durable, aesthetic, and eco-friendly offerings to meet evolving consumer preferences. Continuous investments in automated production, new glazing techniques, and energy-efficient processes support operational efficiency and consistency. The shift toward premium and artisanal collections, coupled with strategic collaborations across retail and hospitality sectors, strengthens market presence. Digital sales channels and customization options are gaining importance as brands expand their reach through e-commerce and omnichannel strategies. The competition remains intense, driven by design differentiation, brand heritage, and sustainability-focused innovation.
Key Player Analysis
- Villeroy & Boch
- Denby Pottery Company
- Corelle Brands
- Rosenthal GmbH
- Arabia
- Steelite
- Portmeirion Group
- Royal Doulton
- Fiskars Group
- Lenox Corporation
- Mikasa
- Noritake Co., Ltd.
- Spode
- Churchill China PLC
- Royal Worcester
Recent Developments
- In 2025, Spode's parent company, the Portmeirion Group, announced an increased focus and investment to bring a substantial portion of its ceramic production back to Stoke-on-Trent, UK, over the next 24 months.
- In 2025, Rosenthal GmbH Launched “Rosenthal meets Versace” children’s tableware sets. Designs include Barocco Rose/Blue and Medusa Gala.
- In 2023, Steelite International acquired Diversified Ceramics Corporation, a strategic move aimed at expanding its ovenware and specialty product offerings for the global hospitality sector.
Report Coverage
The research report offers an in-depth analysis based on Type, Material, End-Use and Geography. It details leading market players, providing an overview of their business, product offerings, investments, revenue streams, and key applications. Additionally, the report includes insights into the competitive environment, SWOT analysis, current market trends, as well as the primary drivers and constraints. Furthermore, it discusses various factors that have driven market expansion in recent years. The report also explores market dynamics, regulatory scenarios, and technological advancements that are shaping the industry. It assesses the impact of external factors and global economic changes on market growth. Lastly, it provides strategic recommendations for new entrants and established companies to navigate the complexities of the market.
Future Outlook
- The market will continue to expand with steady demand from residential and hospitality sectors.
- Growing consumer preference for premium and designer ceramic tableware will boost sales.
- Sustainable and eco-friendly production practices will gain higher importance among manufacturers.
- E-commerce and omnichannel retail platforms will enhance product visibility and accessibility.
- Technological innovations in glazing and lightweight materials will improve product performance.
- Asia-Pacific will strengthen its position as a major production and export hub.
- Customization and limited-edition collections will attract high-end consumers globally.
- Rising urban lifestyles will drive consistent replacement demand for tableware products.
- Partnerships between global brands and local artisans will promote design diversity.
- Increased use of digital marketing and virtual product showcasing will enhance global competitiveness.
Request a Free Sample
Fill in your details and we'll send you a free sample report.
- Sample data tables & charts
- Research methodology
Need a Custom Version of This Report?
Tailor the scope, geography, or segments to your exact requirements.
- Custom geography or segment scope
- Direct access to our analyst team
Frequently Asked Questions
What is the current market size for Ceramic Tableware Market, and what is its projected size in 2032?
At what Compound Annual Growth Rate is the Ceramic Tableware Market projected to grow between 2025 and 2032?
Which Ceramic Tableware Market segment held the largest share in 2024?
What are the primary factors fueling the growth of the Ceramic Tableware Market?
Who are the leading companies in the Ceramic Tableware Market?
Which region commanded the largest share of the Ceramic Tableware Market in 2024?
Table of Content
Chapter 1. Report Introduction
- 1.1 Report Description & Purpose
- 1.1.1 Report Title & Market Definition
- 1.1.2 Unique Selling Propositions (USP) & Key Differentiators
- 1.1.3 Value Proposition for Stakeholders
- 1.2 Research Objectives
- 1.2.1 Market Sizing Objectives (Volume & Revenue) (Volume Where Applicable)
- 1.2.2 Segmentation Objectives
- 1.2.3 Competitive Intelligence Objectives
- 1.2.4 Forecast & Scenario Objectives
- 1.3 Report Scope
- 1.3.1 Ceramic Tableware Scope – Segments & Subsegments Covered
- 1.3.2 Geographic Scope – Regions & Countries Covered
- 1.3.3 Historical Period, Base Year & Forecast Period (2024; forecast to 2032)
- 1.3.4 Inclusions & Exclusions
- 1.4 Industry Classification & Applicable Codes
- 1.5 Currency, Measurement Units & Valuation Basis
- 1.6 Target Stakeholders
- 1.7 Limitations & Assumptions
Chapter 2. Executive Summary
- 2.1 Global Ceramic Tableware Market Snapshot
- 2.1.1 Market Size – Historical (2024) & Forecast (2024-2032) (2024: USD 80.25 Billion → 2032: USD 126.94 Billion)
- 2.1.2 Volume & Revenue – Global Totals (Volume Where Applicable)
- 2.1.3 Key Market Highlights – Top Five Facts
- 2.2 Ceramic Tableware Market Segmentation Snapshot
- 2.2.1 Market Split by Region – 2024 vs. 2032
- 2.3 Competitive Snapshot
- 2.3.1 Top 10 Players by Revenue Share – 2024
- 2.3.2 Top 10 Players by Volume Share – 2024 (Volume Where Applicable)
- 2.3.3 Recent Strategic Developments (18-Month Summary)
- 2.4 Key Investment Highlights & Strategic Conclusions
Chapter 3. Ceramic Tableware Market Dynamics & Industry Analysis
- 3.1 Market Overview & Context
- 3.1.1 Ceramic Tableware Market Position in the Broader Industry Value Chain
- 3.1.2 Demand Structure & Purchasing Dynamics
- 3.1.3 Market Maturity & Development Stage by Region
- 3.2 Ceramic Tableware Market Drivers
- 3.3 Ceramic Tableware Market Restraints & Challenges
- 3.4 Ceramic Tableware Market Opportunities
- 3.5 Porter's Five Forces Analysis
- 3.5.1 Threat of New Entrants
- 3.5.2 Bargaining Power of Suppliers
- 3.5.3 Bargaining Power of Buyers
- 3.5.4 Threat of Substitutes
- 3.5.5 Competitive Rivalry – Intensity Assessment
- 3.6 Ceramic Tableware Value Chain Analysis
- 3.6.1 Upstream – Key Inputs, Resources & Suppliers
- 3.6.1.1 Key Input/Resource 1
- 3.6.1.2 Key Input/Resource 2
- 3.6.1.3 Key Input/Resource 3
- 3.6.2 Midstream – Core Operations & Value Creation
- 3.6.2.1 Operating Model & Process Overview
- 3.6.2.2 Key Operating Locations & Capabilities by Company
- 3.6.3 Downstream – Market Channels & End Users
- 3.6.3.1 Direct Sales & Customer Engagement Channels
- 3.6.3.2 Indirect Sales, Intermediaries & Partner Channels
- 3.6.4 Value Chain Profitability Analysis
- 3.6.1 Upstream – Key Inputs, Resources & Suppliers
- 3.7 PESTEL Analysis
- 3.7.1 Political Factors
- 3.7.2 Economic Factors
- 3.7.3 Social Factors
- 3.7.4 Technological Factors
- 3.7.5 Environmental Factors
- 3.7.6 Legal Factors
- 3.8 Ceramic Tableware Supply Chain Analysis
- 3.8.1 Critical Input & Resource Availability Risk Assessment
- 3.8.2 Supplier & Operational Concentration Risk (Geographic Exposure)
- 3.8.3 Supply & Service Disruption Impact Analysis
- 3.9 Regulatory & Policy Landscape
Note: The regulatory and policy landscape section covers regulations based on their applicability to the market, Ceramic Tableware category, geography, and scope of the study. Only regulatory frameworks with a material impact on operations, compliance, trade, sustainability, or market access are analyzed in detail.
Chapter 4. Key Investment Pockets & Opportunity Analysis
- 4.1 Ceramic Tableware Market Attractiveness Analysis
- 4.1.1 By Region – Investment Attractiveness Matrix (Market Size × CAGR)
- 4.2 Absolute Revenue Growth Opportunity
- 4.2.1 By Region – Absolute Revenue Growth Through 2032
- 4.3 Incremental Demand Opportunity
- 4.3.1 By Region – Incremental Demand Through 2032
- 4.3.2 Segment – Incremental Demand
- 4.4 Emerging Submarket Opportunity Deep Dive (Subject to Applicability)
- 4.5 Priority Market Opportunity Scorecards
- 4.5.1 United States
- 4.5.2 Europe
- 4.5.3 Asia
- 4.5.4 Middle East & Africa
Note: Priority market opportunity scorecards reflect the geographic scope and strategic relevance of the study. Listed markets are indicative and may be adapted to the industry.
Chapter 5. Ceramic Tableware Cross-Border Trade & Market Access Analysis
- 5.1 International Trade & Cross-Border Activity Overview
- 5.1.1 Global Export Value by Country (2024)
- 5.1.2 Global Export Volume by Country (2024) (Volume Where Applicable)
- 5.1.3 Global Import Value by Country (2024)
- 5.1.4 Global Import Volume by Country (2024) (Volume Where Applicable)
- 5.1.5 Net Trade Balance by Country (2024)
- 5.2 Export Analysis – Segment
- 5.2.1 Category 1 (Applicable Classification Code)
- 5.2.2 Category 2 (Applicable Classification Code)
- 5.2.3 Category 3 (Applicable Classification Code)
- 5.2.4 Category 4 (Applicable Classification Code)
- 5.2.5 Category 5 (Applicable Classification Code)
- 5.3 Import Analysis – Segment
- 5.3.1 Category 1 (Applicable Classification Code)
- 5.3.2 Category 2 (Applicable Classification Code)
- 5.3.3 Category 3 (Applicable Classification Code)
- 5.3.4 Category 4 (Applicable Classification Code)
- 5.3.5 Category 5 (Applicable Classification Code)
- 5.4 Cross-Border Pricing & Transaction Benchmarks
- 5.4.1 Export Pricing – Segment & Country
- 5.4.2 Import Pricing – Segment & Source Country
- 5.4.3 Price Trends (2024)
- 5.5 Key Cross-Border Trade & Delivery Routes
- 5.5.1 Cross-Border Trade/Delivery Route 1
- 5.5.2 Cross-Border Trade/Delivery Route 2
- 5.5.3 Cross-Border Trade/Delivery Route 3
- 5.5.4 Cross-Border Trade/Delivery Route 4
- 5.5.5 Cross-Border Trade/Delivery Route 5
- 5.6 Trade Policy & Market Access Impact Assessment
- 5.6.1 Tariff & Non-Tariff Barriers
- 5.6.2 Regional Trade & Economic Integration Frameworks
- 5.6.3 Bilateral & Multilateral Trade Agreements
- 5.6.4 Cross-Border Operating, Licensing & Localization Requirements
Note: This chapter applies where cross-border trade or delivery is relevant to Ceramic Tableware. Goods, services, and digital offerings are assessed using applicable classifications and transaction measures. Import-export volumes, trade balances, and route analyses are included only where meaningful to the market.
Chapter 6. Competitive Landscape & Company Benchmarking
- 6.1 Ceramic Tableware Market Concentration & Structure
- 6.1.1 Herfindahl-Hirschman Index (HHI) – vs. 2024
- 6.1.2 Leading, Mid-Sized & Emerging Player Structure
- 6.1.3 Global, Regional & Local Player Dynamics
- 6.2 Ceramic Tableware Market Share Analysis – 2024
- 6.2.1 Global Revenue Share by Company
- 6.2.2 Global Volume Share by Company (Volume Where Applicable)
- 6.2.3 Regional Revenue Share
- 6.2.4 Market Share Evolution ( vs. 2024)
- 6.2.5 Company Market Share by Key Segment
- 6.2.6 Company Market Share by Customer Group
- 6.3 Operating Scale, Capacity & Infrastructure Analysis
- 6.3.1 Global Operating Scale & Supply Capacity
- 6.3.2 Resource Utilization & Operating Efficiency
- 6.3.3 Output, Service Delivery & Activity Metrics
- 6.3.4 Operating Footprint & Infrastructure Map
- 6.3.5 Planned Operational & Capacity Expansion
- 6.4 Ceramic Tableware Competitive Benchmarking Matrix
- 6.4.1 Revenue, Growth, Profitability & Operating Metric Comparison
- 6.4.2 Channel Revenue Mix
- 6.4.3 Geographic Revenue Exposure
- 6.4.4 R&D Intensity
- 6.4.5 Sustainability Maturity
- 6.5 Strategic Developments in Ceramic Tableware (Last 24 Months)
- 6.5.1 Mergers, Acquisitions & Divestments
- 6.5.2 New Products, Services & Solutions in Ceramic Tableware
- 6.5.3 Operational & Infrastructure Expansions
- 6.5.4 Strategic Alliances, Joint Ventures & Partnerships
- 6.5.5 Distribution Expansion & Market Entry
- 6.5.6 Sustainability & ESG Initiatives
- 6.6 Competitive Strategy Mapping
- 6.6.1 Leader, Challenger, Follower & Niche Classification
- 6.6.2 Pricing Strategy Comparison
- 6.6.3 Channel Strategy Matrix
Note: Strategic developments are included based on their materiality and the availability of reliable information.
Chapter 7. Global Ceramic Tableware Market – By Sales & Delivery Channel
- 7.1 Segment Overview
- 7.1.1 Volume & Revenue Split by Channel (2024 & 2032) (Volume Where Applicable)
- 7.1.2 Channel Mix Evolution (2024-2032)
Chapter 8. Regional Market Analysis – Global Overview
- 8.1 Global Regional Overview
- 8.1.1 Regional Volume Share (Volume Where Applicable)
- 8.1.2 Regional Revenue Share
- 8.1.3 Regional Volume by Region (Volume Where Applicable)
- 8.1.4 Regional Revenue by Region
- 8.1.5 Regional Forecast Through 2032
- 8.2 Cross-Regional Segment Analysis
- 8.2.1 By Sales & Delivery Channel
- 8.2.2 By Competitive Positioning & Price Tier
Chapter 9. North America Ceramic Tableware Market
- 9.1 United States
- 9.2 Canada
- 9.3 Mexico
Chapter 10. Europe Ceramic Tableware Market
- 10.1 Germany
- 10.2 France
- 10.3 Italy
- 10.4 United Kingdom
- 10.5 Spain
- 10.6 Poland
- 10.7 Russia
- 10.8 Netherlands
- 10.9 Belgium
- 10.10 Sweden
- 10.11 Denmark
- 10.12 Norway
- 10.13 Rest of Europe
Chapter 11. Asia Pacific Ceramic Tableware Market
- 11.1 China
- 11.2 India
- 11.3 Japan
- 11.4 South Korea
- 11.5 Thailand
- 11.6 Indonesia
- 11.7 Vietnam
- 11.8 Malaysia
- 11.9 Australia
- 11.10 Rest of Asia Pacific
Chapter 12. Latin America Ceramic Tableware Market
- 12.1 Brazil
- 12.2 Argentina
- 12.3 Colombia
- 12.4 Chile
- 12.5 Rest of Latin America
Chapter 13. Middle East Ceramic Tableware Market
- 13.1 Saudi Arabia
- 13.2 United Arab Emirates
- 13.3 Turkey
- 13.4 Israel
- 13.5 Iran
- 13.6 Rest of the Middle East
Chapter 14. Africa Ceramic Tableware Market
- 14.1 South Africa
- 14.2 Egypt
- 14.3 Nigeria
- 14.4 Morocco
- 14.5 Rest of Africa
Chapter 15. Ceramic Tableware Company Profiles
- 15.1 [Company 01]
- 15.1.1 Company Overview
- 15.1.2 Key Management Personnel
- 15.1.3 Products & Services Portfolio
- 15.1.4 Financial Performance
- 15.1.5 Key Market Focus & Geographic Presence
- 15.1.6 Recent Developments & Strategic Initiatives
Note: The company profile list is preliminary and may change based on research findings, market developments, data availability, and client requirements.
Chapter 16. Appendices
- Appendix A – List of Abbreviations & Acronyms
- Appendix B – Industry Classification Code Reference – Full Series
- Appendix C – Supply, Output & Operating Capacity Data Tables
- Appendix D – End-Use & Demand Base Tables
- Appendix E – Demand, Adoption & Usage Assumptions
- Appendix F – Pricing & Revenue Metric Reference Tables
- Appendix G – Company Operations & Infrastructure Database
- Appendix H – Cross-Border Trade & Activity Data Tables (Where Applicable)
- Appendix I – Regulatory Summary Tables
- Appendix J – Primary Research Participant List (Anonymized)
- Appendix K – Primary Research Questionnaire Framework
- Appendix L – Data Sources & Bibliography
- Appendix M – Market Size Divergence & Source Comparison
Chapter 17. Research Methodology
- 17.1 Research Framework & Philosophy
- 17.2 Secondary Research – Sources, Hierarchy & Data Extraction
- 17.3 Data Modeling – Bottom-Up & Top-Down Market Sizing
- 17.4 Primary Research – Stakeholder Framework, LOI & Sample Sizes
- 17.5 Forecast Methodology – Regression, Scenario & Sensitivity Analysis
- 17.6 Quality Control – Four-Layer Validation Framework
- 17.7 Limitations & Standard Assumptions
- 17.8 Disclaimer
