
Market overview
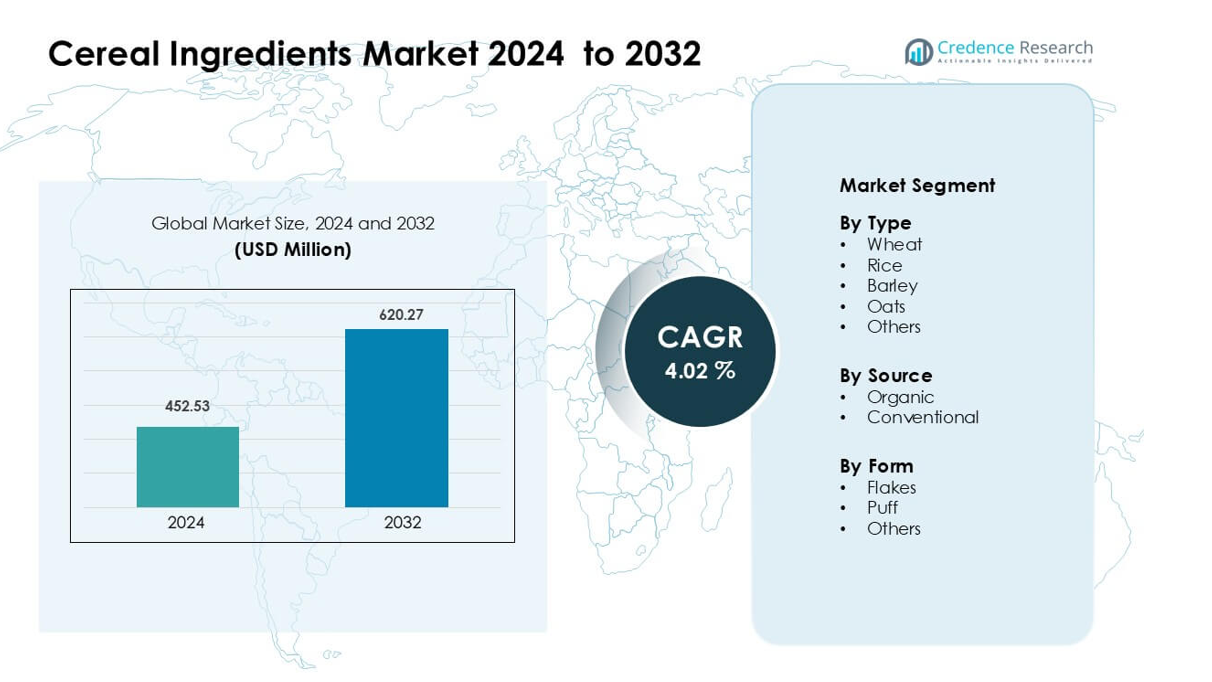
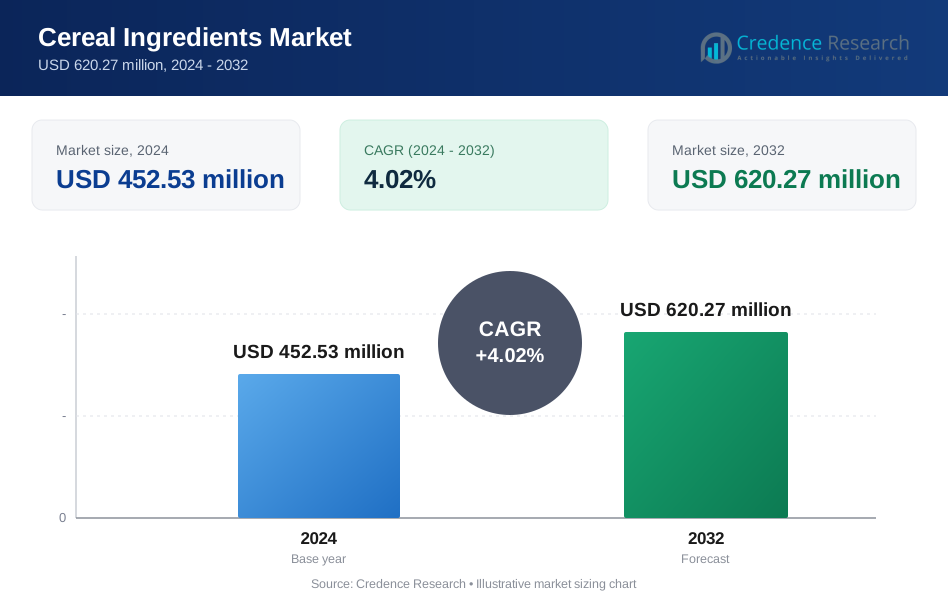
Cereal Ingredients Market was valued at USD 452.53 million in 2024 and is anticipated to reach USD 620.27 million by 2032, growing at a CAGR of 4.02% during the forecast period.
| REPORT ATTRIBUTE | DETAILS |
|---|---|
| Historical Period | 2020-2023 |
| Base Year | 2024 |
| Forecast Period | 2025-2032 |
| Cereal Ingredients Market Size 2024 | USD 452.53 million |
| Cereal Ingredients Market, CAGR | 4.02% |
| Cereal Ingredients Market Size 2032 | USD 620.27 million |
The Cereal Ingredients Market is shaped by major players such as Cll Foods, General Mills, Bunge Limited, SunOpta Inc., ADM, Associated British Foods Plc, Cargill Inc., RiceBran Technologies, and Kellogg’s. These companies compete by expanding whole-grain, high-fiber, and organic ingredient portfolios while investing in sustainable sourcing and advanced processing technologies. North America remains the leading region, holding about 34% share in 2024, supported by high demand for ready-to-eat cereals, strong retail penetration, and growing preference for fortified and clean-label grain ingredients across mainstream and premium product categories.
Market Insights
- The Cereal Ingredients Market reached USD 452.53 million in 2024 and is projected to grow at a CAGR of 4.02% through 2032, driven by rising demand for nutritious and convenient grain-based products.
- Growth is supported by strong consumer interest in high-fiber, whole-grain, and clean-label formulations, pushing demand for wheat, oats, and rice ingredients across breakfast cereals and snack applications.
- Key trends include rapid expansion of organic and fortified cereal ingredients, increasing use of ancient grains, and innovation in functional blends enriched with protein, probiotics, and natural antioxidants.
- Competition intensifies as major players such as Cll Foods, General Mills, Bunge Limited, SunOpta Inc., ADM, Associated British Foods Plc, Cargill Inc., RiceBran Technologies, and Kellogg’s invest in sustainability, advanced processing, and supply-chain traceability.
- North America leads the market with about 34% share, while flakes dominate the form segment with nearly 58% share; Asia Pacific shows the fastest growth due to rising urban consumption and affordable instant cereal launches.
Market Segmentation Analysis:
By Type
Wheat leads this segment with about 42% share in 2024 due to wide use in breakfast cereals and bakery-linked blends. Producers choose wheat because it offers strong texture, high fiber, and stable processing behavior. Rice follows as a key option in gluten-free lines supported by rising clean-label demand. Barley and oats grow as brands promote beta-glucan benefits for heart health. Other grains gain steady traction in niche protein-rich mixes targeted toward fitness-focused buyers.
- For instance, Bühler supplied a new wheat-milling plant that adds 300 tonnes per day of milling capacity for a commercial mill, demonstrating the scale at which modern wheat processing plants increase output and enable broader bakery supply.
By Source
Conventional ingredients dominate this segment with nearly 78% share in 2024, driven by large-scale supply chains, stable pricing, and strong use across major cereal manufacturers. Organic sources expand as consumers seek chemical-free grains and higher transparency in sourcing. Growth accelerates through organic-certified farming programs in North America and Europe. Rising awareness of pesticide-free cultivation also supports organic grain penetration in premium cereal lines.
- For instance, General Mills is working with Gunsmoke Farms (via its Organic Grain Initiative) to convert 34,000 acres of conventional farmland to organic by 2020, securing long-term supply for its organic wheat lines.
By Form
Flakes hold the dominant position with about 58% share in 2024 due to strong acceptance in ready-to-eat cereals and wide product availability. Producers rely on flakes because they offer crisp texture, easy fortification, and long shelf life. Puffs grow in nutritious snack blends favored by young consumers who prefer light and low-calorie formats. Other forms, including granules and crushed mixes, gain demand in instant bowls and functional cereal bars promoted for on-the-go consumption.
Key Growth Drivers
Rising Demand for Functional and Nutritious Breakfast Options
Global consumers increasingly prefer cereal products enriched with fiber, vitamins, whole grains, and plant-based proteins. This shift pushes manufacturers to use high-quality cereal ingredients such as oats, barley, and fortified wheat blends that support digestive health and weight management. Younger buyers seek clean-label options with natural grains, fewer additives, and recognizable ingredients, which boosts demand across ready-to-eat cereals and instant mixes. Health-driven marketing, especially around heart health and beta-glucan benefits, strengthens the appeal of functional cereals. As lifestyles become busier, demand rises for convenient yet nutritious products, directly increasing consumption of high-value cereal ingredients in both mass and premium food segments.
- For instance, Quaker (PepsiCo) rolls out its 40 g serving of traditional rolled oats containing 1.4 g of beta-glucan per serving, leveraging the cholesterol-lowering benefits of soluble fiber for heart-health claims.
Expansion of Clean-Label and Organic Product Portfolios
The clean-label movement drives strong adoption of minimally processed cereal ingredients sourced from chemical-free farming. Organic wheat, rice, and oats gain traction as consumers pay closer attention to farming methods, soil quality, and pesticide residue levels. Food companies respond by expanding organic cereal lines, investing in certified suppliers, and reformulating existing products with clearer ingredient declarations. Retailers also promote organic cereals through private-label brands, increasing accessibility across mainstream markets. This shift supports steady growth for organic cereal ingredients within snacks, breakfast foods, and infant nutrition. As regulatory bodies tighten food safety and labeling norms, brands rely more on traceable and transparent ingredient sourcing, accelerating demand for premium organic cereals.
- For instance, Bob’s Red Mill, a leader in whole-grain foods, produces over 200 different products, many using certified-organic grains, including organic oats, flours, and ancient grains boosting its clean-label credibility.
Rising Penetration of Ready-to-Eat and On-the-Go Food Formats
Consumption of ready-to-eat (RTE) and portable breakfast solutions continues to rise due to long working hours, urbanization, and shifting household structures. Manufacturers use cereal ingredients such as flakes, puffs, and granules to produce convenient bowls, bars, and instant mixes designed for quick preparation. Growth in single-serve packs, travel-friendly pouches, and fortified snack bites boosts ingredient demand across multiple food categories. Companies also introduce high-protein and low-sugar cereal snacks to target fitness-oriented consumers. Expansion of e-commerce, subscription breakfast kits, and modern retail formats enhances product visibility. Together, these factors position cereal ingredients as essential components of evolving convenience-driven diets worldwide.
Key Trend and Opportunities
Increasing Use of Ancient Grains in Premium Cereal Products
Brands integrate ancient grains such as quinoa, millet, and amaranth into cereal blends to meet rising demand for nutrient-dense and exotic ingredients. These grains offer higher protein and mineral levels compared with conventional wheat or rice, which strengthens their appeal in premium healthy breakfast products. The trend grows as consumers explore new flavors, global cuisines, and plant-based diets. Manufacturers promote ancient-grain cereals as clean-label alternatives with sustainable farming origins. This shift creates opportunities for suppliers specializing in diversified grain cultivation and value-added processing across niche health-focused segments.
- For instance, Millets like ragi and jowar are considered rich sources of protein. Other similar products on the market, such as those from Health Sutra, list their ragi flakes at 11g of protein per 100g and jowar flakes at 10g per 100g.
Innovation in Fortified and Functional Cereal Ingredients
Manufacturers develop cereal ingredients enriched with probiotics, omega-3, antioxidants, and botanical extracts to meet demand for multifunctional foods. This trend aligns with consumer interest in immunity, energy management, and digestive wellness. Companies invest in extrusion, micronization, and gentle-processing technologies to preserve nutrient integrity. Functional blends also support growth in kids’ cereals, adult wellness lines, and specialized dietary products. The opportunity expands as brands differentiate through advanced nutrition claims and hybrid cereal formats that combine grains with seeds, nuts, and natural sweeteners.
- For instance, Nestlé filed a patent for omega-3 fortification in extruded cereals using crushed flaxseed. Their patent describes a formulation with 4–8 g of alpha-linolenic acid (ALA) per 100 g of cereal pieces, plus antioxidants (e.g. vitamin E) to stabilize shelf life.
Key Challenge
Volatility in Grain Prices and Supply Chain Disruptions
Unpredictable weather conditions, geopolitical tensions, and global trade fluctuations significantly impact the availability and pricing of wheat, rice, oats, and other grains. Input costs rise due to transportation issues, energy price swings, and crop-yield variability, forcing manufacturers to manage frequent pricing adjustments. Smaller food producers struggle to secure stable long-term contracts, which affects product consistency and profitability. Supply chain disruptions also delay procurement of specialty grains such as organic or ancient varieties. These issues create operational pressure for brands that rely heavily on continuous and predictable ingredient flows.
Rising Regulatory Pressure on Quality, Labeling, and Sustainability
Global regulators impose stricter standards related to pesticide limits, allergen labeling, organic certification, and sustainability disclosures. Cereal ingredient suppliers must invest in robust testing, documentation, and traceability systems, raising compliance costs. Meeting these requirements is difficult for small farms and processors, which rely on traditional practices and limited capital. Sustainability expectations—such as reduced carbon footprints and responsible water use—add further complexity. As the regulatory landscape evolves, companies face challenges in reformulating products, improving sourcing transparency, and maintaining competitive pricing while adhering to new food-safety and environmental norms.
Regional Analysis
North America
North America leads the Cereal Ingredients Market with about 34% share in 2024, supported by high consumption of ready-to-eat cereals and strong demand for fortified breakfast products. Major brands in the U.S. and Canada invest in whole-grain blends, clean-label sourcing, and organic ingredients to match shifting consumer preferences. Growth accelerates as manufacturers introduce functional products enriched with fiber, probiotics, and plant proteins. Expanding retail distribution, including private-label offerings, further strengthens regional demand. Rising interest in low-sugar and gluten-free cereal options also boosts use of oats, rice, and specialty grain ingredients across the region.
Europe
Europe holds nearly 29% share in 2024, driven by high adoption of clean-label, organic, and minimally processed cereal ingredients. Countries such as Germany, the U.K., and France lead demand for oat- and barley-based blends due to strong focus on digestive health and sustainable diets. Regulatory emphasis on food transparency encourages brands to use traceable and pesticide-free grain sources. Growth increases as consumers shift toward premium muesli, granola, and functional breakfast formats. Expanding vegan and high-fiber diets further supports the use of diverse grains, driving steady ingredient consumption across the region’s mature cereal market.
Asia Pacific
Asia Pacific accounts for about 27% share in 2024 and remains the fastest-growing region due to rising urbanization, expanding middle-class populations, and increasing adoption of Western-style breakfast habits. Demand for rice-, wheat-, and oat-based ingredients strengthens as brands launch affordable instant cereals and fortified children’s products. China, India, and Japan lead consumption, supported by strong retail growth and online distribution. Health-focused buyers also favor whole grains and low-sugar cereal blends. Growing interest in functional foods and nutrition-driven snacks accelerates the use of multi-grain ingredients across both mass-market and premium cereal categories.
Latin America
Latin America holds around 6% share in 2024, supported by rising consumption of ready-to-eat cereals and expanding availability of value-priced grain blends. Brazil and Mexico drive demand through strong retail penetration and growing adoption of fortified breakfast options among young consumers. Manufacturers increase use of corn, wheat, and oat ingredients to produce affordable cereals suited to local taste preferences. Awareness of high-fiber and whole-grain diets is rising, encouraging gradual shifts toward healthier formulations. Regional growth remains steady as companies strengthen distribution networks and introduce flavored and functional cereal products.
Middle East & Africa
The Middle East & Africa region captures about 4% share in 2024, supported by increasing interest in packaged breakfast foods and expanding urban populations. Demand rises in the UAE, Saudi Arabia, and South Africa as consumers adopt convenience-driven diets and seek fortified food options. Manufacturers use wheat, corn, and oat ingredients to produce culturally aligned cereal products and snack blends. Growth improves with modern retail expansion, improved cold-chain logistics, and rising awareness of nutrient-rich grains. Although consumption remains lower than other regions, the market shows strong potential for premium and functional cereal ingredient products.
Market Segmentations
By Type
- Wheat
- Rice
- Barley
- Oats
- Others
By Source
- Organic
- Conventional
By Form
- Flakes
- Puff
- Others
By Geography
- North America
- U.S.
- Canada
- Mexico
- Europe
- Germany
- France
- U.K.
- Italy
- Spain
- Rest of Europe
- Asia Pacific
- China
- Japan
- India
- South Korea
- South-east Asia
- Rest of Asia Pacific
- Latin America
- Brazil
- Argentina
- Rest of Latin America
- Middle East & Africa
- GCC Countries
- South Africa
- Rest of the Middle East and Africa
Competitive Landscape
The Cereal Ingredients Market features a mix of global grain processors, food companies, and ingredient specialists that compete through product quality, large-scale sourcing, and innovation in functional grain solutions. Leading players such as ADM, Cargill Inc., Bunge Limited, Associated British Foods Plc, General Mills, SunOpta Inc., RiceBran Technologies, Kellogg’s, and Cll Foods focus on expanding high-fiber, whole-grain, and organic ingredient portfolios to meet rising clean-label demand. Companies invest in advanced milling, extrusion, and fortification technologies to improve texture, nutrient stability, and flavor across cereal applications. Strategic partnerships with farmers and contract growers help secure consistent supplies of wheat, oats, rice, and specialty grains. Several firms also strengthen sustainability programs through reduced carbon footprints, regenerative agriculture, and traceable supply chains. With growing interest in functional cereals, market participants emphasize R&D to develop blends enriched with protein, probiotics, and natural antioxidants, intensifying competition across both mainstream and premium product segments.
Key Player Analysis
- Cll Foods
- General Mills
- Bunge Limited
- SunOpta Inc.
- ADM
- Associated British Foods Plc
- Cargill Inc.
- RiceBran Technologies
- Kellogg's
Recent Developments
- In October 2025, Bunge realigned its reporting structure after the Viterra combination, creating a Grain Merchandising and Milling segment that consolidates wheat and corn milling activities supplying cereal and snack ingredient customers.
- In 2025, General Mills announced it will remove all artificial colors from its U.S. cereals and foods by 2027, and from K-12 cereals by summer 2026, shifting cereal ingredient profiles toward cleaner labels
Report Coverage
The research report offers an in-depth analysis based on Type, Source, Form and Geography. It details leading market players, providing an overview of their business, product offerings, investments, revenue streams, and key applications. Additionally, the report includes insights into the competitive environment, SWOT analysis, current market trends, as well as the primary drivers and constraints. Furthermore, it discusses various factors that have driven market expansion in recent years. The report also explores market dynamics, regulatory scenarios, and technological advancements that are shaping the industry. It assesses the impact of external factors and global economic changes on market growth. Lastly, it provides strategic recommendations for new entrants and established companies to navigate the complexities of the market.
Future Outlook
- Demand for functional grains will rise as consumers seek high-fiber and nutrient-rich cereal options.
- Adoption of organic and clean-label cereal ingredients will accelerate across major food categories.
- Use of ancient grains such as quinoa, millet, and amaranth will grow in premium cereal formulations.
- Manufacturers will increase investments in extrusion and fortification technologies to enhance product quality.
- Sustainability programs and regenerative farming partnerships will shape long-term sourcing strategies.
- Expansion of ready-to-eat and on-the-go cereal formats will boost demand for flakes, puffs, and multi-grain blends.
- Brands will introduce more low-sugar and high-protein cereal products to meet health-driven preferences.
- Digital retail and e-commerce channels will improve global accessibility of value-added cereal ingredients.
- Asia Pacific will emerge as a major growth engine supported by rising urbanization and changing dietary habits.
- Companies will strengthen traceability and transparency to meet strict labeling and safety regulations.
Request a Free Sample
Fill in your details and we'll send you a free sample report.
- Sample data tables & charts
- Research methodology
Need a Custom Version of This Report?
Tailor the scope, geography, or segments to your exact requirements.
- Custom geography or segment scope
- Direct access to our analyst team
Frequently Asked Questions
What is the current market size for Cereal Ingredients Market, and what is its projected size in 2032?
At what Compound Annual Growth Rate is Cereal Ingredients Market projected to grow between 2025 and 2032?
Which Cereal Ingredients Market segment held the largest share in 2024?
What are the primary factors fueling the growth of Cereal Ingredients Market?
Who are the leading companies in Cereal Ingredients Market?
Which region commanded the largest share of Cereal Ingredients Market?
Table of Content
Chapter 1. Report Introduction
- 1.1 Report Description & Purpose
- 1.1.1 Report Title & Market Definition
- 1.1.2 Unique Selling Propositions (USP) & Key Differentiators
- 1.1.3 Value Proposition for Stakeholders
- 1.2 Research Objectives
- 1.2.1 Market Sizing Objectives (Volume & Revenue)
- 1.2.2 Segmentation Objectives
- 1.2.3 Competitive Intelligence Objectives
- 1.2.4 Forecast & Scenario Objectives
- 1.3 Report Scope
- 1.3.1 Cereal Ingredients Scope – Types & Subtypes Covered
- 1.3.2 Geographic Scope – Regions & Countries Covered
- 1.3.3 Historical Period, Base Year & Forecast Period (2024; forecast to 2032)
- 1.3.4 Inclusions & Exclusions
- 1.4 HS Code & Classification Framework
- 1.5 Currency, Units & Pricing Basis
- 1.6 Target Stakeholders
- 1.7 Limitations & Assumptions
Chapter 2. Executive Summary
- 2.1 Global Cereal Ingredients Market Snapshot
- 2.1.1 Market Size – Historical (2024) & Forecast (2024-2032) (2024: USD 452.53 million → 2032: USD 620.27 million)
- 2.1.2 Volume & Revenue – Global Totals
- 2.1.3 Key Market Highlights – Top Five Facts
- 2.2 Cereal Ingredients Market Segmentation Snapshot
- 2.2.1 Market Split by Region – 2024 vs. 2032
- 2.3 Competitive Snapshot
- 2.3.1 Top 10 Players by Revenue Share – 2024
- 2.3.2 Top 10 Players by Volume Share – 2024
- 2.3.3 Recent Strategic Developments (18-Month Summary)
- 2.4 Key Investment Highlights & Strategic Conclusions
Chapter 3. Cereal Ingredients Market Dynamics & Industry Analysis
- 3.1 Market Overview & Context
- 3.1.1 Cereal Ingredients Market Position in the Broader Automotive Value Chain
- 3.1.2 OEM vs. Replacement Market Dynamics
- 3.1.3 Market Maturity & Development Stage by Region
- 3.2 Cereal Ingredients Market Drivers
- 3.3 Cereal Ingredients Market Restraints & Challenges
- 3.4 Cereal Ingredients Market Opportunities
- 3.5 Porter's Five Forces Analysis
- 3.5.1 Threat of New Entrants
- 3.5.2 Bargaining Power of Suppliers
- 3.5.3 Bargaining Power of Buyers
- 3.5.4 Threat of Substitutes
- 3.5.5 Competitive Rivalry – Intensity Assessment
- 3.6 Cereal Ingredients Value Chain Analysis
- 3.6.1 Upstream – Raw Material/Input Suppliers
- 3.6.1.1 Raw Material/Input 1
- 3.6.1.2 Raw Material/Input 2
- 3.6.1.3 Raw Material/Input 3
- 3.6.2 Midstream – Production/Manufacturing/Service Delivery
- 3.6.2.1 Production/Process Overview
- 3.6.2.2 Key Facility Locations & Capacity by Manufacturer
- 3.6.3 Downstream – Distribution & End Consumer
- 3.6.3.1 Primary Channel – B2B/OEM
- 3.6.3.2 Secondary Channels – Dealer, Retail, Online, Direct
- 3.6.4 Value Chain Profitability Analysis
- 3.6.1 Upstream – Raw Material/Input Suppliers
- 3.7 PESTEL Analysis
- 3.7.1 Political Factors
- 3.7.2 Economic Factors
- 3.7.3 Social Factors
- 3.7.4 Technological Factors
- 3.7.5 Environmental Factors
- 3.7.6 Legal Factors
- 3.8 Cereal Ingredients Supply Chain Analysis
- 3.8.1 Raw Material/Input Supply Risk Assessment
- 3.8.2 Manufacturing Concentration Risk (Geographic Exposure)
- 3.8.3 Trade Disruption Impact Analysis
- 3.9 Regulatory & Policy Landscape
Note: The regulatory and policy landscape section covers regulations based on their applicability to the market, Cereal Ingredients category, geography, and scope of the study. Only regulatory frameworks with a material impact on operations, compliance, trade, sustainability, or market access are analyzed in detail.
Chapter 4. Key Investment Pockets & Opportunity Analysis
- 4.1 Cereal Ingredients Market Attractiveness Analysis
- 4.1.1 By Region – Investment Attractiveness Matrix (Volume × CAGR)
- 4.2 Absolute Revenue Growth Opportunity
- 4.2.1 By Region – Absolute USD Growth Through 2032
- 4.3 Incremental Volume Opportunity
- 4.3.1 By Region – Incremental Volume Through 2032
- 4.3.2 Segment – Incremental Volume
- 4.4 Emerging Submarket Opportunity Deep Dive (Subject to Applicability)
- 4.5 Emerging Market Opportunity Scorecards
- 4.5.1 United States
- 4.5.2 Europe
- 4.5.3 Asia
- 4.5.4 Middle East & Africa
Note: Emerging Market Opportunity Scorecards will be included based on relevance and strategic importance. Regions listed are indicative and may vary depending on data availability and market dynamics.
Chapter 5. Cereal Ingredients Import-Export Analysis & Trade Flows
- 5.1 Global Trade Overview
- 5.1.1 Global Export Value by Country (2024)
- 5.1.2 Global Export Volume by Country (2024)
- 5.1.3 Global Import Value by Country (2024)
- 5.1.4 Global Import Volume by Country (2024)
- 5.1.5 Net Trade Balance by Country (2024)
- 5.2 Export Analysis – Segment
- 5.2.1 Type 1 (HS Code)
- 5.2.2 Type 2 (HS Code)
- 5.2.3 Type 3 (HS Code)
- 5.2.4 Type 4 (HS Code)
- 5.2.5 Type 5 (HS Code)
- 5.3 Import Analysis – Segment
- 5.3.1 Type 1 (HS Code)
- 5.3.2 Type 2 (HS Code)
- 5.3.3 Type 3 (HS Code)
- 5.3.4 Type 4 (HS Code)
- 5.3.5 Type 5 (HS Code)
- 5.4 Average Unit Trade Prices
- 5.4.1 Average Export Price – Segment & Country
- 5.4.2 Average Import Price – Segment & Source Country
- 5.4.3 Price Trends (2024)
- 5.5 Key Trade Route Analysis
- 5.5.1 Trade Route 1
- 5.5.2 Trade Route 2
- 5.5.3 Trade Route 3
- 5.5.4 Trade Route 4
- 5.5.5 Trade Route 5
- 5.6 Trade Policy Impact Assessment
- 5.6.1 US Anti-Dumping & Section 301 Tariffs
- 5.6.2 EU Customs Union Impact
- 5.6.3 Major Free Trade Agreements
- 5.6.4 USMCA Rules of Origin
Note: Trade policy analysis will be included only where relevant to the Cereal Ingredients market.
Chapter 6. Competitive Landscape & Company Benchmarking
- 6.1 Cereal Ingredients Market Concentration & Structure
- 6.1.1 Herfindahl-Hirschman Index (HHI) – vs. 2024
- 6.1.2 Tier 1, Tier 2 & Tier 3 Market Structure
- 6.1.3 Global, Regional & Local Player Dynamics
- 6.2 Cereal Ingredients Market Share Analysis – 2024
- 6.2.1 Global Revenue Share by Company
- 6.2.2 Global Volume Share by Company
- 6.2.3 Regional Revenue Share
- 6.2.4 Market Share Evolution ( vs. 2024)
- 6.2.5 OEM Segment Share by Company
- 6.2.6 Replacement Segment Share by Company
- 6.3 Production/Delivery Capacity & Facility Analysis
- 6.3.1 Global Installed Capacity
- 6.3.2 Capacity Utilization Rates
- 6.3.3 Production/Output Volume
- 6.3.4 Facility Locations & Capacity Map
- 6.3.5 Planned Capacity Additions
- 6.4 Cereal Ingredients Competitive Benchmarking Matrix
- 6.4.1 Revenue, Volume, CAGR & Profitability Comparison
- 6.4.2 Channel Revenue Mix
- 6.4.3 Geographic Revenue Exposure
- 6.4.4 R&D Intensity
- 6.4.5 Sustainability Maturity
- 6.5 Strategic Developments in Cereal Ingredients (Last 24 Months)
- 6.5.1 Mergers, Acquisitions & Divestments
- 6.5.2 New Cereal Ingredients Launches
- 6.5.3 Facility Expansions
- 6.5.4 Strategic Alliances, Joint Ventures & Partnerships
- 6.5.5 Distribution Expansion & Market Entry
- 6.5.6 Sustainability & ESG Initiatives
- 6.6 Competitive Strategy Mapping
- 6.6.1 Leader, Challenger, Follower & Niche Classification
- 6.6.2 Pricing Strategy Comparison
- 6.6.3 Channel Strategy Matrix
Note: Strategic developments are included based on their materiality and the availability of reliable information.
Chapter 7. Global Cereal Ingredients Market – By Distribution Channel
- 7.1 Segment Overview
- 7.1.1 Volume & Revenue Split by Channel (2024 & 2032)
- 7.1.2 Channel Mix Evolution (2024-2032)
Chapter 8. Regional Market Analysis – Global Overview
- 8.1 Global Regional Overview
- 8.1.1 Regional Volume Share
- 8.1.2 Regional Revenue Share
- 8.1.3 Regional Volume by Region
- 8.1.4 Regional Revenue by Region
- 8.1.5 Regional Forecast Through 2032
- 8.2 Cross-Regional Segment Analysis
- 8.2.1 By Distribution Channel
- 8.2.2 By Brand/Price Tier
Chapter 9. North America Cereal Ingredients Market
- 9.1 United States
- 9.2 Canada
- 9.3 Mexico
Chapter 10. Europe Cereal Ingredients Market
- 10.1 Germany
- 10.2 France
- 10.3 Italy
- 10.4 United Kingdom
- 10.5 Spain
- 10.6 Poland
- 10.7 Russia
- 10.8 Netherlands
- 10.9 Belgium
- 10.10 Sweden
- 10.11 Denmark
- 10.12 Norway
- 10.13 Rest of Europe
Chapter 11. Asia Pacific Cereal Ingredients Market
- 11.1 China
- 11.2 India
- 11.3 Japan
- 11.4 South Korea
- 11.5 Thailand
- 11.6 Indonesia
- 11.7 Vietnam
- 11.8 Malaysia
- 11.9 Australia
- 11.10 Rest of Asia Pacific
Chapter 12. Latin America Cereal Ingredients Market
- 12.1 Brazil
- 12.2 Argentina
- 12.3 Colombia
- 12.4 Chile
- 12.5 Rest of Latin America
Chapter 13. Middle East Cereal Ingredients Market
- 13.1 Saudi Arabia
- 13.2 United Arab Emirates
- 13.3 Turkey
- 13.4 Israel
- 13.5 Iran
- 13.6 Rest of the Middle East
Chapter 14. Africa Cereal Ingredients Market
- 14.1 South Africa
- 14.2 Egypt
- 14.3 Nigeria
- 14.4 Morocco
- 14.5 Rest of Africa
Chapter 15. Cereal Ingredients Company Profiles
- 15.1 [Company 01]
- 15.1.1 Company Overview
- 15.1.2 Key Management Personnel
- 15.1.3 Products & Services Portfolio
- 15.1.4 Financial Performance
- 15.1.5 Key Market Focus & Geographic Presence
- 15.1.6 Recent Developments & Strategic Initiatives
Note: The company profile list is preliminary and may change based on research findings, market developments, data availability, and client requirements.
Chapter 16. Appendices
- Appendix A – List of Abbreviations & Acronyms
- Appendix B – Industry Classification Code Reference – Full Series
- Appendix C – Production & Capacity Data Tables
- Appendix D – End-Use & Demand Base Tables
- Appendix E – Consumption & Replacement Rate Assumptions
- Appendix F – ASP Reference Tables
- Appendix G – Manufacturing & Facility Database
- Appendix H – Import-Export Data Tables
- Appendix I – Regulatory Summary Tables
- Appendix J – Primary Research Participant List (Anonymized)
- Appendix K – Primary Research Questionnaire Framework
- Appendix L – Data Sources & Bibliography
- Appendix M – Market Size Divergence & Source Comparison
Chapter 17. Research Methodology
- 17.1 Research Framework & Philosophy
- 17.2 Secondary Research – Sources, Hierarchy & Data Extraction
- 17.3 Data Modeling – Bottom-Up & Top-Down Market Sizing
- 17.4 Primary Research – Stakeholder Framework, LOI & Sample Sizes
- 17.5 Forecast Methodology – Regression, Scenario & Sensitivity Analysis
- 17.6 Quality Control – Four-Layer Validation Framework
- 17.7 Limitations & Standard Assumptions
- 17.8 Disclaimer
