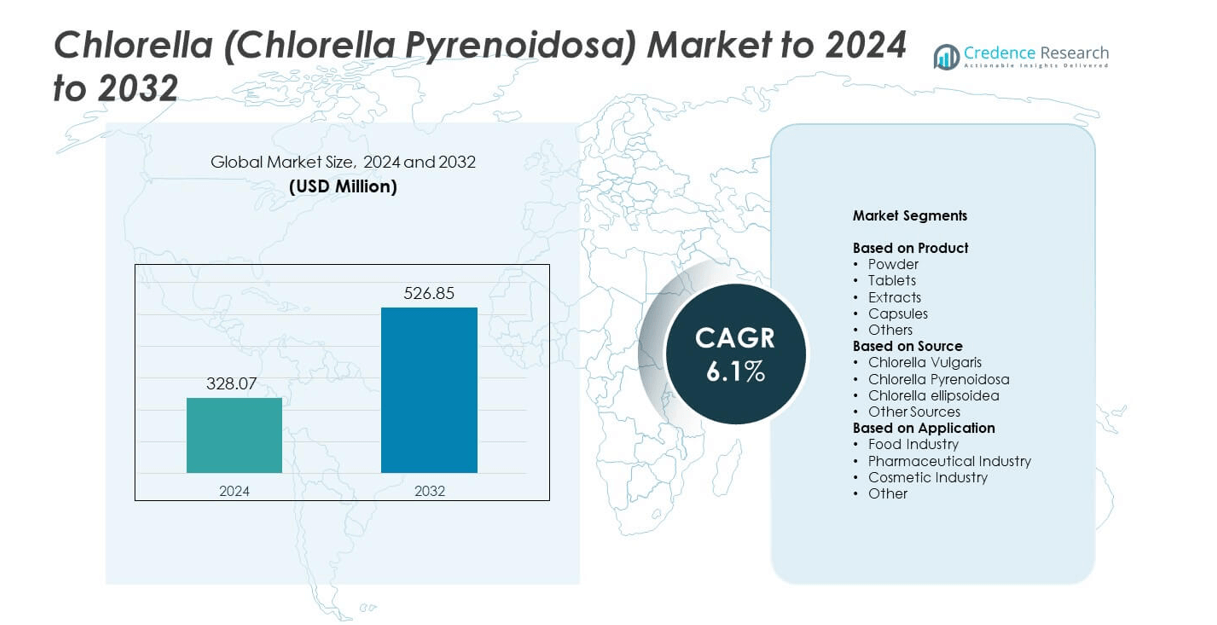
Home » Food & Beverage » Chlorella (Chlorella pyrenoidosa) Market

Chlorella (Chlorella pyrenoidosa) Market By Technology Open Pods, Closed Pods, Autotrophic, Heterotrophic By Product, Powder, Tablets, Extracts, Capsules, Others By Distribution Channel B2B, B2C, Offline, Distributors, Retailers, Online, Direct-to-Consumer)-Growth, Future Prospects & Competitive Analysis, 2016 – 2030

Price: $4999

Published: | Report ID: 18196 | Report Format : PDF

Key Highlights of the Report

The global Chlorella (Chlorella pyrenoidosa) market is segmented by source, type, application, technology, product, distribution channel, and region. Chlorella pyrenoidosa category is the most popular, while organic category is the primary type segments. Food industry is the most commonly used applications, and autotrophic is the most commonly used technology. The powder-based product and B2C distribution channel is the largest segment, with Asia Pacific leading the market growth.

The demand for natural and organic food ingredients, where chlorella is used as a nutrient-rich supplement, and growing awareness of the health benefits of Chlorella consumption, such as its high protein content and potential antioxidant properties, are two factors driving the Chlorella (Chlorella pyrenoidosa) market. The lack of consumer knowledge and understanding of chlorella is one market barrier that may prevent its uptake and market penetration.

Nonetheless, the global chlorella (chlorella pyrenoidosa) market offers significant growth opportunities, such as the growing use of chlorella in the cosmetic industry, where it is used for its potential skin benefits and natural pigment properties, and the rising demand for eco-friendly and sustainable alternatives, which may increase the demand for Chlorella as a renewable ingredient in various industries.

Market Overview

The global Chlorella (Chlorella pyrenoidosa) market has witnessed steady growth and is expected to grow at a CAGR of 6.5% between 2023 and 2030. The market was valued at USD 312.5 Million in 2022 and is expected to reach USD 485.6 Million in 2030.

Design Element 2

Access crucial information at unmatched prices!

Request your free sample report today & start making informed decisions powered by Credence Research!

Download Free Sample
CTA Design Element 3

What Are The Main Drivers Of The Global Chlorella (Chlorella pyrenoidosa) Market?

Essential nutrients like proteins, vitamins, and minerals are abundant in chlorella. The demand for nutritional supplements based on chlorella is growing as people become more aware of the health advantages of eating it, including immune support, detoxification, and overall wellness.

What Are The Major Challenges Faced By The Global Chlorella (Chlorella pyrenoidosa) Market?

Chlorella is becoming increasingly popular, yet consumers are still mostly unaware of its advantages and possible uses. Chlorella has a variety of purposes and has a high nutritional value. Thus, market operators face a problem in educating consumers about these benefits.

What Are The Growth Opportunities In The Global Chlorella (Chlorella pyrenoidosa) Market?

Chlorella can be used as a wholesome component in Chlorella (Chlorella pyrenoidosa) food products to meet the rising demand for natural and high-quality pet food. Its nutritional benefits can satisfy the growing desire for natural and nutritious pet food options.

Executive Summary

Overview of the Global Chlorella (Chlorella pyrenoidosa) Market

Because of growing consumer awareness of the nutritional benefits of chlorella (Chlorella pyrenoidosa) and it’s expanding applications across numerous industries, the chlorella (Chlorella pyrenoidosa) market is experiencing significant expansion. Chlorella is frequently utilized as a functional component and in creating nutritional supplements in the food and beverage industry. Additionally, it offers excellent growth opportunities in the cosmetics and personal care sector. The market, however, has difficulties due to low customer awareness and the requirement for quality assurance and standards. The Chlorella market is anticipated to expand more in the upcoming years due to the increased demand for natural and environmentally friendly alternatives across numerous industries.

Market Definition

Green freshwater single-celled chlorella (Chlorella pyrenoidosa) is a member of the phylum Chlorophyta. Since it contains many nutrients, it is considered a superfood. Proteins, vitamins (including vitamin B12), minerals (such as iron and magnesium), antioxidants, and other health-promoting substances like chlorophyll are all abundant in chlorella. It is well known for its possible medical advantages, including boosting energy, detoxifying the body, improving immunological function, and increasing digestive health. Chlorella is grown and processed in various forms of dietary supplements, functional foods, drinks, and cosmetic goods, including powders, pills, capsules, and extracts.

Market Insights

  • The global demand for Chlorella (Chlorella pyrenoidosa) foods was valued at USD 312.5 Million in 2022 and is expected to reach USD 485.6 Million in 2030, growing at a CAGR of 6.5% between 2023 and 2030.
  • Chlorella pyrenoidosa is the leading segment by source. They will hold over 30% share in value in 2022, while the chlorella vulgaris segment will likely exhibit the fastest CAGR during the forecast period.
  • The organic chlorella segment governs the demand for Chlorella (Chlorella pyrenoidosa) globally, holding a massive share of over 65% in 2022, and is expected to grow at a rapid CAGR.
  • The food industry is leading the market share with over 25% in 2022, while the cat food segment is expected to post the highest CAGR during the forecast period.
  • The autotrophic technology governs the demand for Chlorella (Chlorella pyrenoidosa) foods globally, holding a massive share of over 35% in 2022, and is expected to grow rapidly.
  • The powder segment governs the demand for Chlorella (Chlorella pyrenoidosa) foods globally, holding a massive share of over 55% in 2022, and is expected to grow at a rapid CAGR.
  • The B2C segment will occupy the largest market share during the forecast period, with a market occupancy of over 75%.
  • Asia Pacific is fuelling the growth of the Chlorella (Chlorella pyrenoidosa) industry with over one-third share in 2022, while North America and Europe collectively accounted for just under 40% share in 2022. Europe held over 18% share in 2022.
  • The chlorella (Chlorella pyrenoidosa) market is expanding significantly due to rising consumer awareness of the nutritional advantages of chlorella (Chlorella pyrenoidosa) and it’s expanding uses across several sectors.
  • Because there is such a great demand for natural and nutritional supplements in nations like Japan, China, and South Korea, the Asia Pacific region now holds the top spot in the chlorella (Chlorella pyrenoidosa) market.

Segmentation by Source

  • Chlorella pyrenoidosa is the leading segment by material and held over 50% share in value in 2022.
  • The chlorella vulgaris segment will likely exhibit the fastest CAGR during the forecast period.

Segmentation by Type

  • The Organic segment governs the demand for Chlorella (Chlorella pyrenoidosa) globally, holding a massive share of over 60% in 2022, and is also expected to grow at a rapid CAGR.
  • The inorganic segment contributes the rest to the demand for Chlorella (Chlorella pyrenoidosa).

Segmentation by Application

  • The food industry segment is leading the market share with over 25% share in 2022.
  • The pharmaceutical industry segment will post the highest CAGR during the forecast period.
  • Other applications, such as the pharmaceutical industry, also contribute to the demand for Chlorella (Chlorella pyrenoidosa).

Segmentation by Technology

  • The Autotrophic segment governs the demand for Chlorella (Chlorella pyrenoidosa) globally, holding a massive share of over 35% in 2022, and is also expected to grow at a rapid CAGR.
  • The open pods segment contributes the rest to the demand for Chlorella (Chlorella pyrenoidosa).
  • Other technologies, such as closed pods and heterotrophic, also contribute to the demand for Chlorella (Chlorella pyrenoidosa).

Segmentation by Product

  • The powder segment is leading the market share with over 55% share in 2022.
  • The tablets segment will post the highest CAGR during the forecast period.
  • Other products, such as extracts, capsules, and others, also contribute to the demand for Chlorella (Chlorella pyrenoidosa).

Segmentation by Distribution Channel

  • The B2C segment governs the demand for Chlorella (Chlorella pyrenoidosa) globally, holding a massive share of over 25% in 2022, and is also expected to grow at a rapid CAGR.
  • The retailer’s segment contributes to the demand for Chlorella (Chlorella pyrenoidosa).

Segmentation by Region

  • Asia Pacific is fueling the growth of the Chlorella (Chlorella pyrenoidosa) industry with over one-third share in 2022.
  • North America and Europe collectively account for just under 18% share in 2022, with Europe holding over 18% share in the same year.
  • The rest of the World, including Latin America, The Middle East, and Africa, contributes the remainder to the demand for Chlorella (Chlorella pyrenoidosa).

The popularity of chlorella as a sustainable and nutrient-rich ingredient is partly fueled by rising consumer awareness of and demand for natural and plant-based products across various industries, including food, beverage, and cosmetics. One market limitation is the regulatory requirements and standards for producing, processing and labeling Chlorella products. These requirements and hurdles might challenge market participants and restrain market expansion.

The health and wellness industry in the United States heavily uses the chlorella market. Due to its rich nutritional profile and potential health benefits, chlorella is frequently used as a dietary supplement. It is touted as a natural superfood and is offered in various forms, including pills, capsules, and powders. Customers’ rising demand pushes the industry for natural supplements made from plants and organic ingredients. Chlorella is also employed in the food and beverage sector as a functional ingredient in goods like smoothies, juices, and energy bars to meet the rising demand for healthy and natural food options.

Chlorella has a stronghold on the market in Japan thanks to the country’s strong emphasis on health and lifespan. Because of its possible health benefits, chlorella is frequently used as a functional food and dietary supplement. It is frequently used in traditional Japanese diets and healthcare regimens and is widely accessible in tablet and powder forms. The strong focus on preventative healthcare and the use of natural therapies is what drives the industry. Chlorella is used in skincare products because of its possible skin benefits and rejuvenating capabilities. It is also used in the cosmetic sector. The market in Japan is an indication of how Chlorella has become part of daily life due to its alleged health benefits.

Rising consumer awareness and desire for natural and plant-based goods across multiple industries, including food, beverage, and cosmetics, has contributed to the popularity of chlorella as a sustainable and nutrient-rich component. Producing chlorella is a relatively costly endeavor. This is due to the high cost of basic materials, the complexity of the manufacturing process, and the requirement for stringent quality control. In addition, chlorella is not as broadly accessible as other dietary supplements. This is because the product is comparatively new, and the market is still in its infancy.

Chlorella (Chlorella pyrenoidosa) Market

Increasing Demand for Natural and Organic Food Ingredients

Growing consumer interest in organic and all-natural products fuels the Chlorella (Chlorella pyrenoidosa) industry. More and more people are considering how their eating decisions might affect their health and the planet. Chlorella, a sustainable microalga high in nutrients, fits in well with these tastes. Chlorella is grown without synthetic fertilizers or pesticides. Hence it is considered an organic and natural ingredient. It’s a great alternative for people watching their diets and looking for natural and wholesome foods because it’s high in protein, vitamins, minerals, and antioxidants.

The nutritional content of foods, including snacks, beverages, and functional foods, can be improved by adding chlorella to the recipe. Among its many possible use is as a natural green pigment, a source of plant-based protein, and a functional component. Chlorella’s adaptability and the rising desire for natural and organic ingredients fuel its widespread use in the food business.

Growing Awareness of Health Benefits and Nutritional Value

The rising recognition of Chlorella’s health advantages and nutritional worth is another important factor propelling the market. Proteins, vitamins, minerals, and antioxidants are just some of the many nutrients that chlorella is known to have. It has been touted as a “superfood” that may positively affect health.

It is claimed that chlorella can help the immune system, facilitate detoxification, enhance digestion, and increase energy levels. The high content of chlorophyll it boasts is good for the body’s cells and detoxification systems. Chlorella also provides the body with the nine necessary amino acids it needs but cannot create independently.

The demand for natural and nutrient-dense foods, such as Chlorella, remains high as people grow more health-conscious and proactive in maintaining their well-being. Further fueling public knowledge and interest in Chlorella is the availability of scientific studies and good anecdotal data regarding the potential health benefits of Chlorella. Chlorella is gaining popularity as a means to improve one’s diet and health because of its natural and nutrient-rich composition and the growing recognition of its health advantages.

Limited Consumer Awareness And Understanding of Chlorella

The fact that few people have heard of Chlorella (Chlorella pyrenoidosa) is a major challenge for the industry. Many still don’t know what Chlorella is or how to use it, even though it may have significant health and nutritional benefits. Problems with market penetration and acceptance may result from a lack of public knowledge.

Consumers’ lack of comfort with the product may be exacerbated by their ignorance of the scientific and technical details involved in Chlorella’s production, processing, and labeling. Consumers need to be better educated about the benefits of Chlorella, its environmentally friendly manufacturing processes, and its potential applications in a wide range of industries to overcome this barrier.

Expansion in the Pet Food Industry

The growing demand for pet food made with Chlorella (Chlorella pyrenoidosa) presents a promising prospect for the market. Chlorella is a nutritional component used in pet food products, especially fish-based ones, to meet the growing demand for all-natural and high-quality pet food.

Chlorella is a desirable ingredient in pet food recipes due to its nutritional benefits, including high protein content, vitamins, minerals, and perhaps antioxidant qualities. Chlorella in pet food is consistent with the growing trend of pet owners seeking natural and nutritious solutions. Adding pet food to your product line is a great way to reach a new customer base and broaden your business’s customer base.

Growing Interest in Sustainable and Plant-Based Alternatives

The expanding demand for eco-friendly and plant-based solutions across numerous industries presents another possibility. Chlorella, an environmentally beneficial and renewable microalga, fits in well with this trend. As customers’ awareness of the environment grows, they look for sustainable substitutes for standard components.

Chlorella is a workable option because it can be grown with few resources and has a smaller carbon impact than conventional agriculture. Its future uses as a natural, plant-based ingredient in the food, beverage, cosmetic, and pharmaceutical industries will meet the growing consumer demand for ethical and sustainable goods. Market participants can capitalize on the growing consumer base looking for ecologically friendly options by portraying Chlorella as a sustainable and plant-based alternative and setting their products apart.

Competitive Landscape

Key Players

The global Chlorella (Chlorella pyrenoidosa) market is highly competitive, with several key players. Some of the major players in the market and their market share are as follows:

  • GONG BIH ENTERPRISHE CO., LTD.
  • E.I.D. – Parry (India) Limited
  • Far East Bio-Tec Co., Ltd.
  • Yaeyama Shokusan Co., Ltd.
  • Fuqing King Dnarmsa Spirulina Co., Ltd.
  • Tianjin Norland Biotech Co., Ltd
  • STAUBER Ingredients For Innovation
  • Sure Chemical Co., Ltd.
  • Green Source Organics.
  • SUN CHLORELLA CORP.
  • FEMICO
  • Taiwan Chlorella Manufacturing Company
  • Yaeyama Shokusan Co., Ltd.
  • Kshipra Biotech Private Limited
  • Kuber Impex Ltd.
  • Divyagro.
  • Others

Chlorella (Chlorella pyrenoidosa) market competition is characterized by the coexistence of both well-established enterprises and up-and-coming businesses. Major market participants concentrate on product innovation, quality assurance, and growing their distribution networks to obtain a competitive edge. To increase market position and meet the rising demand for Chlorella goods, partnerships, acquisitions, and collaborations are other often used strategies.

Two Chlorella vulgaris microalgae powders made by the Portuguese company All Microalgae have received approval from the European Food Safety Authority to be used as food components and supplements. Notable is the sensory characteristics of Yellow and White Chlorella vulgaris varieties. These new goods are significantly more aesthetically neutral and offer a subtle flavor profile while providing the same nutritional value as conventional, vividly green items.

Shape Your Report to Specific Countries or Regions & Enjoy 30% Off!

Summary of Key Findings

  • According to one analysis, chlorella pyrenoidosa is the most popular source. By 2022, they will control more than 30% of the market, and the chlorella vulgaris market will grow faster than any other category.
  • In terms of global demand for Chlorella (Chlorella pyrenoidosa), the organic chlorella market is in charge, accounting for more than 65% in 2022 and expanding at a quick CAGR.
  • In 2022, the food business will hold more than 25% of the market, and the cat food category will grow fastest.
  • The market for Chlorella (Chlorella pyrenoidosa) meals worldwide is controlled by autotrophic technology, which is projected to increase at a high CAGR, holding a large share of over 35% in 2022.
  • The powder sector controls the market for Chlorella (Chlorella pyrenoidosa) meals worldwide, projected to rise at a quick CAGR. In 2022, the powder segment held a significant share of over 55%.
  • Over 75% of the market will be controlled by the business-to-consumer sector throughout the forecast period.
  • Over a third of the Chlorella (Chlorella pyrenoidosa) market in 2022 was generated in Asia Pacific, with North America and Europe accounting for over 40%. In 2022, Europe had more than an 18% stake.

Future Outlook

  • Several factors indicate a bright future for the Chlorella (Chlorella pyrenoidosa) market. Market expansion is anticipated due to rising demand for natural and sustainable ingredients and rising knowledge of Chlorella’s health advantages.
  • The market’s potential will increase due to developments in farming methods, processing equipment, and new product development.
  • Chlorella’s growing use in the food and beverage, cosmetics, and pharmaceutical sectors, among others, offers new prospects for market participants.
  • The demand for Chlorella will increase in the next years due to shifting consumer tastes and an increased emphasis on health and wellness.

Segmentation

  • By Source
    • Chlorella Vulgaris
    • Chlorella Pyrenoidosa
    • Chlorella Ellipsoidea
    • Other Sources
  • By Type
    • Organic
    • Inorganic
  • By Application
    • Food Industry
    • Pharmaceutical Industry
    • Cosmetic Industry
    • Others
  • By Technology
    • Open Pods
    • Closed Pods
    • Autotrophic
    • Heterotrophic
  • By Product
    • Powder
    • Tablets
    • Extracts
    • Capsules
    • Others
  • By Distribution Channel
    • B2B
    • B2C
    • Offline
    • Distributors
    • Retailers
    • Online
    • Direct-to-Consumer
  • By Region
  • North America
    • U.S
    • Canada
    • Mexico
  • Europe
    • Germany
    • France
    • U.K.
    • Italy
    • Spain
    • Rest of Europe
  • Asia Pacific
    • China
    • Japan
    • India
    • South Korea
    • South-east Asia
    • Rest of Asia Pacific
  • Latin America
    • Brazil
    • Argentina
    • Rest of Latin America
  • Middle East & Africa
    • GCC Countries
    • South Africa
    • Rest of Middle East and Africa

1. Preface
1.1. Report Description
1.1.1. Purpose of the Report
1.1.2. Target Audience
1.1.3. USP and Key Products
1.2. Research Scope
1.3. Research Methodology
1.3.1. Phase I – Secondary Research
1.3.2. Phase II – Data Modelling
1.3.2.1. Company Share Analysis Model
1.3.2.2. Revenue Based Modelling
1.3.3. Phase III – Primary Research
1.3.4. Research Limitations
1.3.5. Assumptions
1.4. Market Introduction
1.5. Market Research Scope

2. Executive Summary
2.1. Market Snapshot: Global Chlorella (Chlorella pyrenoidosa) Market
2.2. Global Chlorella (Chlorella pyrenoidosa) Market, By Source
2.3. Global Chlorella (Chlorella pyrenoidosa) Market, By Type
2.4. Global Chlorella (Chlorella pyrenoidosa) Market, By Application
2.5. Global Chlorella (Chlorella pyrenoidosa) Market, By Technology
2.6. Global Chlorella (Chlorella pyrenoidosa) Market, By Product
2.7. Global Chlorella (Chlorella pyrenoidosa) Market, By Distribution Channel
2.8. Global Chlorella (Chlorella pyrenoidosa) Market, By Region

3. Market Dynamics & Factors Analysis
3.1. Introduction
3.1.1. Global Chlorella (Chlorella pyrenoidosa) Market Value, 2017-2030, (US$ Mn)
3.1.2. Y-o-Y Growth Trend Analysis
3.2. Market Dynamics
3.2.1. Market Drivers
3.2.1.1. Driver 1
3.2.1.2. Driver 2
3.2.1.3. Driver 3
3.2.2. Market Restraints
3.2.2.1. Restraint 1
3.2.2.2. Restraint 2
3.2.3. Market Opportunities
3.2.3.1. Opportunity 1
3.2.3.2. Opportunity 2
3.2.4. Major Industry Challenges
3.2.4.1. Challenge 1
3.2.4.2. Challenge 2
3.3. Growth and Development Patterns
3.4. Investment Feasibility Analysis
3.5. Market Opportunity Analysis
3.5.1. Source
3.5.2. Type
3.5.3. Application
3.5.4. Technology
3.5.5. Product
3.5.6. Distribution Channel
3.5.7. Geography

4. Premium Insights
4.1. STAR (Situation, Task, Action, Results) Analysis
4.2. Porter’s Five Forces Analysis
4.2.1. Threat of New Entrants
4.2.2. Bargaining Power of Buyers/Consumers
4.2.3. Bargaining Power of Suppliers
4.2.4. Threat of Substitute Types
4.2.5. Intensity of Competitive Rivalry
4.3. Key Market Trends
4.3.1. Demand Side Trends
4.3.2. Supply Side Trends
4.4. Value Chain Analysis
4.5. Source Analysis
4.6. Analysis and Recommendations
4.7. Marketing Strategy Analysis
4.7.1. Direct Marketing
4.7.2. Indirect Marketing
4.7.3. Marketing Channel Development Trend

5. Market Positioning of Key Players, 2022
5.1. Company market share of key players, 2022
5.2. Competitive Benchmarking
5.3. Market Positioning of Key Vendors
5.4. Geographical Presence Analysis
5.5. Major Strategies Adopted by Key Players
5.5.1. Key Strategies Analysis
5.5.2. Mergers and Acquisitions
5.5.3. Partnerships
5.5.4. Product Launch
5.5.5. Geographical Expansion
5.5.6. Others

6. Economic Impact Analysis
6.1. Recession Impact
6.1.1. North America
6.1.2. Europe
6.1.3. Asia Pacific
6.1.4. Latin America
6.1.5. Middle East and Africa
6.2. Ukraine-Russia War Impact
6.2.1. North America
6.2.2. Europe
6.2.3. Asia Pacific
6.2.4. Latin America
6.2.5. Middle East and Africa
6.3. COVID-19 Impact Analysis
6.3.1. North America
6.3.2. Europe
6.3.3. Asia Pacific
6.3.4. Latin America
6.3.5. Middle East and Africa

7. Global Chlorella (Chlorella pyrenoidosa) Market, By Source
7.1. Global Chlorella (Chlorella pyrenoidosa) Market Overview, by Source
7.1.1. Global Chlorella (Chlorella pyrenoidosa) Market Revenue Share, By Source, 2022 Vs 2030 (in %)
7.2. Chlorella Vulgaris
7.2.1. Global Chlorella (Chlorella pyrenoidosa) Market, By Region, 2017-2030 (US$ Mn)
7.3. Chlorella Pyrenoidosa
7.3.1. Global Chlorella (Chlorella pyrenoidosa) Market, By Region, 2017-2030 (US$ Mn)
7.4. Chlorella Ellipsoidea
7.4.1. Global Chlorella (Chlorella pyrenoidosa) Market, By Region, 2017-2030 (US$ Mn)
7.5. Other Sources
7.5.1. Global Chlorella (Chlorella pyrenoidosa) Market, By Region, 2017-2030 (US$ Mn)

8. Global Chlorella (Chlorella pyrenoidosa) Market, By Type
8.1. Global Chlorella (Chlorella pyrenoidosa) Market Overview, by Type
8.1.1. Global Chlorella (Chlorella pyrenoidosa) Market, By Type, 2022 vs 2030 (in %)
8.2. Organic
8.2.1. Global Chlorella (Chlorella pyrenoidosa) Market, By Region, 2017-2030 (US$ Mn)
8.3. Inorganic
8.3.1. Global Chlorella (Chlorella pyrenoidosa) Market, By Region, 2017-2030 (US$ Mn)

9. Global Chlorella (Chlorella pyrenoidosa) Market, by Product, 2017-2030 (US$ Mn)
9.1. Global Chlorella (Chlorella pyrenoidosa) Market Overview, by Application
9.1.1. Global Chlorella (Chlorella pyrenoidosa) Market, By Application, 2022 vs 2030 (in%)
9.2. Food Industry
9.2.1. Global Chlorella (Chlorella pyrenoidosa) Market, By Region, 2017-2030 (US$ Mn)
9.3. Pharmaceutical Industry
9.3.1. Global Chlorella (Chlorella pyrenoidosa) Market, By Region, 2017-2030 (US$ Mn)
9.4. Cosmetic Industry
9.4.1. Global Chlorella (Chlorella pyrenoidosa) Market, By Region, 2017-2030 (US$ Mn)
9.5. Others
9.5.1. Global Chlorella (Chlorella pyrenoidosa) Market, By Region, 2017-2030 (US$ Mn)

10. Global Chlorella (Chlorella pyrenoidosa) Market, by Technology, 2017-2030 (US$ Mn)
10.1. Global Chlorella (Chlorella pyrenoidosa) Market Overview, by Technology
10.1.1. Global Chlorella (Chlorella pyrenoidosa) Market, By Technology, 2022 vs 2030 (in%)
10.2. Open Pods
10.2.1. Global Chlorella (Chlorella pyrenoidosa) Market, By Region, 2017-2030 (US$ Mn)
10.3. Closed Pods
10.3.1. Global Chlorella (Chlorella pyrenoidosa) Market, By Region, 2017-2030 (US$ Mn)
10.4. Autotrophic
10.4.1. Global Chlorella (Chlorella pyrenoidosa) Market, By Region, 2017-2030 (US$ Mn)
10.5. Heterotrophic
10.5.1. Global Chlorella (Chlorella pyrenoidosa) Market, By Region, 2017-2030 (US$ Mn)

11. Global Chlorella (Chlorella pyrenoidosa) Market, by Product, 2017-2030 (US$ Mn)
11.1. Global Chlorella (Chlorella pyrenoidosa) Market Overview, by Product
11.1.1. Global Chlorella (Chlorella pyrenoidosa) Market, By Product, 2022 vs 2030 (in%)
11.2. Powder
11.2.1. Global Chlorella (Chlorella pyrenoidosa) Market, By Region, 2017-2030 (US$ Mn)
11.3. Tablets
11.3.1. Global Chlorella (Chlorella pyrenoidosa) Market, By Region, 2017-2030 (US$ Mn)
11.4. Extracts
11.4.1. Global Chlorella (Chlorella pyrenoidosa) Market, By Region, 2017-2030 (US$ Mn)
11.5. Capsules
11.5.1. Global Chlorella (Chlorella pyrenoidosa) Market, By Region, 2017-2030 (US$ Mn)
11.6. Others
11.6.1. Global Chlorella (Chlorella pyrenoidosa) Market, By Region, 2017-2030 (US$ Mn)

12. Global Chlorella (Chlorella pyrenoidosa) Market, by Distribution Channel, 2017-2030 (US$ Mn)
12.1. Global Chlorella (Chlorella pyrenoidosa) Market Overview, by Distribution Channel
12.1.1. Global Chlorella (Chlorella pyrenoidosa) Market, By Distribution Channel, 2022 vs 2030 (in%)
12.2. B2B
12.2.1. Global Chlorella (Chlorella pyrenoidosa) Market, By Region, 2017-2030 (US$ Mn)
12.3. B2C
12.3.1. Global Chlorella (Chlorella pyrenoidosa) Market, By Region, 2017-2030 (US$ Mn)
12.4. Powder Centers
12.4.1. Global Chlorella (Chlorella pyrenoidosa) Market, By Region, 2017-2030 (US$ Mn)
12.5. Offline
12.5.1. Global Chlorella (Chlorella pyrenoidosa) Market, By Region, 2017-2030 (US$ Mn)
12.6. Distributors
12.6.1. Global Chlorella (Chlorella pyrenoidosa) Market, By Region, 2017-2030 (US$ Mn)
12.7. Retailers
12.7.1. Global Chlorella (Chlorella pyrenoidosa) Market, By Region, 2017-2030 (US$ Mn)
12.8. Surgical Centers
12.8.1. Global Chlorella (Chlorella pyrenoidosa) Market, By Region, 2017-2030 (US$ Mn)
12.9. Online
12.9.1. Global Chlorella (Chlorella pyrenoidosa) Market, By Region, 2017-2030 (US$ Mn)
12.10. Direct-to-Consumer
12.10.1. Global Chlorella (Chlorella pyrenoidosa) Market, By Region, 2017-2030 (US$ Mn)

13. Global Chlorella (Chlorella pyrenoidosa) Market, By Region
13.1. Global Chlorella (Chlorella pyrenoidosa) Market Overview, by Region
13.1.1. Global Chlorella (Chlorella pyrenoidosa) Market, By Region, 2022 vs 2030 (in%)
13.2. Source
13.2.1. Global Chlorella (Chlorella pyrenoidosa) Market, By Source, 2017-2030 (US$ Mn)
13.3. Type
13.3.1. Global Chlorella (Chlorella pyrenoidosa) Market, By Type, 2017-2030 (US$ Mn)
13.4. Application
13.4.1. Global Chlorella (Chlorella pyrenoidosa) Market, By Product, 2017-2030 (US$ Mn)
13.5. Technology
13.5.1. Global Chlorella (Chlorella pyrenoidosa) Market, By Technology, 2017-2030 (US$ Mn)
13.6. Product
13.6.1. Global Chlorella (Chlorella pyrenoidosa) Market, By Product, 2017-2030 (US$ Mn)
13.7. Distribution Channel
13.7.1. Global Chlorella (Chlorella pyrenoidosa) Market, By Distribution Channel, 2017-2030 (US$ Mn)

14. North America Chlorella (Chlorella pyrenoidosa) Market Analysis
14.1. North America Chlorella (Chlorella pyrenoidosa) Market, by Source, 2017-2030(US$ Mn)
14.1.1. Overview
14.1.2. SRC Analysis
14.2. North America Chlorella (Chlorella pyrenoidosa) Market, by Type, 2017-2030(US$ Mn)
14.2.1. Overview
14.2.2. SRC Analysis
14.3. North America Chlorella (Chlorella pyrenoidosa) Market, by Application, 2017-2030(US$ Mn)
14.3.1. Overview
14.3.2. SRC Analysis
14.4. North America Chlorella (Chlorella pyrenoidosa) Market, by Technology, 2017-2030(US$ Mn)
14.4.1. Overview
14.4.2. SRC Analysis
14.5. North America Chlorella (Chlorella pyrenoidosa) Market, by Product, 2017-2030(US$ Mn)
14.5.1. Overview
14.5.2. SRC Analysis
14.6. North America Chlorella (Chlorella pyrenoidosa) Market, by Distribution Channel, 2017-2030(US$ Mn)
14.6.1. Overview
14.6.2. SRC Analysis
14.7. North America Chlorella (Chlorella pyrenoidosa) Market, by Country, 2017-2030 (US$ Mn)
14.7.1. North America Chlorella (Chlorella pyrenoidosa) Market, by Country, 2022 Vs 2030 (in%)
14.7.2. U.S.
14.7.2.1. U.S. Chlorella (Chlorella pyrenoidosa) Market Estimates and Forecast, 2017-2030 (US$ Mn)
14.7.2.2. U.S. Chlorella (Chlorella pyrenoidosa), By Source, 2017-2030 (US$ Mn)
14.7.2.3. U.S. Chlorella (Chlorella pyrenoidosa), By Type, 2017-2030 (US$ Mn)
14.7.2.4. U.S. Chlorella (Chlorella pyrenoidosa), By Application, 2017-2030 (US$ Mn)
14.7.2.5. U.S. Chlorella (Chlorella pyrenoidosa), By Technology, 2017-2030 (US$ Mn)
14.7.2.6. U.S. Chlorella (Chlorella pyrenoidosa), By Product, 2017-2030 (US$ Mn)
14.7.2.7. U.S. Chlorella (Chlorella pyrenoidosa), By Distribution Channel, 2017-2030 (US$ Mn)
14.7.3. Canada
14.7.3.1. Canada Chlorella (Chlorella pyrenoidosa) Market Estimates and Forecast, 2017-2030 (US$ Mn)
14.7.3.2. Canada Chlorella (Chlorella pyrenoidosa), By Source, 2017-2030 (US$ Mn)
14.7.3.3. Canada Chlorella (Chlorella pyrenoidosa), By Type, 2017-2030 (US$ Mn)
14.7.3.4. Canada Chlorella (Chlorella pyrenoidosa), By Application, 2017-2030 (US$ Mn)
14.7.3.5. Canada Chlorella (Chlorella pyrenoidosa), By Technology, 2017-2030 (US$ Mn)
14.7.3.6. Canada Chlorella (Chlorella pyrenoidosa), By Product, 2017-2030 (US$ Mn)
14.7.3.7. Canada Chlorella (Chlorella pyrenoidosa), By Distribution Channel, 2017-2030 (US$ Mn)

15. Europe Chlorella (Chlorella pyrenoidosa) Market Analysis
15.1. Europe Chlorella (Chlorella pyrenoidosa) Market, by Source, 2017-2030(US$ Mn)
15.1.1. Overview
15.1.2. SRC Analysis
15.2. Europe Chlorella (Chlorella pyrenoidosa) Market, by Type, 2017-2030(US$ Mn)
15.2.1. Overview
15.2.2. SRC Analysis
15.3. Europe Chlorella (Chlorella pyrenoidosa) Market, by Application, 2017-2030(US$ Mn)
15.3.1. Overview
15.3.2. SRC Analysis
15.4. Europe Chlorella (Chlorella pyrenoidosa) Market, by Technology, 2017-2030(US$ Mn)
15.4.1. Overview
15.4.2. SRC Analysis
15.5. Europe Chlorella (Chlorella pyrenoidosa) Market, by Product, 2017-2030(US$ Mn)
15.5.1. Overview
15.5.2. SRC Analysis
15.6. Europe Chlorella (Chlorella pyrenoidosa) Market, by Distribution Channel, 2017-2030(US$ Mn)
15.6.1. Overview
15.6.2. SRC Analysis
15.7. Europe Chlorella (Chlorella pyrenoidosa) Market, by Country, 2017-2030 (US$ Mn)
15.7.1. Europe Chlorella (Chlorella pyrenoidosa) Market, by Country, 2022 Vs 2030 (in%)
15.7.2. Germany
15.7.2.1. Germany Chlorella (Chlorella pyrenoidosa) Market Estimates and Forecast, 2017-2030 (US$ Mn)
15.7.2.2. Germany Chlorella (Chlorella pyrenoidosa), By Source, 2017-2030 (US$ Mn)
15.7.2.3. Germany Chlorella (Chlorella pyrenoidosa), By Type, 2017-2030 (US$ Mn)
15.7.2.4. Germany Chlorella (Chlorella pyrenoidosa), By Application, 2017-2030 (US$ Mn)
15.7.2.5. Germany Chlorella (Chlorella pyrenoidosa), By Technology, 2017-2030 (US$ Mn)
15.7.2.6. Germany Chlorella (Chlorella pyrenoidosa), By Product, 2017-2030 (US$ Mn)
15.7.2.7. Germany Chlorella (Chlorella pyrenoidosa), By Distribution Channel, 2017-2030 (US$ Mn)
15.7.3. France
15.7.3.1. France Chlorella (Chlorella pyrenoidosa) Market Estimates and Forecast, 2017-2030 (US$ Mn)
15.7.3.2. France Chlorella (Chlorella pyrenoidosa), By Source, 2017-2030 (US$ Mn)
15.7.3.3. France Chlorella (Chlorella pyrenoidosa), By Type, 2017-2030 (US$ Mn)
15.7.3.4. France Chlorella (Chlorella pyrenoidosa), By Application, 2017-2030 (US$ Mn)
15.7.3.5. France Chlorella (Chlorella pyrenoidosa), By Technology, 2017-2030 (US$ Mn)
15.7.3.6. France Chlorella (Chlorella pyrenoidosa), By Product, 2017-2030 (US$ Mn)
15.7.3.7. France Chlorella (Chlorella pyrenoidosa), By Distribution Channel, 2017-2030 (US$ Mn)
15.7.4. UK
15.7.4.1. UK Chlorella (Chlorella pyrenoidosa) Market Estimates and Forecast, 2017-2030 (US$ Mn)
15.7.4.2. UK Chlorella (Chlorella pyrenoidosa), By Source, 2017-2030 (US$ Mn)
15.7.4.3. UK Chlorella (Chlorella pyrenoidosa), By Type, 2017-2030 (US$ Mn)
15.7.4.4. UK Chlorella (Chlorella pyrenoidosa), By Application, 2017-2030 (US$ Mn)
15.7.4.5. UK Chlorella (Chlorella pyrenoidosa), By Technology, 2017-2030 (US$ Mn)
15.7.4.6. UK Chlorella (Chlorella pyrenoidosa), By Product, 2017-2030 (US$ Mn)
15.7.4.7. UK Chlorella (Chlorella pyrenoidosa), By Distribution Channel, 2017-2030 (US$ Mn)
15.7.5. Italy
15.7.5.1. Italy Chlorella (Chlorella pyrenoidosa) Market Estimates and Forecast, 2017-2030 (US$ Mn)
15.7.5.2. Italy Chlorella (Chlorella pyrenoidosa), By Source, 2017-2030 (US$ Mn)
15.7.5.3. Italy Chlorella (Chlorella pyrenoidosa), By Type, 2017-2030 (US$ Mn)
15.7.5.4. Italy Chlorella (Chlorella pyrenoidosa), By Application, 2017-2030 (US$ Mn)
15.7.5.5. Italy Chlorella (Chlorella pyrenoidosa), By Technology, 2017-2030 (US$ Mn)
15.7.5.6. Italy Chlorella (Chlorella pyrenoidosa), By Product, 2017-2030 (US$ Mn)
15.7.5.7. Italy Chlorella (Chlorella pyrenoidosa), By Distribution Channel, 2017-2030 (US$ Mn)
15.7.6. Spain
15.7.6.1. Spain Chlorella (Chlorella pyrenoidosa) Market Estimates and Forecast, 2017-2030 (US$ Mn)
15.7.6.2. Spain Chlorella (Chlorella pyrenoidosa), By Source, 2017-2030 (US$ Mn)
15.7.6.3. Spain Chlorella (Chlorella pyrenoidosa), By Type, 2017-2030 (US$ Mn)
15.7.6.4. Spain Chlorella (Chlorella pyrenoidosa), By Application, 2017-2030 (US$ Mn)
15.7.6.5. Spain Chlorella (Chlorella pyrenoidosa), By Technology, 2017-2030 (US$ Mn)
15.7.6.6. Spain Chlorella (Chlorella pyrenoidosa), By Product, 2017-2030 (US$ Mn)
15.7.6.7. Spain Chlorella (Chlorella pyrenoidosa), By Distribution Channel, 2017-2030 (US$ Mn)
15.7.7. Rest of Europe
15.7.7.1. Rest of Europe Chlorella (Chlorella pyrenoidosa) Market Estimates and Forecast, 2017-2030 (US$ Mn)
15.7.7.2. Rest of Europe Chlorella (Chlorella pyrenoidosa), By Source, 2017-2030 (US$ Mn)
15.7.7.3. Rest of Europe Chlorella (Chlorella pyrenoidosa), By Type, 2017-2030 (US$ Mn)
15.7.7.4. Rest of Europe Chlorella (Chlorella pyrenoidosa), By Application, 2017-2030 (US$ Mn)
15.7.7.5. Rest of Europe Chlorella (Chlorella pyrenoidosa), By Technology, 2017-2030 (US$ Mn)
15.7.7.6. Rest of Europe Chlorella (Chlorella pyrenoidosa), By Product, 2017-2030 (US$ Mn)
15.7.7.7. Rest of Europe Chlorella (Chlorella pyrenoidosa), By Distribution Channel, 2017-2030 (US$ Mn)

16. Asia Pacific Chlorella (Chlorella pyrenoidosa) Market Analysis
16.1. Asia Pacific Chlorella (Chlorella pyrenoidosa) Market, by Source, 2017-2030(US$ Mn)
16.1.1. Overview
16.1.2. SRC Analysis
16.2. Asia Pacific Chlorella (Chlorella pyrenoidosa) Market, by Type, 2017-2030(US$ Mn)
16.2.1. Overview
16.2.2. SRC Analysis
16.3. Asia Pacific Chlorella (Chlorella pyrenoidosa) Market, by Application, 2017-2030(US$ Mn)
16.3.1. Overview
16.3.2. SRC Analysis
16.4. Asia Pacific Chlorella (Chlorella pyrenoidosa) Market, by Technology, 2017-2030(US$ Mn)
16.4.1. Overview
16.4.2. SRC Analysis
16.5. Asia Pacific Chlorella (Chlorella pyrenoidosa) Market, by Product, 2017-2030(US$ Mn)
16.5.1. Overview
16.5.2. SRC Analysis
16.6. Asia Pacific Chlorella (Chlorella pyrenoidosa) Market, by Distribution Channel, 2017-2030(US$ Mn)
16.6.1. Overview
16.6.2. SRC Analysis
16.7. Asia Pacific Chlorella (Chlorella pyrenoidosa) Market, by Country, 2017-2030 (US$ Mn)
16.7.1. Asia Pacific Chlorella (Chlorella pyrenoidosa) Market, by Country, 2022 Vs 2030 (in%)
16.7.2. China
16.7.2.1. China Chlorella (Chlorella pyrenoidosa) Market Estimates and Forecast, 2017-2030 (US$ Mn)
16.7.2.2. China Chlorella (Chlorella pyrenoidosa), By Source, 2017-2030 (US$ Mn)
16.7.2.3. China Chlorella (Chlorella pyrenoidosa), By Application, 2017-2030 (US$ Mn)
16.7.2.4. China Chlorella (Chlorella pyrenoidosa), By Application, 2017-2030 (US$ Mn)
16.7.2.5. China Chlorella (Chlorella pyrenoidosa), By Technology, 2017-2030 (US$ Mn)
16.7.2.6. China Chlorella (Chlorella pyrenoidosa), By Product, 2017-2030 (US$ Mn)
16.7.2.7. China Chlorella (Chlorella pyrenoidosa), By Distribution Channel, 2017-2030 (US$ Mn)
16.7.3. Japan
16.7.3.1. Japan Chlorella (Chlorella pyrenoidosa) Market Estimates and Forecast, 2017-2030 (US$ Mn)
16.7.3.2. Japan Chlorella (Chlorella pyrenoidosa), By Source, 2017-2030 (US$ Mn)
16.7.3.3. Japan Chlorella (Chlorella pyrenoidosa), By Type, 2017-2030 (US$ Mn)
16.7.3.4. Japan Chlorella (Chlorella pyrenoidosa), By Application, 2017-2030 (US$ Mn)
16.7.3.5. Japan Chlorella (Chlorella pyrenoidosa), By Technology, 2017-2030 (US$ Mn)
16.7.3.6. Japan Chlorella (Chlorella pyrenoidosa), By Product, 2017-2030 (US$ Mn)
16.7.3.7. Japan Chlorella (Chlorella pyrenoidosa), By Distribution Channel, 2017-2030 (US$ Mn)
16.7.4. India
16.7.4.1. India Chlorella (Chlorella pyrenoidosa) Market Estimates and Forecast, 2017-2030 (US$ Mn)
16.7.4.2. India Chlorella (Chlorella pyrenoidosa), By Source, 2017-2030 (US$ Mn)
16.7.4.3. India Chlorella (Chlorella pyrenoidosa), By Type, 2017-2030 (US$ Mn)
16.7.4.4. India Chlorella (Chlorella pyrenoidosa), By Application, 2017-2030 (US$ Mn)
16.7.4.5. India Chlorella (Chlorella pyrenoidosa), By Technology, 2017-2030 (US$ Mn)
16.7.4.6. India Chlorella (Chlorella pyrenoidosa), By Product, 2017-2030 (US$ Mn)
16.7.4.7. India Chlorella (Chlorella pyrenoidosa), By Distribution Channel, 2017-2030 (US$ Mn)
16.7.5. South Korea
16.7.5.1. South Korea Chlorella (Chlorella pyrenoidosa) Market Estimates and Forecast, 2017-2030 (US$ Mn)
16.7.5.2. South Korea Chlorella (Chlorella pyrenoidosa), By Source, 2017-2030 (US$ Mn)
16.7.5.3. South Korea Chlorella (Chlorella pyrenoidosa), By Type, 2017-2030 (US$ Mn)
16.7.5.4. South Korea Chlorella (Chlorella pyrenoidosa), By Application, 2017-2030 (US$ Mn)
16.7.5.5. South Korea Chlorella (Chlorella pyrenoidosa), By Technology, 2017-2030 (US$ Mn)
16.7.5.6. South Korea Chlorella (Chlorella pyrenoidosa), By Product, 2017-2030 (US$ Mn)
16.7.5.7. South Korea Chlorella (Chlorella pyrenoidosa), By Distribution Channel, 2017-2030 (US$ Mn)
16.7.6. South-East Asia
16.7.6.1. South-East Asia Chlorella (Chlorella pyrenoidosa) Market Estimates and Forecast, 2017-2030 (US$ Mn)
16.7.6.2. South-East Asia Chlorella (Chlorella pyrenoidosa), By Source, 2017-2030 (US$ Mn)
16.7.6.3. South-East Asia Chlorella (Chlorella pyrenoidosa), By Type, 2017-2030 (US$ Mn)
16.7.6.4. South Korea Chlorella (Chlorella pyrenoidosa), By Product, 2017-2030 (US$ Mn)
16.7.6.5. South Korea Chlorella (Chlorella pyrenoidosa), By Application, 2017-2030 (US$ Mn)
16.7.6.6. South-East Asia Chlorella (Chlorella pyrenoidosa), By Product, 2017-2030 (US$ Mn)
16.7.6.7. South Korea Chlorella (Chlorella pyrenoidosa), By Distribution Channel, 2017-2030 (US$ Mn)
16.7.7. Rest of Asia Pacific
16.7.7.1. Rest of Asia Pacific Chlorella (Chlorella pyrenoidosa) Market Estimates and Forecast, 2017-2030 (US$ Mn)
16.7.7.2. Rest of Asia Pacific Chlorella (Chlorella pyrenoidosa), By Source, 2017-2030 (US$ Mn)
16.7.7.3. Rest of Asia Pacific Chlorella (Chlorella pyrenoidosa), By Type, 2017-2030 (US$ Mn)
16.7.7.4. Rest of Asia Pacific Chlorella (Chlorella pyrenoidosa), By Application, 2017-2030 (US$ Mn)
16.7.7.5. Rest of Asia Pacific Chlorella (Chlorella pyrenoidosa), By Technology, 2017-2030 (US$ Mn)
16.7.7.6. Rest of Asia Pacific Chlorella (Chlorella pyrenoidosa), By Product, 2017-2030 (US$ Mn)
16.7.7.7. Rest of Asia Pacific Chlorella (Chlorella pyrenoidosa), By Distribution Channel, 2017-2030 (US$ Mn)

17. Latin America Chlorella (Chlorella pyrenoidosa) Market Analysis
17.1. Latin America Chlorella (Chlorella pyrenoidosa) Market, by Source, 2017-2030(US$ Mn)
17.1.1. Overview
17.1.2. SRC Analysis
17.2. Latin America Chlorella (Chlorella pyrenoidosa) Market, by Type, 2017-2030(US$ Mn)
17.2.1. Overview
17.2.2. SRC Analysis
17.3. Latin America Chlorella (Chlorella pyrenoidosa) Market, by Application, 2017-2030(US$ Mn)
17.3.1. Overview
17.3.2. SRC Analysis
17.4. Latin America Chlorella (Chlorella pyrenoidosa) Market, by Technology, 2017-2030(US$ Mn)
17.4.1. Overview
17.4.2. SRC Analysis
17.5. Latin America Chlorella (Chlorella pyrenoidosa) Market, by Product, 2017-2030(US$ Mn)
17.5.1. Overview
17.5.2. SRC Analysis
17.6. Latin America Chlorella (Chlorella pyrenoidosa) Market, by Distribution Channel, 2017-2030(US$ Mn)
17.6.1. Overview
17.6.2. SRC Analysis
17.7. Latin America Chlorella (Chlorella pyrenoidosa) Market, by Country, 2017-2030 (US$ Mn)
17.7.1. Latin America Chlorella (Chlorella pyrenoidosa) Market, by Country, 2022 Vs 2030 (in%)
17.7.2. Brazil
17.7.2.1. Brazil Chlorella (Chlorella pyrenoidosa) Market Estimates and Forecast, 2017-2030 (US$ Mn)
17.7.2.2. Brazil Chlorella (Chlorella pyrenoidosa), By Source, 2017-2030 (US$ Mn)
17.7.2.3. Brazil Chlorella (Chlorella pyrenoidosa), By Application, 2017-2030 (US$ Mn)
17.7.2.4. Brazil Chlorella (Chlorella pyrenoidosa), By Product, 2017-2030 (US$ Mn)
17.7.2.5. Brazil Chlorella (Chlorella pyrenoidosa), By Technology, 2017-2030 (US$ Mn)
17.7.2.6. Brazil Chlorella (Chlorella pyrenoidosa), By Product, 2017-2030 (US$ Mn)
17.7.2.7. Brazil Chlorella (Chlorella pyrenoidosa), By Distribution Channel, 2017-2030 (US$ Mn)
17.7.3. Mexico
17.7.3.1. Mexico Chlorella (Chlorella pyrenoidosa) Market Estimates and Forecast, 2017-2030 (US$ Mn)
17.7.3.2. Mexico Chlorella (Chlorella pyrenoidosa), By Source, 2017-2030 (US$ Mn)
17.7.3.3. Mexico Chlorella (Chlorella pyrenoidosa), By Type, 2017-2030 (US$ Mn)
17.7.3.4. Mexico Chlorella (Chlorella pyrenoidosa), By Application, 2017-2030 (US$ Mn)
17.7.3.5. Mexico Chlorella (Chlorella pyrenoidosa), By Technology, 2017-2030 (US$ Mn)
17.7.3.6. Mexico Chlorella (Chlorella pyrenoidosa), By Product, 2017-2030 (US$ Mn)
17.7.3.7. Mexico Chlorella (Chlorella pyrenoidosa), By Distribution Channel, 2017-2030 (US$ Mn)
17.7.4. Rest of Latin America
17.7.4.1. Rest of Latin America Chlorella (Chlorella pyrenoidosa) Market Estimates and Forecast, 2017-2030 (US$ Mn)
17.7.4.2. Rest of Latin America Chlorella (Chlorella pyrenoidosa), By Source, 2017-2030 (US$ Mn)
17.7.4.3. Rest of Latin America Chlorella (Chlorella pyrenoidosa), By Type, 2017-2030 (US$ Mn)
17.7.4.4. Rest of Latin America Chlorella (Chlorella pyrenoidosa), By Application, 2017-2030 (US$ Mn)
17.7.4.5. Rest of Latin America Chlorella (Chlorella pyrenoidosa), By Technology, 2017-2030 (US$ Mn)
17.7.4.6. Rest of Latin America Chlorella (Chlorella pyrenoidosa), By Product, 2017-2030 (US$ Mn)
17.7.4.7. Rest of Latin America Chlorella (Chlorella pyrenoidosa), By Distribution Channel, 2017-2030 (US$ Mn)

18. Middle East and Africa Chlorella (Chlorella pyrenoidosa) Market Analysis
18.1. Middle East and Africa Chlorella (Chlorella pyrenoidosa) Market, by Source, 2017-2030(US$ Mn)
18.1.1. Overview
18.1.2. SRC Analysis
18.2. Middle East and Africa Chlorella (Chlorella pyrenoidosa) Market, by Type, 2017-2030(US$ Mn)
18.2.1. Overview
18.2.2. SRC Analysis
18.3. Middle East and Africa Chlorella (Chlorella pyrenoidosa) Market, by Application, 2017-2030(US$ Mn)
18.3.1. Overview
18.3.2. SRC Analysis
18.4. Middle East and Africa Chlorella (Chlorella pyrenoidosa) Market, by Technology, 2017-2030(US$ Mn)
18.4.1. Overview
18.4.2. SRC Analysis
18.5. Middle East and Africa Chlorella (Chlorella pyrenoidosa) Market, by Product, 2017-2030(US$ Mn)
18.5.1. Overview
18.5.2. SRC Analysis
18.6. Middle East and Africa Chlorella (Chlorella pyrenoidosa) Market, by Distribution Channel, 2017-2030(US$ Mn)
18.6.1. Overview
18.6.2. SRC Analysis
18.7. Middle East and Africa Chlorella (Chlorella pyrenoidosa) Market, by Country, 2017-2030 (US$ Mn)
18.7.1. Middle East and Africa Chlorella (Chlorella pyrenoidosa) Market, by Country, 2022 Vs 2030 (in%)
18.7.2. GCC Countries
18.7.2.1. GCC Countries Chlorella (Chlorella pyrenoidosa) Market Estimates and Forecast, 2017-2030 (US$ Mn)
18.7.2.2. GCC Countries Chlorella (Chlorella pyrenoidosa), By Source, 2017-2030 (US$ Mn)
18.7.2.3. GCC Countries Chlorella (Chlorella pyrenoidosa), By Type, 2017-2030 (US$ Mn)
18.7.2.4. GCC Countries Chlorella (Chlorella pyrenoidosa), By Application, 2017-2030 (US$ Mn)
18.7.2.5. GCC Chlorella (Chlorella pyrenoidosa), By Technology, 2017-2030 (US$ Mn)
18.7.2.6. GCC Countries Chlorella (Chlorella pyrenoidosa), By Product, 2017-2030 (US$ Mn)
18.7.2.7. GCC Chlorella (Chlorella pyrenoidosa), By Distribution Channel, 2017-2030 (US$ Mn)
18.7.3. South Africa
18.7.3.1. South Africa Chlorella (Chlorella pyrenoidosa) Market Estimates and Forecast, 2017-2030 (US$ Mn)
18.7.3.2. South Africa Chlorella (Chlorella pyrenoidosa), By Source, 2017-2030 (US$ Mn)
18.7.3.3. South Africa Chlorella (Chlorella pyrenoidosa), By Type, 2017-2030 (US$ Mn)
18.7.3.4. South Africa Chlorella (Chlorella pyrenoidosa), By Application, 2017-2030 (US$ Mn)
18.7.3.5. South Africa Chlorella (Chlorella pyrenoidosa), By Technology, 2017-2030 (US$ Mn)
18.7.3.6. South Africa Chlorella (Chlorella pyrenoidosa), By Product, 2017-2030 (US$ Mn)
18.7.3.7. South Africa Chlorella (Chlorella pyrenoidosa), By Distribution Channel, 2017-2030 (US$ Mn)
18.7.4. Rest of Middle East and Africa
18.7.4.1. Rest of Middle East and Africa Chlorella (Chlorella pyrenoidosa) Market Estimates and Forecast, 2017-2030 (US$ Mn)
18.7.4.2. Rest of Middle East and Africa Chlorella (Chlorella pyrenoidosa), By Source, 2017-2030 (US$ Mn)
18.7.4.3. Rest of Middle East and Africa Chlorella (Chlorella pyrenoidosa), By Type, 2017-2030 (US$ Mn)
18.7.4.4. Rest of Middle East and Africa Chlorella (Chlorella pyrenoidosa), By Application, 2017-2030 (US$ Mn)
18.7.4.5. Rest of Middle East and Africa Chlorella (Chlorella pyrenoidosa), By Technology, 2017-2030 (US$ Mn)
18.7.4.6. Rest of Middle East and Africa Chlorella (Chlorella pyrenoidosa), By Product, 2017-2030 (US$ Mn)
18.7.4.7. Rest of Middle East and Africa Chlorella (Chlorella pyrenoidosa), By Distribution Channel, 2017-2030 (US$ Mn)

19. Company Profiles
19.1. GONG BIH ENTERPRISHE CO. LTD.
19.1.1. Company Overview
19.1.2. Distribution Channel/Services Portfolio
19.1.3. Geographical Presence
19.1.4. Financial Summary
19.1.4.1. Market Revenue and Net Profit (2019-2022)
19.1.4.2. Business Segment Revenue Analysis
19.1.4.3. Geographical Revenue Analysis
19.2. E.I.D. – Parry (India) Limited
19.3. Far East Bio-Tec Co., Ltd
19.4. Yaeyama Shokusan Co., Ltd
19.5. Fuqing King Dnarmsa Spirulina Co. Ltd
19.6. Tianjin Norland Biotech Co., Ltd
19.7. STAUBER Ingredients for Innovation
19.8. Sure Chemical Co., Ltd
19.9. Green Source Organics
19.10. SUN CHLORELLA CORP
19.11. FEMICO
19.12. Taiwan Chlorella Manufacturing Company
19.13. Yaeyama Shokusan Co., Ltd
19.14. Kshipra Biotech Private Limited
19.15. Kuber Impex Ltd
19.16. Divyagro.

List of Figures
FIG. 1 Global Chlorella (Chlorella pyrenoidosa) Market: Research Methodology
FIG. 2 Market Size Estimation – Top Down & Bottom up Approach
FIG. 3 Global Chlorella (Chlorella pyrenoidosa) Market Segment
FIG. 4 Global Chlorella (Chlorella pyrenoidosa) Market, by Source, 2022 (US$ Mn)
FIG. 5 Global Chlorella (Chlorella pyrenoidosa) Market, by Type, 2022 (US$ Mn)
FIG. 6 Global Chlorella (Chlorella pyrenoidosa) Market, by Application, 2022 (US$ Mn)
FIG. 7 Global Chlorella (Chlorella pyrenoidosa) Market, by Technology, 2022 (US$ Mn)
FIG. 8 Global Chlorella (Chlorella pyrenoidosa) Market, by Product, 2022 (US$ Mn)
FIG. 9 Global Chlorella (Chlorella pyrenoidosa) Market, by Distribution Channel, 2022 (US$ Mn)
FIG. 10 Global Chlorella (Chlorella pyrenoidosa) Market, by Geography, 2022 (US$ Mn)
FIG. 11 Attractive Investment Proposition, by Source, 2022
FIG. 12 Attractive Investment Proposition, by Type, 2022
FIG. 13 Attractive Investment Proposition, by Application, 2022
FIG. 14 Attractive Investment Proposition, by Technology, 2022
FIG. 15 Attractive Investment Proposition, by Product, 2022
FIG. 16 Attractive Investment Proposition, by Distribution Channel, 2022
FIG. 17 Attractive Investment Proposition, by Geography, 2022
FIG. 18 Global Market Share Analysis of Key Chlorella (Chlorella pyrenoidosa) Market Manufacturers, 2022
FIG. 19 Global Market Positioning of Key Chlorella (Chlorella pyrenoidosa) Market Manufacturers, 2022
FIG. 20 Global Chlorella (Chlorella pyrenoidosa) Market Value Contribution, By Source, 2022 & 2030 (Value %)
FIG. 21 Global Chlorella (Chlorella pyrenoidosa) Market, by Chlorella Vulgaris, Value, 2017-2030 (US$ Mn)
FIG. 22 Global Chlorella (Chlorella pyrenoidosa) Market, by Chlorella Pyrenoidosa, Value, 2017-2030 (US$ Mn)
FIG. 23 Global Chlorella (Chlorella pyrenoidosa) Market, by Chlorella Ellipsoidea, Value, 2017-2030 (US$ Mn)
FIG. 24 Global Chlorella (Chlorella pyrenoidosa) Market, by Others, Value, 2017-2030 (US$ Mn)
FIG. 25 Global Chlorella (Chlorella pyrenoidosa) Market Value Contribution, By Type, 2022 & 2030 (Value %)
FIG. 26 Global Chlorella (Chlorella pyrenoidosa) Market, by Organic, Value, 2017-2030 (US$ Mn)
FIG. 27 Global Chlorella (Chlorella pyrenoidosa) Market, by Inorganic, 2017-2030 (US$ Mn)
FIG. 28 Global Chlorella (Chlorella pyrenoidosa) Market Value Contribution, By Application, 2022 & 2030 (Value %)
FIG. 29 Global Chlorella (Chlorella pyrenoidosa) Market, by Food Industry, Value, 2017-2030 (US$ Mn)
FIG. 30 Global Chlorella (Chlorella pyrenoidosa) Market, by Pharmaceutical Industry, 2017-2030 (US$ Mn)
FIG. 31 Global Chlorella (Chlorella pyrenoidosa) Market, by Cosmetic Industry, Value, 2017-2030 (US$ Mn)
FIG. 32 Global Chlorella (Chlorella pyrenoidosa) Market, by Others, 2017-2030 (US$ Mn)
FIG. 33 Global Chlorella (Chlorella pyrenoidosa) Market Value Contribution, By Technology, 2022 & 2030 (Value %)
FIG. 34 Global Chlorella (Chlorella pyrenoidosa) Market, by Open Pods, Value, 2017-2030 (US$ Mn)
FIG. 35 Global Chlorella (Chlorella pyrenoidosa) Market, by Closed Pods, 2017-2030 (US$ Mn)
FIG. 36 Global Chlorella (Chlorella pyrenoidosa) Market, by Autotrophic, 2017-2030 (US$ Mn)
FIG. 37 Global Chlorella (Chlorella pyrenoidosa) Market, by Heterotrophic, 2017-2030 (US$ Mn)
FIG. 38 Global Chlorella (Chlorella pyrenoidosa) Market Value Contribution, By Product, 2022 & 2030 (Value %)
FIG. 39 Global Chlorella (Chlorella pyrenoidosa) Market, by Product, 2017-2030 (US$ Mn)
FIG. 40 Global Chlorella (Chlorella pyrenoidosa) Market, by Powder, 2017-2030 (US$ Mn)
FIG. 41 Global Chlorella (Chlorella pyrenoidosa) Market, by Tablets, 2017-2030 (US$ Mn)
FIG. 42 Global Chlorella (Chlorella pyrenoidosa) Market, by Extracts, 2017-2030 (US$ Mn)
FIG. 43 Global Chlorella (Chlorella pyrenoidosa) Market, by Capsules, 2017-2030 (US$ Mn)
FIG. 44 Global Chlorella (Chlorella pyrenoidosa) Market, by Others, 2017-2030 (US$ Mn)
FIG. 45 Global Chlorella (Chlorella pyrenoidosa) Market Value Contribution, By Distribution Channel, 2022 & 2030 (Value %)
FIG. 46 Global Chlorella (Chlorella pyrenoidosa) Market, by B2B, 2017-2030 (US$ Mn)
FIG. 47 Global Chlorella (Chlorella pyrenoidosa) Market, by B2C, 2017-2030 (US$ Mn)
FIG. 48 Global Chlorella (Chlorella pyrenoidosa) Market, by Offline, 2017-2030 (US$ Mn)
FIG. 49 Global Chlorella (Chlorella pyrenoidosa) Market, by Offline, 2017-2030 (US$ Mn)
FIG. 50 Global Chlorella (Chlorella pyrenoidosa) Market, by Distributors, 2017-2030 (US$ Mn)
FIG. 51 Global Chlorella (Chlorella pyrenoidosa) Market, by Retailers, 2017-2030 (US$ Mn)
FIG. 52 Global Chlorella (Chlorella pyrenoidosa) Market, by Online, 2017-2030 (US$ Mn)
FIG. 53 Global Chlorella (Chlorella pyrenoidosa) Market, by Direct-to-Consumer, 2017-2030 (US$ Mn)
FIG. 54 North America Chlorella (Chlorella pyrenoidosa) Market, 2017-2030 (US$ Mn)
FIG. 55 North America Chlorella (Chlorella pyrenoidosa) Market, 2017-2030 (US$ Mn)
FIG. 56 U.S. Chlorella (Chlorella pyrenoidosa) Market, 2017-2030 (US$ Mn)
FIG. 57 Canada Chlorella (Chlorella pyrenoidosa) Market, 2017-2030 (US$ Mn)
FIG. 58 Europe Chlorella (Chlorella pyrenoidosa) Market, 2017-2030 (US$ Mn)
FIG. 59 Germany Chlorella (Chlorella pyrenoidosa) Market, 2017-2030 (US$ Mn)
FIG. 60 France Chlorella (Chlorella pyrenoidosa) Market, 2017-2030 (US$ Mn)
FIG. 61 U.K. Chlorella (Chlorella pyrenoidosa) Market, 2017-2030 (US$ Mn)
FIG. 62 Italy Chlorella (Chlorella pyrenoidosa) Market, 2017-2030 (US$ Mn)
FIG. 63 Spain Chlorella (Chlorella pyrenoidosa) Market, 2017-2030 (US$ Mn)
FIG. 64 Rest of Europe Chlorella (Chlorella pyrenoidosa) Market, 2017-2030 (US$ Mn)
FIG. 65 Asia Pacific Chlorella (Chlorella pyrenoidosa) Market, 2017-2030 (US$ Mn)
FIG. 66 China Chlorella (Chlorella pyrenoidosa) Market, 2017-2030 (US$ Mn)
FIG. 67 Japan Chlorella (Chlorella pyrenoidosa) Market, 2017-2030 (US$ Mn)
FIG. 68 India Chlorella (Chlorella pyrenoidosa) Market, 2017-2030 (US$ Mn)
FIG. 69 South Korea Chlorella (Chlorella pyrenoidosa) Market, 2017-2030 (US$ Mn)
FIG. 70 South-East Asia Chlorella (Chlorella pyrenoidosa) Market, 2017-2030 (US$ Mn)
FIG. 71 Rest of Asia Pacific Chlorella (Chlorella pyrenoidosa) Market, 2017-2030 (US$ Mn)
FIG. 72 Latin America Chlorella (Chlorella pyrenoidosa) Market, 2017-2030 (US$ Mn)
FIG. 73 Brazil Chlorella (Chlorella pyrenoidosa) Market, 2017-2030 (US$ Mn)
FIG. 74 Mexico Chlorella (Chlorella pyrenoidosa) Market, 2017-2030 (US$ Mn)
FIG. 75 Rest of Latin America Chlorella (Chlorella pyrenoidosa) Market, 2017-2030 (US$ Mn)
FIG. 76 Middle East & Africa Chlorella (Chlorella pyrenoidosa) Market, 2017-2030 (US$ Mn)
FIG. 77 GCC Countries Chlorella (Chlorella pyrenoidosa) Market, 2017-2030 (US$ Mn)
FIG. 78 South Africa Chlorella (Chlorella pyrenoidosa) Market, 2017-2030 (US$ Mn)
FIG. 79 Rest of Middle East and Africa Chlorella (Chlorella pyrenoidosa) Market, 2017-2030 (US$ Mn)

List of Tables
TABLE 1 Market Snapshot: Global Chlorella (Chlorella pyrenoidosa) Market
TABLE 2 Global Chlorella (Chlorella pyrenoidosa) Market: Market Drivers Impact Analysis
TABLE 3 Global Chlorella (Chlorella pyrenoidosa) Market: Market Restraints Impact Analysis
TABLE 4 Global Chlorella (Chlorella pyrenoidosa) Market, by Competitive Benchmarking, 2022
TABLE 5 Global Chlorella (Chlorella pyrenoidosa) Market, by Geographical Presence Analysis, 2022
TABLE 6 Global Chlorella (Chlorella pyrenoidosa) Market, by Key Strategies Analysis, 2022
TABLE 7 Global Chlorella (Chlorella pyrenoidosa) Market, by Chlorella Vulgaris, By Region, 2017-2022 (US$ Mn)
TABLE 8 Global Chlorella (Chlorella pyrenoidosa) Market, by Chlorella Vulgaris, By Region, 2023-2030 (US$ Mn)
TABLE 9 Global Chlorella (Chlorella pyrenoidosa) Market, by Chlorella Pyrenoidosa, By Region, 2017-2022 (US$ Mn)
TABLE 10 Global Chlorella (Chlorella pyrenoidosa) Market, by Chlorella Pyrenoidosa, By Region, 2023-2030 (US$ Mn)
TABLE 11 Global Chlorella (Chlorella pyrenoidosa) Market, by Chlorella Ellipsoidea, By Region, 2017-2022 (US$ Mn)
TABLE 12 Global Chlorella (Chlorella pyrenoidosa) Market, by Chlorella Ellipsoidea, By Region, 2023-2030 (US$ Mn)
TABLE 13 Global Chlorella (Chlorella pyrenoidosa) Market, by Other Sources, By Region, 2017-2022 (US$ Mn)
TABLE 14 Global Chlorella (Chlorella pyrenoidosa) Market, by Other Sources, By Region, 2023-2030 (US$ Mn)
TABLE 15 Global Chlorella (Chlorella pyrenoidosa) Market, by Organic, By Region, 2017-2022 (US$ Mn)
TABLE 16 Global Chlorella (Chlorella pyrenoidosa) Market, by Organic, By Region, 2023-2030 (US$ Mn)
TABLE 17 Global Chlorella (Chlorella pyrenoidosa) Market, by Inorganic, By Region, 2017-2022 (US$ Mn)
TABLE 18 Global Chlorella (Chlorella pyrenoidosa) Market, by Inorganic, By Region, 2023-2030 (US$ Mn)
TABLE 19 Global Chlorella (Chlorella pyrenoidosa) Market, by Food Industry, By Region, 2017-2022 (US$ Mn)
TABLE 20 Global Chlorella (Chlorella pyrenoidosa) Market, by Food Industry, By Region, 2023-2030 (US$ Mn)
TABLE 21 Global Chlorella (Chlorella pyrenoidosa) Market, by Pharmaceutical Industry, By Region, 2017-2022 (US$ Mn)
TABLE 22 Global Chlorella (Chlorella pyrenoidosa) Market, by Pharmaceutical Industry, By Region, 2023-2030 (US$ Mn)
TABLE 23 Global Chlorella (Chlorella pyrenoidosa) Market, by Cosmetic Industry, By Region, 2017-2022 (US$ Mn)
TABLE 24 Global Chlorella (Chlorella pyrenoidosa) Market, by Cosmetic Industry, By Region, 2023-2030 (US$ Mn)
TABLE 25 Global Chlorella (Chlorella pyrenoidosa) Market, by Others, By Region, 2017-2022 (US$ Mn)
TABLE 26 Global Chlorella (Chlorella pyrenoidosa) Market, by Others, By Region, 2023-2030 (US$ Mn)
TABLE 27 Global Chlorella (Chlorella pyrenoidosa) Market, by Open Pods, By Region, 2017-2022 (US$ Mn)
TABLE 28 Global Chlorella (Chlorella pyrenoidosa) Market, by Open Pods, By Region, 2023-2030 (US$ Mn)
TABLE 29 Global Chlorella (Chlorella pyrenoidosa) Market, by Closed Pods, By Region, 2017-2022 (US$ Mn)
TABLE 30 Global Chlorella (Chlorella pyrenoidosa) Market, by Closed Pods, By Region, 2023-2030 (US$ Mn)
TABLE 31 Global Chlorella (Chlorella pyrenoidosa) Market, by Autotrophic, By Region, 2017-2022 (US$ Mn)
TABLE 32 Global Chlorella (Chlorella pyrenoidosa) Market, by Autotrophic, By Region, 2023-2030 (US$ Mn)
TABLE 33 Global Chlorella (Chlorella pyrenoidosa) Market, by Heterotrophic, By Region, 2017-2022 (US$ Mn)
TABLE 34 Global Chlorella (Chlorella pyrenoidosa) Market, by Heterotrophic, By Region, 2023-2030 (US$ Mn)
TABLE 35 Global Chlorella (Chlorella pyrenoidosa) Market, by Food Industry, By Region, 2017-2022 (US$ Mn)
TABLE 36 Global Chlorella (Chlorella pyrenoidosa) Market, by Food Industry, By Region, 2023-2030 (US$ Mn)
TABLE 37 Global Chlorella (Chlorella pyrenoidosa) Market, by Pharmaceutical Industry, By Region, 2017-2022 (US$ Mn)
TABLE 38 Global Chlorella (Chlorella pyrenoidosa) Market, by Pharmaceutical Industry, By Region, 2023-2030 (US$ Mn)
TABLE 39 Global Chlorella (Chlorella pyrenoidosa) Market, by Cosmetic Industry, By Region, 2017-2022 (US$ Mn)
TABLE 40 Global Chlorella (Chlorella pyrenoidosa) Market, by Cosmetic Industry, By Region, 2023-2030 (US$ Mn)
TABLE 41 Global Chlorella (Chlorella pyrenoidosa) Market, by Others, By Region, 2017-2022 (US$ Mn)
TABLE 42 Global Chlorella (Chlorella pyrenoidosa) Market, by Others, By Region, 2023-2030 (US$ Mn)
TABLE 43 Global Chlorella (Chlorella pyrenoidosa) Market, by Open Pods, By Region, 2017-2022 (US$ Mn)
TABLE 44 Global Chlorella (Chlorella pyrenoidosa) Market, by Open Pods, By Region, 2023-2030 (US$ Mn)
TABLE 45 Global Chlorella (Chlorella pyrenoidosa) Market, by Closed Pods, By Region, 2017-2022 (US$ Mn)
TABLE 46 Global Chlorella (Chlorella pyrenoidosa) Market, by Closed Pods, By Region, 2023-2030 (US$ Mn)
TABLE 47 Global Chlorella (Chlorella pyrenoidosa) Market, by Autotrophic, By Region, 2017-2022 (US$ Mn)
TABLE 48 Global Chlorella (Chlorella pyrenoidosa) Market, by Autotrophic, By Region, 2023-2030 (US$ Mn)
TABLE 49 Global Chlorella (Chlorella pyrenoidosa) Market, by Heterotrophic, By Region, 2017-2022 (US$ Mn)
TABLE 50 Global Chlorella (Chlorella pyrenoidosa) Market, by Heterotrophic, By Region, 2023-2030 (US$ Mn)
TABLE 51 Global Chlorella (Chlorella pyrenoidosa) Market, by Product, By Region, 2017-2022 (US$ Mn)
TABLE 52 Global Chlorella (Chlorella pyrenoidosa) Market, by Product, By Region, 2023-2030 (US$ Mn)
TABLE 53 Global Chlorella (Chlorella pyrenoidosa) Market, by Powder, By Region, 2017-2022 (US$ Mn)
TABLE 54 Global Chlorella (Chlorella pyrenoidosa) Market, by Powder, By Region, 2023-2030 (US$ Mn)
TABLE 55 Global Chlorella (Chlorella pyrenoidosa) Market, by Tablets, By Region, 2017-2022 (US$ Mn)
TABLE 56 Global Chlorella (Chlorella pyrenoidosa) Market, by Tablets, By Region, 2023-2030 (US$ Mn)
TABLE 57 Global Chlorella (Chlorella pyrenoidosa) Market, by Extracts, By Region, 2017-2022 (US$ Mn)
TABLE 58 Global Chlorella (Chlorella pyrenoidosa) Market, by Extracts, By Region, 2023-2030 (US$ Mn)
TABLE 59 Global Chlorella (Chlorella pyrenoidosa) Market, by Capsules, By Region, 2017-2022 (US$ Mn)
TABLE 60 Global Chlorella (Chlorella pyrenoidosa) Market, by Capsules, By Region, 2023-2030 (US$ Mn)
TABLE 61 Global Chlorella (Chlorella pyrenoidosa) Market, by Others, By Region, 2017-2022 (US$ Mn)
TABLE 62 Global Chlorella (Chlorella pyrenoidosa) Market, by Others, By Region, 2023-2030 (US$ Mn)
TABLE 63 Global Chlorella (Chlorella pyrenoidosa) Market, by B2B, By Region, 2017-2022 (US$ Mn)
TABLE 64 Global Chlorella (Chlorella pyrenoidosa) Market, by B2B, By Region, 2023-2030 (US$ Mn)
TABLE 65 Global Chlorella (Chlorella pyrenoidosa) Market, by B2C, By Region, 2017-2022 (US$ Mn)
TABLE 66 Global Chlorella (Chlorella pyrenoidosa) Market, by B2C, By Region, 2023-2030 (US$ Mn)
TABLE 67 Global Chlorella (Chlorella pyrenoidosa) Market, by Offline, By Region, 2017-2022 (US$ Mn)
TABLE 68 Global Chlorella (Chlorella pyrenoidosa) Market, by Offline, By Region, 2023-2030 (US$ Mn)
TABLE 69 Global Chlorella (Chlorella pyrenoidosa) Market, by Distributors, By Region, 2017-2022 (US$ Mn)
TABLE 70 Global Chlorella (Chlorella pyrenoidosa) Market, by Distributors, By Region, 2023-2030 (US$ Mn)
TABLE 71 Global Chlorella (Chlorella pyrenoidosa) Market, by Retailers, By Region, 2017-2022 (US$ Mn)
TABLE 72 Global Chlorella (Chlorella pyrenoidosa) Market, by Retailers, By Region, 2023-2030 (US$ Mn)
TABLE 73 Global Chlorella (Chlorella pyrenoidosa) Market, by Online, By Region, 2017-2022 (US$ Mn)
TABLE 74 Global Chlorella (Chlorella pyrenoidosa) Market, by Online, By Region, 2023-2030 (US$ Mn)
TABLE 75 Global Chlorella (Chlorella pyrenoidosa) Market, by Direct-to-Consumer, By Region, 2017-2022 (US$ Mn)
TABLE 76 Global Chlorella (Chlorella pyrenoidosa) Market, by Direct-to-Consumer, By Region, 2023-2030 (US$ Mn)
TABLE 77 Global Chlorella (Chlorella pyrenoidosa) Market, by Region, 2017-2022 (US$ Mn)
TABLE 78 Global Chlorella (Chlorella pyrenoidosa) Market, by Region, 2023-2030 (US$ Mn)
TABLE 79 North America Chlorella (Chlorella pyrenoidosa) Market, by Source, 2017-2022 (US$ Mn)
TABLE 80 North America Chlorella (Chlorella pyrenoidosa) Market, by Source, 2023-2030 (US$ Mn)
TABLE 81 North America Chlorella (Chlorella pyrenoidosa) Market, by Type, 2017-2022 (US$ Mn)
TABLE 82 North America Chlorella (Chlorella pyrenoidosa) Market, by Type, 2023-2030 (US$ Mn)
TABLE 83 North America Chlorella (Chlorella pyrenoidosa) Market, by Application, 2017-2022 (US$ Mn)
TABLE 84 North America Chlorella (Chlorella pyrenoidosa) Market, by Application, 2023-2030 (US$ Mn)
TABLE 85 North America Chlorella (Chlorella pyrenoidosa) Market, by Technology, 2017-2022 (US$ Mn)
TABLE 86 North America Chlorella (Chlorella pyrenoidosa) Market, by Technology, 2023-2030 (US$ Mn)
TABLE 87 North America Chlorella (Chlorella pyrenoidosa) Market, by Product, 2017-2022 (US$ Mn)
TABLE 88 North America Chlorella (Chlorella pyrenoidosa) Market, by Product, 2023-2030 (US$ Mn)
TABLE 89 North America Chlorella (Chlorella pyrenoidosa) Market, by Distribution Channel, 2023-2030 (US$ Mn)
TABLE 90 North America Chlorella (Chlorella pyrenoidosa) Market, by Country, 2017-2022 (US$ Mn)
TABLE 91 North America Chlorella (Chlorella pyrenoidosa) Market, by Country, 2023-2030 (US$ Mn)
TABLE 92 United States Chlorella (Chlorella pyrenoidosa) Market, by Source, 2017-2022 (US$ Mn)
TABLE 93 United States Chlorella (Chlorella pyrenoidosa) Market, by Source, 2023-2030 (US$ Mn)
TABLE 94 United States Chlorella (Chlorella pyrenoidosa) Market, by Type, 2017-2022 (US$ Mn)
TABLE 95 United States Chlorella (Chlorella pyrenoidosa) Market, by Type, 2023-2030 (US$ Mn)
TABLE 96 United States Chlorella (Chlorella pyrenoidosa) Market, by Application, 2017-2022 (US$ Mn)
TABLE 97 United States Chlorella (Chlorella pyrenoidosa) Market, by Application, 2023-2030 (US$ Mn)
TABLE 98 United States Chlorella (Chlorella pyrenoidosa) Market, by Technology, 2017-2022 (US$ Mn)
TABLE 99 United States Chlorella (Chlorella pyrenoidosa) Market, by Technology, 2023-2030 (US$ Mn)
TABLE 100 United States Chlorella (Chlorella pyrenoidosa) Market, by Product, 2017-2022 (US$ Mn)
TABLE 101 United States Chlorella (Chlorella pyrenoidosa) Market, by Product, 2023-2030 (US$ Mn)
TABLE 102 United States Chlorella (Chlorella pyrenoidosa) Market, by Distribution Channel, 2017-2022 (US$ Mn)
TABLE 103 United States Chlorella (Chlorella pyrenoidosa) Market, by Distribution Channel, 2023-2030 (US$ Mn)
TABLE 104 Canada Chlorella (Chlorella pyrenoidosa) Market, by Source, 2017-2022 (US$ Mn)
TABLE 105 Canada Chlorella (Chlorella pyrenoidosa) Market, by Source, 2023-2030 (US$ Mn)
TABLE 106 Canada Chlorella (Chlorella pyrenoidosa) Market, by Type, 2017-2022 (US$ Mn)
TABLE 107 Canada Chlorella (Chlorella pyrenoidosa) Market, by Type, 2023-2030 (US$ Mn)
TABLE 108 Canada Chlorella (Chlorella pyrenoidosa) Market, by Distribution Channel, 2017-2022 (US$ Mn)
TABLE 109 Canada Chlorella (Chlorella pyrenoidosa) Market, by Distribution Channel, 2023-2030 (US$ Mn)
TABLE 110 Canada Chlorella (Chlorella pyrenoidosa) Market, by Technology, 2017-2022 (US$ Mn)
TABLE 111 Canada Chlorella (Chlorella pyrenoidosa) Market, by Technology, 2023-2030 (US$ Mn)
TABLE 112 Canada Chlorella (Chlorella pyrenoidosa) Market, by Product, 2017-2022 (US$ Mn)
TABLE 113 Canada Chlorella (Chlorella pyrenoidosa) Market, by Product, 2023-2030 (US$ Mn)
TABLE 114 Canada Chlorella (Chlorella pyrenoidosa) Market, by Distribution Channel, 2017-2022 (US$ Mn)
TABLE 115 Canada Chlorella (Chlorella pyrenoidosa) Market, by Distribution Channel, 2023-2030 (US$ Mn)
TABLE 116 Europe Chlorella (Chlorella pyrenoidosa) Market, by Source, 2017-2022 (US$ Mn)
TABLE 117 Europe Chlorella (Chlorella pyrenoidosa) Market, by Source, 2023-2030 (US$ Mn)
TABLE 118 Europe Chlorella (Chlorella pyrenoidosa) Market, by Type, 2017-2022 (US$ Mn)
TABLE 119 Europe Chlorella (Chlorella pyrenoidosa) Market, by Type, 2023-2030 (US$ Mn)
TABLE 120 Europe Chlorella (Chlorella pyrenoidosa) Market, by Application, 2017-2022 (US$ Mn)
TABLE 121 Europe Chlorella (Chlorella pyrenoidosa) Market, by Application, 2023-2030 (US$ Mn)
TABLE 122 Europe Chlorella (Chlorella pyrenoidosa) Market, by Technology, 2017-2022 (US$ Mn)
TABLE 123 Europe Chlorella (Chlorella pyrenoidosa) Market, by Technology, 2023-2030 (US$ Mn)
TABLE 124 Europe Chlorella (Chlorella pyrenoidosa) Market, by Product, 2017-2022 (US$ Mn)
TABLE 125 Europe Chlorella (Chlorella pyrenoidosa) Market, by Product, 2023-2030 (US$ Mn)
TABLE 126 Europe Chlorella (Chlorella pyrenoidosa) Market, by Distribution Channel, 2017-2022 (US$ Mn)
TABLE 127 Europe Chlorella (Chlorella pyrenoidosa) Market, by Distribution Channel, 2023-2030 (US$ Mn)
TABLE 128 Europe Chlorella (Chlorella pyrenoidosa) Market, by Country, 2017-2022 (US$ Mn)
TABLE 129 Europe Chlorella (Chlorella pyrenoidosa) Market, by Country, 2023-2030 (US$ Mn)
TABLE 130 Germany Chlorella (Chlorella pyrenoidosa) Market, by Source, 2017-2022 (US$ Mn)
TABLE 131 Germany Chlorella (Chlorella pyrenoidosa) Market, by Source, 2023-2030 (US$ Mn)
TABLE 132 Germany Chlorella (Chlorella pyrenoidosa) Market, by Type, 2017-2022 (US$ Mn)
TABLE 133 Germany Chlorella (Chlorella pyrenoidosa) Market, by Type, 2023-2030 (US$ Mn)
TABLE 134 Germany Chlorella (Chlorella pyrenoidosa) Market, by Application, 2017-2022 (US$ Mn)
TABLE 135 Germany Chlorella (Chlorella pyrenoidosa) Market, by Application, 2023-2030 (US$ Mn)
TABLE 136 Germany Chlorella (Chlorella pyrenoidosa) Market, by Technology, 2017-2022 (US$ Mn)
TABLE 137 Germany Chlorella (Chlorella pyrenoidosa) Market, by Technology, 2023-2030 (US$ Mn)
TABLE 138 Germany Chlorella (Chlorella pyrenoidosa) Market, by Product, 2017-2022 (US$ Mn)
TABLE 139 Germany Chlorella (Chlorella pyrenoidosa) Market, by Product, 2023-2030 (US$ Mn)
TABLE 140 Germany Chlorella (Chlorella pyrenoidosa) Market, by Distribution Channel, 2017-2022 (US$ Mn)
TABLE 141 Germany Chlorella (Chlorella pyrenoidosa) Market, by Distribution Channel, 2023-2030 (US$ Mn)
TABLE 142 France Chlorella (Chlorella pyrenoidosa) Market, by Source, 2017-2022 (US$ Mn)
TABLE 143 France Chlorella (Chlorella pyrenoidosa) Market, by Source, 2023-2030 (US$ Mn)
TABLE 144 France Chlorella (Chlorella pyrenoidosa) Market, by Type, 2017-2022 (US$ Mn)
TABLE 145 France Chlorella (Chlorella pyrenoidosa) Market, by Type, 2023-2030 (US$ Mn)
TABLE 146 France Chlorella (Chlorella pyrenoidosa) Market, by Application, 2017-2022 (US$ Mn)
TABLE 147 France Chlorella (Chlorella pyrenoidosa) Market, by Application, 2023-2030 (US$ Mn)
TABLE 148 France Chlorella (Chlorella pyrenoidosa) Market, by Technology, 2017-2022 (US$ Mn)
TABLE 149 France Chlorella (Chlorella pyrenoidosa) Market, by Technology, 2023-2030 (US$ Mn)
TABLE 150 France Chlorella (Chlorella pyrenoidosa) Market, by Product, 2017-2022 (US$ Mn)
TABLE 151 France Chlorella (Chlorella pyrenoidosa) Market, by Product, 2023-2030 (US$ Mn)
TABLE 152 France Chlorella (Chlorella pyrenoidosa) Market, by Distribution Channel, 2017-2022 (US$ Mn)
TABLE 153 France Chlorella (Chlorella pyrenoidosa) Market, by Distribution Channel, 2023-2030 (US$ Mn)
TABLE 154 United Kingdom Chlorella (Chlorella pyrenoidosa) Market, by Source, 2017-2022 (US$ Mn)
TABLE 155 United Kingdom Chlorella (Chlorella pyrenoidosa) Market, by Source, 2023-2030 (US$ Mn)
TABLE 156 United Kingdom Chlorella (Chlorella pyrenoidosa) Market, by Type, 2017-2022 (US$ Mn)
TABLE 157 United Kingdom Chlorella (Chlorella pyrenoidosa) Market, by Type, 2023-2030 (US$ Mn)
TABLE 158 United Kingdom Chlorella (Chlorella pyrenoidosa) Market, by Application, 2017-2022 (US$ Mn)
TABLE 159 United Kingdom Chlorella (Chlorella pyrenoidosa) Market, by Application, 2023-2030 (US$ Mn)
TABLE 160 United Kingdom Chlorella (Chlorella pyrenoidosa) Market, by Technology, 2017-2022 (US$ Mn)
TABLE 161 United Kingdom Chlorella (Chlorella pyrenoidosa) Market, by Technology, 2023-2030 (US$ Mn)
TABLE 162 United Kingdom Chlorella (Chlorella pyrenoidosa) Market, by Product, 2017-2022 (US$ Mn)
TABLE 163 United Kingdom Chlorella (Chlorella pyrenoidosa) Market, by Product, 2023-2030 (US$ Mn)
TABLE 164 United Kingdom Chlorella (Chlorella pyrenoidosa) Market, by Distribution Channel, 2017-2022 (US$ Mn)
TABLE 165 United Kingdom Chlorella (Chlorella pyrenoidosa) Market, by Distribution Channel, 2023-2030 (US$ Mn)
TABLE 166 Italy Chlorella (Chlorella pyrenoidosa) Market, by Source, 2017-2022 (US$ Mn)
TABLE 167 Italy Chlorella (Chlorella pyrenoidosa) Market, by Source, 2023-2030 (US$ Mn)
TABLE 168 Italy Chlorella (Chlorella pyrenoidosa) Market, by Type, 2017-2022 (US$ Mn)
TABLE 169 Italy Chlorella (Chlorella pyrenoidosa) Market, by Type, 2023-2030 (US$ Mn)
TABLE 170 Italy Chlorella (Chlorella pyrenoidosa) Market, by Application, 2017-2022 (US$ Mn)
TABLE 171 Italy Chlorella (Chlorella pyrenoidosa) Market, by Application, 2023-2030 (US$ Mn)
TABLE 172 Italy Chlorella (Chlorella pyrenoidosa) Market, by Technology, 2017-2022 (US$ Mn)
TABLE 173 Italy Chlorella (Chlorella pyrenoidosa) Market, by Technology, 2023-2030 (US$ Mn)
TABLE 174 Italy Chlorella (Chlorella pyrenoidosa) Market, by Product, 2017-2022 (US$ Mn)
TABLE 175 Italy Chlorella (Chlorella pyrenoidosa) Market, by Product, 2023-2030 (US$ Mn)
TABLE 176 Italy Chlorella (Chlorella pyrenoidosa) Market, by Distribution Channel, 2017-2022 (US$ Mn)
TABLE 177 Italy Chlorella (Chlorella pyrenoidosa) Market, by Distribution Channel, 2023-2030 (US$ Mn)
TABLE 178 Spain Chlorella (Chlorella pyrenoidosa) Market, by Source, 2017-2022 (US$ Mn)
TABLE 179 Spain Chlorella (Chlorella pyrenoidosa) Market, by Source, 2023-2030 (US$ Mn)
TABLE 180 Spain Chlorella (Chlorella pyrenoidosa) Market, by Type, 2017-2022 (US$ Mn)
TABLE 181 Spain Chlorella (Chlorella pyrenoidosa) Market, by Type, 2023-2030 (US$ Mn)
TABLE 182 Spain Chlorella (Chlorella pyrenoidosa) Market, by Application, 2017-2022 (US$ Mn)
TABLE 183 Spain Chlorella (Chlorella pyrenoidosa) Market, by Application, 2023-2030 (US$ Mn)
TABLE 184 Spain Chlorella (Chlorella pyrenoidosa) Market, by Technology, 2017-2022 (US$ Mn)
TABLE 185 Spain Chlorella (Chlorella pyrenoidosa) Market, by Technology, 2023-2030 (US$ Mn)
TABLE 186 Spain Chlorella (Chlorella pyrenoidosa) Market, by Product, 2023-2030 (US$ Mn)
TABLE 187 Spain Chlorella (Chlorella pyrenoidosa) Market, by Product, 2017-2022 (US$ Mn)
TABLE 188 Spain Chlorella (Chlorella pyrenoidosa) Market, by Distribution Channel, 2023-2030 (US$ Mn)
TABLE 189 Rest of Europe Chlorella (Chlorella pyrenoidosa) Market, by Source, 2017-2022 (US$ Mn)
TABLE 190 Rest of Europe Chlorella (Chlorella pyrenoidosa) Market, by Source, 2023-2030 (US$ Mn)
TABLE 191 Rest of Europe Chlorella (Chlorella pyrenoidosa) Market, by Type, 2017-2022 (US$ Mn)
TABLE 192 Rest of Europe Chlorella (Chlorella pyrenoidosa) Market, by Type, 2023-2030 (US$ Mn)
TABLE 193 Rest of Europe Chlorella (Chlorella pyrenoidosa) Market, by Application, 2017-2022 (US$ Mn)
TABLE 194 Rest of Europe Chlorella (Chlorella pyrenoidosa) Market, by Application, 2023-2030 (US$ Mn)
TABLE 195 Rest of Europe Chlorella (Chlorella pyrenoidosa) Market, by Technology, 2017-2022 (US$ Mn)
TABLE 196 Rest of Europe Chlorella (Chlorella pyrenoidosa) Market, by Technology, 2023-2030 (US$ Mn)
TABLE 197 Rest of Europe Chlorella (Chlorella pyrenoidosa) Market, by Product, 2017-2022 (US$ Mn)
TABLE 198 Rest of Europe Chlorella (Chlorella pyrenoidosa) Market, by Product, 2023-2030 (US$ Mn)
TABLE 199 Rest of Europe Chlorella (Chlorella pyrenoidosa) Market, by Distribution Channel, 2017-2022 (US$ Mn)
TABLE 200 Rest of Europe Chlorella (Chlorella pyrenoidosa) Market, by Distribution Channel, 2023-2030 (US$ Mn)
TABLE 201 Asia Pacific Chlorella (Chlorella pyrenoidosa) Market, by Source, 2017-2022 (US$ Mn)
TABLE 202 Asia Pacific Chlorella (Chlorella pyrenoidosa) Market, by Source, 2023-2030 (US$ Mn)
TABLE 203 Asia Pacific Chlorella (Chlorella pyrenoidosa) Market, by Type, 2017-2022 (US$ Mn)
TABLE 204 Asia Pacific Chlorella (Chlorella pyrenoidosa) Market, by Type, 2023-2030 (US$ Mn)
TABLE 205 Asia Pacific Chlorella (Chlorella pyrenoidosa) Market, by Application, 2017-2022 (US$ Mn)
TABLE 206 Asia Pacific Chlorella (Chlorella pyrenoidosa) Market, by Application, 2023-2030 (US$ Mn)
TABLE 207 Asia Pacific Chlorella (Chlorella pyrenoidosa) Market, by Technology, 2017-2022 (US$ Mn)
TABLE 208 Asia Pacific Chlorella (Chlorella pyrenoidosa) Market, by Technology, 2023-2030 (US$ Mn)
TABLE 209 Asia Pacific Chlorella (Chlorella pyrenoidosa) Market, by Product, 2017-2022 (US$ Mn)
TABLE 210 Asia Pacific Chlorella (Chlorella pyrenoidosa) Market, by Product, 2023-2030 (US$ Mn)
TABLE 211 Asia Pacific Chlorella (Chlorella pyrenoidosa) Market, by Distribution Channel, 2017-2022 (US$ Mn)
TABLE 212 Asia Pacific Chlorella (Chlorella pyrenoidosa) Market, by Distribution Channel, 2023-2030 (US$ Mn)
TABLE 213 China Chlorella (Chlorella pyrenoidosa) Market, by Source, 2017-2022 (US$ Mn)
TABLE 214 China Chlorella (Chlorella pyrenoidosa) Market, by Source, 2023-2030 (US$ Mn)
TABLE 215 China Chlorella (Chlorella pyrenoidosa) Market, by Type, 2017-2022 (US$ Mn)
TABLE 216 China Chlorella (Chlorella pyrenoidosa) Market, by Type, 2023-2030 (US$ Mn)
TABLE 217 China Chlorella (Chlorella pyrenoidosa) Market, by Application, 2017-2022 (US$ Mn)
TABLE 218 China Chlorella (Chlorella pyrenoidosa) Market, by Application, 2023-2030 (US$ Mn)
TABLE 219 China Chlorella (Chlorella pyrenoidosa) Market, by Technology, 2017-2022 (US$ Mn)
TABLE 220 China Chlorella (Chlorella pyrenoidosa) Market, by Technology, 2023-2030 (US$ Mn)
TABLE 221 China Chlorella (Chlorella pyrenoidosa) Market, by Product, 2017-2022 (US$ Mn)
TABLE 222 China Chlorella (Chlorella pyrenoidosa) Market, by Product, 2023-2030 (US$ Mn)
TABLE 223 China Chlorella (Chlorella pyrenoidosa) Market, by Distribution Channel, 2017-2022 (US$ Mn)
TABLE 224 China Chlorella (Chlorella pyrenoidosa) Market, by Distribution Channel, 2023-2030 (US$ Mn)
TABLE 225 Japan Chlorella (Chlorella pyrenoidosa) Market, by Source, 2017-2022 (US$ Mn)
TABLE 226 Japan Chlorella (Chlorella pyrenoidosa) Market, by Source, 2023-2030 (US$ Mn)
TABLE 227 Japan Chlorella (Chlorella pyrenoidosa) Market, by Type, 2017-2022 (US$ Mn)
TABLE 228 Japan Chlorella (Chlorella pyrenoidosa) Market, by Type, 2023-2030 (US$ Mn)
TABLE 229 Japan Chlorella (Chlorella pyrenoidosa) Market, by Application, 2017-2022 (US$ Mn)
TABLE 230 Japan Chlorella (Chlorella pyrenoidosa) Market, by Application, 2023-2030 (US$ Mn)
TABLE 231 Japan Chlorella (Chlorella pyrenoidosa) Market, by Technology, 2017-2022 (US$ Mn)
TABLE 232 Japan Chlorella (Chlorella pyrenoidosa) Market, by Technology, 2023-2030 (US$ Mn)
TABLE 233 Japan Chlorella (Chlorella pyrenoidosa) Market, by Product, 2017-2022 (US$ Mn)
TABLE 234 Japan Chlorella (Chlorella pyrenoidosa) Market, by Product, 2023-2030 (US$ Mn)
TABLE 235 Japan Chlorella (Chlorella pyrenoidosa) Market, by Distribution Channel, 2017-2022 (US$ Mn)
TABLE 236 Japan Chlorella (Chlorella pyrenoidosa) Market, by Distribution Channel, 2023-2030 (US$ Mn)
TABLE 237 India Chlorella (Chlorella pyrenoidosa) Market, by Source, 2017-2022 (US$ Mn)
TABLE 238 India Chlorella (Chlorella pyrenoidosa) Market, by Source, 2023-2030 (US$ Mn)
TABLE 239 India Chlorella (Chlorella pyrenoidosa) Market, by Type, 2017-2022 (US$ Mn)
TABLE 240 India Chlorella (Chlorella pyrenoidosa) Market, by Type, 2023-2030 (US$ Mn)
TABLE 241 India Chlorella (Chlorella pyrenoidosa) Market, by Application, 2017-2022 (US$ Mn)
TABLE 242 India Chlorella (Chlorella pyrenoidosa) Market, by Application, 2023-2030 (US$ Mn)
TABLE 243 India Chlorella (Chlorella pyrenoidosa) Market, by Technology, 2017-2022 (US$ Mn)
TABLE 244 India Chlorella (Chlorella pyrenoidosa) Market, by Technology, 2023-2030 (US$ Mn)
TABLE 245 India Chlorella (Chlorella pyrenoidosa) Market, by Product, 2017-2022 (US$ Mn)
TABLE 246 India Chlorella (Chlorella pyrenoidosa) Market, by Product, 2023-2030 (US$ Mn)
TABLE 247 India Chlorella (Chlorella pyrenoidosa) Market, by Distribution Channel, 2017-2022 (US$ Mn)
TABLE 248 India Chlorella (Chlorella pyrenoidosa) Market, by Distribution Channel, 2023-2030 (US$ Mn)
TABLE 249 South Korea Chlorella (Chlorella pyrenoidosa) Market, by Source, 2017-2022 (US$ Mn)
TABLE 250 South Korea Chlorella (Chlorella pyrenoidosa) Market, by Source, 2023-2030 (US$ Mn)
TABLE 251 South Korea Chlorella (Chlorella pyrenoidosa) Market, by Type, 2017-2022 (US$ Mn)
TABLE 252 South Korea Chlorella (Chlorella pyrenoidosa) Market, by Type, 2023-2030 (US$ Mn)
TABLE 253 South Korea Chlorella (Chlorella pyrenoidosa) Market, by Application, 2017-2022 (US$ Mn)
TABLE 254 South Korea Chlorella (Chlorella pyrenoidosa) Market, by Product, 2023-2030 (US$ Mn)
TABLE 255 South Korea Chlorella (Chlorella pyrenoidosa) Market, by Application, 2017-2022 (US$ Mn)
TABLE 256 South Korea Chlorella (Chlorella pyrenoidosa) Market, by Technology, 2023-2030 (US$ Mn)
TABLE 257 South Korea Chlorella (Chlorella pyrenoidosa) Market, by Product, 2017-2022 (US$ Mn)
TABLE 258 South Korea Chlorella (Chlorella pyrenoidosa) Market, by Product, 2023-2030 (US$ Mn)
TABLE 259 South Korea Chlorella (Chlorella pyrenoidosa) Market, by Distribution Channel, 2017-2022 (US$ Mn)
TABLE 260 South Korea Chlorella (Chlorella pyrenoidosa) Market, by Distribution Channel, 2023-2030 (US$ Mn)
TABLE 261 South-East Asia Chlorella (Chlorella pyrenoidosa) Market, by Source, 2017-2022 (US$ Mn)
TABLE 262 South-East Asia Chlorella (Chlorella pyrenoidosa) Market, by Source, 2023-2030 (US$ Mn)
TABLE 263 South-East Asia Chlorella (Chlorella pyrenoidosa) Market, by Type, 2017-2022 (US$ Mn)
TABLE 264 South-East Asia Chlorella (Chlorella pyrenoidosa) Market, by Type, 2023-2030 (US$ Mn)
TABLE 265 South-East Asia Chlorella (Chlorella pyrenoidosa) Market, by Application, 2017-2022 (US$ Mn)
TABLE 266 South-East Asia Chlorella (Chlorella pyrenoidosa) Market, by Application, 2023-2030 (US$ Mn)
TABLE 267 South-East Asia Chlorella (Chlorella pyrenoidosa) Market, by Technology, 2017-2022 (US$ Mn)
TABLE 268 South-East Asia Chlorella (Chlorella pyrenoidosa) Market, by Technology, 2023-2030 (US$ Mn)
TABLE 269 South-East Asia Chlorella (Chlorella pyrenoidosa) Market, by Product, 2017-2022 (US$ Mn)
TABLE 270 South-East Asia Chlorella (Chlorella pyrenoidosa) Market, by Product, 2023-2030 (US$ Mn)
TABLE 271 South-East Asia Chlorella (Chlorella pyrenoidosa) Market, by Distribution Channel, 2017-2022 (US$ Mn)
TABLE 272 South-East Asia Chlorella (Chlorella pyrenoidosa) Market, by Distribution Channel, 2023-2030 (US$ Mn)
TABLE 273 Rest of Asia Pacific Chlorella (Chlorella pyrenoidosa) Market, by Source, 2017-2022 (US$ Mn)
TABLE 274 Rest of Asia Pacific Chlorella (Chlorella pyrenoidosa) Market, by Source, 2023-2030 (US$ Mn)
TABLE 275 Rest of Asia Pacific Chlorella (Chlorella pyrenoidosa) Market, by Type, 2017-2022 (US$ Mn)
TABLE 276 Rest of Asia Pacific Chlorella (Chlorella pyrenoidosa) Market, by Type, 2023-2030 (US$ Mn)
TABLE 277 Rest of Asia Pacific Chlorella (Chlorella pyrenoidosa) Market, by Application, 2017-2022 (US$ Mn)
TABLE 278 Rest of Asia Pacific Chlorella (Chlorella pyrenoidosa) Market, by Application, 2023-2030 (US$ Mn)
TABLE 279 Rest of Asia Pacific Chlorella (Chlorella pyrenoidosa) Market, by Technology, 2017-2022 (US$ Mn)
TABLE 280 Rest of Asia Pacific Chlorella (Chlorella pyrenoidosa) Market, by Technology, 2023-2030 (US$ Mn)
TABLE 281 Rest of Asia Pacific Chlorella (Chlorella pyrenoidosa) Market, by Product, 2017-2022 (US$ Mn)
TABLE 282 Rest of Asia Pacific Chlorella (Chlorella pyrenoidosa) Market, by Product, 2023-2030 (US$ Mn)
TABLE 283 Rest of Asia Pacific Chlorella (Chlorella pyrenoidosa) Market, by Distribution Channel, 2017-2022 (US$ Mn)
TABLE 284 Rest of Asia Pacific Chlorella (Chlorella pyrenoidosa) Market, by Distribution Channel, 2023-2030 (US$ Mn)
TABLE 285 Latin America Chlorella (Chlorella pyrenoidosa) Market, by Product, 2017-2022 (US$ Mn)
TABLE 286 Latin America Chlorella (Chlorella pyrenoidosa) Market, by Product, 2023-2030 (US$ Mn)
TABLE 287 Latin America Chlorella (Chlorella pyrenoidosa) Market, by Distribution Channel, 2017-2022 (US$ Mn)
TABLE 288 Latin America Chlorella (Chlorella pyrenoidosa) Market, by Distribution Channel, 2023-2030 (US$ Mn)
TABLE 289 Latin America Chlorella (Chlorella pyrenoidosa) Market, by Application, 2017-2022 (US$ Mn)
TABLE 290 Latin America Chlorella (Chlorella pyrenoidosa) Market, by Application, 2023-2030 (US$ Mn)
TABLE 291 Latin America Chlorella (Chlorella pyrenoidosa) Market, by Technology, 2017-2022 (US$ Mn)
TABLE 292 Latin America Chlorella (Chlorella pyrenoidosa) Market, by Technology, 2023-2030 (US$ Mn)
TABLE 293 Latin America Chlorella (Chlorella pyrenoidosa) Market, by Product, 2017-2022 (US$ Mn)
TABLE 294 Latin America Chlorella (Chlorella pyrenoidosa) Market, by Product, 2023-2030 (US$ Mn)
TABLE 295 Latin America Chlorella (Chlorella pyrenoidosa) Market, by Distribution Channel, 2017-2022 (US$ Mn)
TABLE 296 Latin America Chlorella (Chlorella pyrenoidosa) Market, by Distribution Channel, 2023-2030 (US$ Mn)
TABLE 297 Brazil Chlorella (Chlorella pyrenoidosa) Market, by Source, 2017-2022 (US$ Mn)
TABLE 298 Brazil Chlorella (Chlorella pyrenoidosa) Market, by Source, 2023-2030 (US$ Mn)
TABLE 299 Brazil Chlorella (Chlorella pyrenoidosa) Market, by Type, 2017-2022 (US$ Mn)
TABLE 300 Brazil Chlorella (Chlorella pyrenoidosa) Market, by Type, 2023-2030 (US$ Mn)
TABLE 301 Brazil Chlorella (Chlorella pyrenoidosa) Market, by Application, 2017-2022 (US$ Mn)
TABLE 302 Brazil Chlorella (Chlorella pyrenoidosa) Market, by Application, 2023-2030 (US$ Mn)
TABLE 303 Brazil Chlorella (Chlorella pyrenoidosa) Market, by Technology, 2017-2022 (US$ Mn)
TABLE 304 Brazil Chlorella (Chlorella pyrenoidosa) Market, by Technology, 2023-2030 (US$ Mn)
TABLE 305 Brazil Chlorella (Chlorella pyrenoidosa) Market, by Product, 2017-2022 (US$ Mn)
TABLE 306 Brazil Chlorella (Chlorella pyrenoidosa) Market, by Product, 2023-2030 (US$ Mn)
TABLE 307 Brazil Chlorella (Chlorella pyrenoidosa) Market, by Distribution Channel, 2017-2022 (US$ Mn)
TABLE 308 Brazil Chlorella (Chlorella pyrenoidosa) Market, by Distribution Channel, 2023-2030 (US$ Mn)
TABLE 309 Argentina Chlorella (Chlorella pyrenoidosa) Market, by Source, 2017-2022 (US$ Mn)
TABLE 310 Argentina Chlorella (Chlorella pyrenoidosa) Market, by Source, 2023-2030 (US$ Mn)
TABLE 311 Argentina Chlorella (Chlorella pyrenoidosa) Market, by Type, 2017-2022 (US$ Mn)
TABLE 312 Argentina Chlorella (Chlorella pyrenoidosa) Market, by Type, 2023-2030 (US$ Mn)
TABLE 313 Argentina Chlorella (Chlorella pyrenoidosa) Market, by Application, 2017-2022 (US$ Mn)
TABLE 314 Argentina Chlorella (Chlorella pyrenoidosa) Market, by Application, 2023-2030 (US$ Mn)
TABLE 315 Argentina Chlorella (Chlorella pyrenoidosa) Market, by Technology, 2017-2022 (US$ Mn)
TABLE 316 Argentina Chlorella (Chlorella pyrenoidosa) Market, by Technology, 2023-2030 (US$ Mn)
TABLE 317 Argentina Chlorella (Chlorella pyrenoidosa) Market, by Product, 2017-2022 (US$ Mn)
TABLE 318 Argentina Chlorella (Chlorella pyrenoidosa) Market, by Product, 2023-2030 (US$ Mn)
TABLE 319 Argentina Chlorella (Chlorella pyrenoidosa) Market, by Distribution Channel, 2017-2022 (US$ Mn)
TABLE 320 Argentina Chlorella (Chlorella pyrenoidosa) Market, by Distribution Channel, 2023-2030 (US$ Mn)
TABLE 321 Rest of Latin America Chlorella (Chlorella pyrenoidosa) Market, by Source, 2017-2022 (US$ Mn)
TABLE 322 Rest of Latin America Chlorella (Chlorella pyrenoidosa) Market, by Source, 2023-2030 (US$ Mn)
TABLE 323 Rest of Latin America Chlorella (Chlorella pyrenoidosa) Market, by Type, 2017-2022 (US$ Mn)
TABLE 324 Rest of Latin America Chlorella (Chlorella pyrenoidosa) Market, by Type, 2023-2030 (US$ Mn)
TABLE 325 Rest of Latin America Chlorella (Chlorella pyrenoidosa) Market, by Application, 2017-2022 (US$ Mn)
TABLE 326 Rest of Latin America Chlorella (Chlorella pyrenoidosa) Market, by Application, 2023-2030 (US$ Mn)
TABLE 327 Rest of Latin America Chlorella (Chlorella pyrenoidosa) Market, by Technology, 2017-2022 (US$ Mn)
TABLE 328 Rest of Latin America Chlorella (Chlorella pyrenoidosa) Market, by Technology, 2023-2030 (US$ Mn)
TABLE 329 Rest of Latin America Chlorella (Chlorella pyrenoidosa) Market, by Product, 2017-2022 (US$ Mn)
TABLE 330 Rest of Latin America Chlorella (Chlorella pyrenoidosa) Market, by Product, 2023-2030 (US$ Mn)
TABLE 331 Rest of Latin America Chlorella (Chlorella pyrenoidosa) Market, by Distribution Channel, 2017-2022 (US$ Mn)
TABLE 332 Rest of Latin America Chlorella (Chlorella pyrenoidosa) Market, by Distribution Channel, 2023-2030 (US$ Mn)
TABLE 333 Middle East and Africa Chlorella (Chlorella pyrenoidosa) Market, by Source, 2017-2022 (US$ Mn)
TABLE 334 Middle East and Africa Chlorella (Chlorella pyrenoidosa) Market, by Source, 2023-2030 (US$ Mn)
TABLE 335 Middle East and Africa Chlorella (Chlorella pyrenoidosa) Market, by Type, 2017-2022 (US$ Mn)
TABLE 336 Middle East and Africa Chlorella (Chlorella pyrenoidosa) Market, by Type, 2023-2030 (US$ Mn)
TABLE 337 Middle East and Africa Chlorella (Chlorella pyrenoidosa) Market, by Application, 2017-2022 (US$ Mn)
TABLE 338 Middle East and Africa Chlorella (Chlorella pyrenoidosa) Market, by Application, 2023-2030 (US$ Mn)
TABLE 339 Middle East and Africa Chlorella (Chlorella pyrenoidosa) Market, by Technology, 2017-2022 (US$ Mn)
TABLE 340 Middle East and Africa Chlorella (Chlorella pyrenoidosa) Market, by Technology, 2023-2030 (US$ Mn)
TABLE 341 Middle East and Africa Chlorella (Chlorella pyrenoidosa) Market, by Product, 2017-2022 (US$ Mn)
TABLE 342 Middle East and Africa Chlorella (Chlorella pyrenoidosa) Market, by Product, 2023-2030 (US$ Mn)
TABLE 343 Middle East and Africa Chlorella (Chlorella pyrenoidosa) Market, by Distribution Channel, 2017-2022 (US$ Mn)
TABLE 344 Middle East and Africa Chlorella (Chlorella pyrenoidosa) Market, by Distribution Channel, 2023-2030 (US$ Mn)
TABLE 345 GCC Countries Chlorella (Chlorella pyrenoidosa) Market, by Source, 2017-2022 (US$ Mn)
TABLE 346 GCC Countries Chlorella (Chlorella pyrenoidosa) Market, by Source, 2023-2030 (US$ Mn)
TABLE 347 GCC Countries Chlorella (Chlorella pyrenoidosa) Market, by Type, 2017-2022 (US$ Mn)
TABLE 348 GCC Countries Chlorella (Chlorella pyrenoidosa) Market, by Type, 2023-2030 (US$ Mn)
TABLE 349 GCC Countries Chlorella (Chlorella pyrenoidosa) Market, by Application, 2017-2022 (US$ Mn)
TABLE 350 GCC Countries Chlorella (Chlorella pyrenoidosa) Market, by Application, 2023-2030 (US$ Mn)
TABLE 351 GCC Countries Chlorella (Chlorella pyrenoidosa) Market, by Technology, 2017-2022 (US$ Mn)
TABLE 352 GCC Countries Chlorella (Chlorella pyrenoidosa) Market, by Technology, 2023-2030 (US$ Mn)
TABLE 353 GCC Countries Chlorella (Chlorella pyrenoidosa) Market, by Product, 2017-2022 (US$ Mn)
TABLE 354 GCC Countries Chlorella (Chlorella pyrenoidosa) Market, by Product, 2023-2030 (US$ Mn)
TABLE 355 GCC Countries Chlorella (Chlorella pyrenoidosa) Market, by Distribution Channel, 2017-2022 (US$ Mn)
TABLE 356 GCC Countries Chlorella (Chlorella pyrenoidosa) Market, by Distribution Channel, 2023-2030 (US$ Mn)
TABLE 357 South Africa Chlorella (Chlorella pyrenoidosa) Market, by Source, 2017-2022 (US$ Mn)
TABLE 358 South Africa Chlorella (Chlorella pyrenoidosa) Market, by Source, 2023-2030 (US$ Mn)
TABLE 359 South Africa Chlorella (Chlorella pyrenoidosa) Market, by Type, 2017-2022 (US$ Mn)
TABLE 360 South Africa Chlorella (Chlorella pyrenoidosa) Market, by Type, 2023-2030 (US$ Mn)
TABLE 361 South Africa Chlorella (Chlorella pyrenoidosa) Market, by Application, 2017-2022 (US$ Mn)
TABLE 362 South Africa Chlorella (Chlorella pyrenoidosa) Market, by Application, 2023-2030 (US$ Mn)
TABLE 363 South Africa Chlorella (Chlorella pyrenoidosa) Market, by Technology, 2017-2022 (US$ Mn)
TABLE 364 South Africa Chlorella (Chlorella pyrenoidosa) Market, by Technology, 2023-2030 (US$ Mn)
TABLE 365 South Africa Chlorella (Chlorella pyrenoidosa) Market, by Product, 2017-2022 (US$ Mn)
TABLE 366 South Africa Chlorella (Chlorella pyrenoidosa) Market, by Product, 2023-2030 (US$ Mn)
TABLE 367 South Africa Chlorella (Chlorella pyrenoidosa) Market, by Distribution Channel, 2017-2022 (US$ Mn)
TABLE 368 South Africa Chlorella (Chlorella pyrenoidosa) Market, by Distribution Channel, 2023-2030 (US$ Mn)
TABLE 369 South Africa Chlorella (Chlorella pyrenoidosa) Market, by Product, 2017-2022 (US$ Mn)
TABLE 370 South Africa Chlorella (Chlorella pyrenoidosa) Market, by Product, 2023-2030 (US$ Mn)
TABLE 371 Rest of Middle East and Africa Chlorella (Chlorella pyrenoidosa) Market, by Source, 2017-2022 (US$ Mn)
TABLE 372 Rest of Middle East and Africa Chlorella (Chlorella pyrenoidosa) Market, by Source, 2023-2030 (US$ Mn)
TABLE 373 Rest of Middle East and Africa Chlorella (Chlorella pyrenoidosa) Market, by Type, 2017-2022 (US$ Mn)
TABLE 374 Rest of Middle East and Africa Chlorella (Chlorella pyrenoidosa) Market, by Type, 2023-2030 (US$ Mn)
TABLE 375 Rest of Middle East and Africa Chlorella (Chlorella pyrenoidosa) Market, by Application, 2017-2022 (US$ Mn)
TABLE 376 Rest of Middle East and Africa Chlorella (Chlorella pyrenoidosa) Market, by Application, 2023-2030 (US$ Mn)
TABLE 377 Rest of Middle East and Africa Chlorella (Chlorella pyrenoidosa) Market, by Technology, 2017-2022 (US$ Mn)
TABLE 378 Rest of Middle East and Africa Chlorella (Chlorella pyrenoidosa) Market, by Technology, 2023-2030 (US$ Mn)
TABLE 379 Rest of Middle East and Africa Chlorella (Chlorella pyrenoidosa) Market, by Product, 2017-2022 (US$ Mn)
TABLE 380 Rest of Middle East and Africa Chlorella (Chlorella pyrenoidosa) Market, by Distribution Channel, 2023-2030 (US$ Mn)

Frequently Asked Questions

What is the current size of the global Chlorella (Chlorella pyrenoidosa) market?

The global Chlorella (Chlorella pyrenoidosa) market was valued at USD 312.5 Million in 2022.

What is the expected growth rate of the Chlorella (Chlorella pyrenoidosa) market between 2023 and 2030?

The Chlorella (Chlorella pyrenoidosa) market is expected to grow at a CAGR of 6.5% between 2023 and 2030, reaching USD 485.6 Million in 2030.

Which segment is leading the market share in terms of source?

Chlorella Pyrenoidosa is the leading segment by material, holding over 30% share in value in 2022.

Which technology segment governs the demand for Chlorella (Chlorella pyrenoidosa) worldwide?

The autotrophic segment governs the demand for Chlorella (Chlorella pyrenoidosa) worldwide, holding a massive share of over 25% in 2022.

Which product is expected to post the highest CAGR during the forecast period?

The powder segment is expected to grow segmentally during the forecast period.

Which region is fueling the growth of the Chlorella (Chlorella pyrenoidosa) industry?

Asia Pacific is fueling the growth of the Chlorella (Chlorella pyrenoidosa) industry, with an over one-third share in 2022.

Who are the major players in the global Chlorella (Chlorella pyrenoidosa) market?

The top players include Fuqing King Dnarmsa Spirulina Co., Ltd., Tianjin Norland Biotech Co., Ltd, STAUBER Ingredients For Innovation, Sure Chemical Co., Ltd., and Green Source Organics.

What are the major market drivers of the Chlorella (Chlorella pyrenoidosa) industry?

Increasing demand for natural and organic food ingredients by chlorella (chlorella pyrenoidosa) is the major market driver.

What are the major market restraints of the Chlorella (Chlorella pyrenoidosa) industry?

Lower awareness among consumers is the major market restraint.

What are the major market opportunities of the Chlorella (Chlorella pyrenoidosa) industry?

Growing interest in sustainable and plant-based alternatives is a major opportunity in the industry of chlorella (chlorella pyrenoidosa).

Ready Meal Trays Market

Published:
Report ID: 35054

Colostrum Market

Published:
Report ID: 3771

Citrus Essential Oil Market

Published:
Report ID: 3047

Grape Seed Extracts Market

Published:
Report ID: 6449

Food Processing Machinery Market

Published:
Report ID: 5611

Cardamom Oil Market

Published:
Report ID: 2385

Edible Insects Market

Published:
Report ID: 4785

Middle East & Africa Tahini Market

Published:
Report ID: 8471

Non-Alcoholic Energy Drinks Market

Published:
Report ID: 14315

Curcumin Market

Published:
Report ID: 4031

Corn Oil Market

Published:
Report ID: 3513

ASEAN Dysphagia Diet Thickening Agents Market

Published:
Report ID: 34321

Purchase Options

$2999
Delivery Format: Excel.
$4999
Designed for the individual purchaser.
$6999
Users located at a single corporate site or regional office.
$7999
Allowed for unlimited sharing globally within one company.
Smallform of Sample request

Have a question?

User Profile

Don’t settle for less – trust Mitul to help you find the best solution.

Report delivery within 24 to 48 hours

– Other Info –

What people say?-

User Review

I am very impressed with the information in this report. The author clearly did their research when they came up with this product and it has already given me a lot of ideas.

Jana Schmidt
CEDAR CX Technologies

– Connect with us –

Phone

+91 6232 49 3207


support

24/7 Research Support


sales@credenceresearch.com

– Research Methodology –

Going beyond the basics: advanced techniques in research methodology

– Trusted By –

Pepshi, LG, Nestle
Motorola, Honeywell, Johnson and johnson
LG Chem, SIEMENS, Pfizer
Unilever, Samsonite, QIAGEN