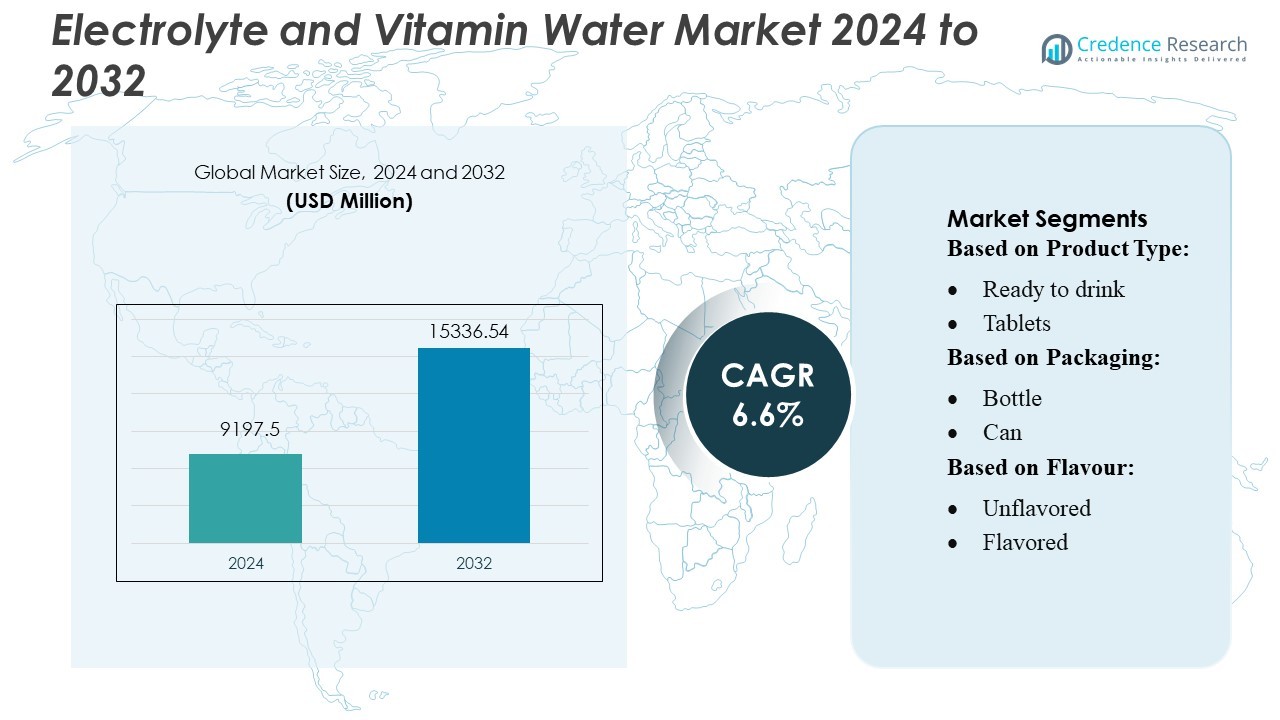
Home » Food & Beverage » Electrolyte and Vitamin Water Market

Electrolyte and Vitamin Water Market By Fortification (Vitamin Only, Electrolyte Only, Electrolyte & Vitamin) By Variants (Flavored, Non-flavored)-Growth, Future Prospects & Competitive Analysis, 2016 – 2030

Price: $4999

Published: | Report ID: 18956 | Report Format : PDF

 Key Highlights of the Report

The global Electrolyte and Vitamin Water market is segmented by fortification, variants, type, packaging, distribution channel, and region. Vitamin only is the leading segment by fortification. Flavored is the leading segment by variants. Sweetened is the leading segment by type. PET is the leading segment by packaging. The Supermarkets segment is expected to achieve the highest CAGR during the forecast period. Asia Pacific is driving the growth of the Electrolyte and Vitamin Water industry.

The key reasons fueling the market’s expansion are an increase in engagement in sports, physical fitness, and adventure activities as well as rising demand for highly nutritious beverages. Lack of scientific evidence and competition from other beverages are the factors limiting market expansion.

The expansion of modern retail channels such as supermarkets, hypermarkets, convenience stores, and online platforms has increased the accessibility and availability of electrolyte and vitamin water throughout the Asia Pacific region. Manufacturers use these distribution channels to reach a larger consumer base and capitalize on the growing demand for functional beverages.

Market Overview

The global Electrolyte and Vitamin Water market has been increasing steadily in recent years and is predicted to develop at an 8.00% CAGR between 2023 and 2030. In 2022, the market was valued at USD 7.3 billion, and it is predicted to grow to USD 12.51 billion by 2030.

What Are the Primary Factors Driving the Global Electrolyte and Vitamin Water Market?

Rising demand for highly nutritious beverages, as well as increased participation in sports, physical fitness, and adventure activities, are the primary factors driving the market’s growth.

Design Element 2

Access crucial information at unmatched prices!

Request your free sample report today & start making informed decisions powered by Credence Research!

Download Free Sample
CTA Design Element 3

What Are the Major Challenges Facing the Global Electrolyte and Vitamin Water Market?

The factors restraining the market growth are a lack of scientific proof and competition from alternative beverages.

What Are the Opportunities for Growth in the Global Electrolyte and Vitamin Water Market?

Rising health and wellness trends, product innovation, and diversification are the market’s significant opportunities.

Executive Summary

Overview of the Global Electrolyte and Vitamin Water Market

Electrolytes and vitamin water have several possible benefits, which vary depending on the composition and components utilized. Individuals participating in physical activities, sports, or workouts can benefit from electrolytes and vitamin water. Electrolytes, particularly, are important for muscular function and nerve impulses, enabling normal muscle contractions and lowering the risk of muscle cramps during exercise. Vitamin water’s added vitamins and minerals can also help with energy production and overall sports performance.

Market Definition

The electrolyte and vitamin water market is a beverage industry segment focusing on manufacturing, marketing, and selling functional water-based beverages supplemented with electrolytes and vitamins. The purpose of electrolyte water is to refill and maintain the body’s electrolyte balance, which contains minerals such as sodium, calcium, potassium, and magnesium. These electrolytes are essential for controlling various body activities, such as hydration, nerve impulses, muscular contractions, and pH equilibrium.

Market Insights

  • The global market for electrolyte and vitamin waters was valued at USD 7.3 billion in 2022, and it is predicted to reach USD 12.51 billion in 2030, rising at an 8.00% CAGR between 2023 and 2030.
  • Vitamin only is the leading segment by fortification.
  • Flavored is the leading segment by variants.
  • Sweetened is the leading segment by type.
  • PET is the leading segment by packaging.
  • The Supermarkets segment is expected to achieve the highest CAGR during the forecast period.
  • Asia Pacific is driving the growth of the Electrolyte and Vitamin Water industry.
  • North America is the second-largest region in the Electrolyte and Vitamin Water industry.
  • Europe is expected to be the fastest-growing region in the Electrolyte and Vitamin Water industry.
  • Rising demand for highly nutritious beverages and increased participation in sports, physical fitness, and adventure activities are the primary factors driving the market’s growth.
  • The factors restraining the market growth are a lack of scientific proof and competition from alternative beverages.
  • Rising health and wellness trends and product innovation and diversification are the market’s significant opportunities.

Segmentation by Fortification

  • Vitamin only is the leading segment by fortification.
  • The Electrolyte Only category is expected to grow quickly during the forecast period.
  • The Electrolyte & Vitamin category accounts for the rest of the demand in the Electrolyte and Vitamin Water Market.

Segmentation by Variants

  • Flavored is the leading segment by variants.
  • The non-flavored segment accounts for the rest of the electrolyte and vitamin water market demand.

Segmentation by Type

  • Sweetened is the leading segment by type.
  • The non-sweetened segment accounts for the rest of the electrolyte and vitamin water market demand.

Segmentation by Packaging

  • PET is the leading segment by packaging.
  • Another packaging, such as Glass and Aluminum, also contribute to the demand for Electrolyte and Vitamin Water market.

Segmentation by Distribution Channel

  • The Supermarkets segment is expected to achieve the highest CAGR during the forecast period.
  • Other distribution channels, such as Convenient Stores, Online Stores, Specialty Stores, and Others, also contribute to the demand for Electrolyte and Vitamin Water market.

Segmentation by Region

  • Due to the rising consumption of convenience foods and beverages, Asia Pacific is driving the growth of the Electrolyte and Vitamin Water industry.
  • North America is the second-largest region in the Electrolyte and Vitamin Water industry.
  • Europe is expected to be the fastest-growing region in the Electrolyte and Vitamin Water industry.
  • The rest of the world, including Latin America, the Middle East, and Africa, generates the rest of the demand for electrolytes and vitamin water.

The growing demand for electrolyte and vitamin waters can be ascribed to the increasing need for high-nutritional beverages. However, competition from alternative beverages limits market growth.

Chinese consumers are becoming more health-conscious, which has increased demand for functional beverages such as electrolytes and vitamin water. People seek easy ways to get critical vitamins and minerals into their diet. China’s fast-paced urban lifestyle has created a need for handy and on-the-go beverages. Electrolytes and vitamin water packaged in portable bottles meet the need for convenient hydration solutions, particularly among city people.

Traditional retail, e-commerce platforms, health and wellness stores, gyms, and convenience stores are among the distribution channels available in the United States. Manufacturers can increase their footprint by establishing agreements with these channels to ensure that their electrolyte and vitamin water products are more widely available.

Electrolyte and Vitamin Water Market.png

The rising demand for highly nutritious beverages

The escalating demand for nutrient-rich beverages, including electrolyte and vitamin water, has been a driving factor for the growth of the Electrolyte and Vitamin Water Market. In recent years, there has been a significant shift in consumer preferences toward healthier beverage options that offer functional benefits.

Consumers are becoming more health-conscious and actively looking for beverages that provide functional benefits and contribute to their overall well-being. Electrolytes and vitamin water are easy to replenish important nutrients while increasing hydration and giving extra health benefits. The growing demand for nutrient-rich beverages is being driven by health consciousness, active lifestyle trends, convenience, innovation, and marketing efforts, resulting in the rise of the Electrolyte and Vitamin Water Market.

The growing participation of individuals in sports, physical fitness, and adventure activities

Individuals’ increased interest in sports, physical fitness, and adventurous activities is driving the growth of the Electrolyte and Vitamin Water Market. Sports, physical fitness, and adventure activities frequently require strenuous physical exertion, resulting in a significant fluid loss via sweat. Electrolytes and vitamin water are specially made to replenish electrolytes lost during exercise, such as sodium, potassium, and magnesium. These beverages aid in keeping people hydrated and maintaining correct fluid balance, which is critical for performance and recovery.

Electrolyte and vitamin water companies frequently work with athletes, sports teams, and fitness celebrities to promote their products. Endorsements and marketing initiatives starring well-known athletes or fitness icons can greatly impact consumer choices and drive market growth. These collaborations help to promote electrolytes and vitamin water as necessary supplements for athletes and fitness companions.

Lack of scientific evidence

While electrolyte and vitamin water products promise various health benefits, some consumers may look for scientific data to support these claims. The lack of detailed scientific studies or clinical trials to substantiate the unique benefits of these products can raise consumer skepticism and impede market growth.

Competition from alternative beverages

Alternative beverages such as sports, energy, flavored water, and other functional beverages compete fiercely in the market. These beverages frequently claim to provide similar benefits, such as hydration and performance enhancement. The availability and popularity of these alternatives may represent a challenge to the electrolyte and vitamin water market’s growth.

Rising health and wellness trends

The increased emphasis on health and wellness creates a substantial opportunity for the electrolyte and vitamin water market. Consumers are increasingly seeking functional beverages that provide nutritional benefits and promote overall health. With their hydration capabilities and added vitamins and minerals, electrolyte and vitamin water correlate well with this trend, creating market growth opportunities.

Product innovation and diversification

Continuous product innovation and diversification can pave the way for new growth opportunities in the electrolyte and vitamin water industry. To meet evolving consumer tastes, manufacturers might provide new flavors, formulas, and packaging alternatives. Introducing organic or natural versions, offering unusual flavor combinations, or producing products aimed at certain consumer demographics, for example, can help capture new market segments and extend the client base.

Health and fitness integration

Integration with health and fitness apps, wearables, or smart devices does provide electrolyte and vitamin water manufacturers a big chance to increase consumer interaction and provide a more personalized experience.

Integrating electrolyte and vitamin water brands with health and fitness apps or wearables enables them to include gamification features and reward systems. Brands can establish hydration objectives, track progress, and offer prizes or incentives for reaching certain milestones. This gamified strategy increases consumer involvement, stimulates them to stay hydrated, and creates a sense of accomplishment. It can also boost brand loyalty and drive repeat purchases.

Competitive Landscape

Key Players

The global Electrolyte and Vitamin Water market is extremely competitive, with several significant competitors. The following are some of the market’s top companies and their market share:

  • Danone S.A.
  • Essentia Water LLC (Nestlé USA)
  • Frucor Suntory (Suntory Holdings Limited)
  • Karma Culture LLC
  • Keurig Dr. Pepper Inc.
  • PepsiCo Inc.
  • Talking Rain Beverage Company
  • The Alkaline Water Company Inc.
  • The Coca-Cola Company
  • Vitamin Well
  • VOSS of Norway AS

These firms prioritize product innovation, distribution channel expansion, and mergers and acquisitions to stay competitive.

The key competitors in the global Electrolyte and Vitamin Water market continuously seek to stay ahead by offering new products and developments.

In August 2022, PepsiCo, Inc. announced a strategic partnership with premium Romanian spring water AQUA Carpatica in which PepsiCo would own a 20% equity investment in AQUA Carpatica. According to the terms of the deal, PepsiCo will have the right to distribute the spring water in Romania and Poland, with the potential to grow into additional countries, such as the United States.

Bonaqua, the leading bottled water brand, announced the debut of its first label-free bottled water for individual sale in April 2022. The company will produce the Bonaqua Label-less Mineralized Water in-house.

Summary of Key Findings

  • Rising demand for highly nutritious beverages and increased participation in sports, physical fitness, and adventure activities are the primary factors driving the market’s growth.
  • Market segmented by fortification, variants, type, packaging, distribution channel, and region.
  • Vitamin only is the leading segment by fortification.
  • Flavored is the leading segment by variants.
  • Sweetened is the leading segment by type.
  • PET is the leading segment by packaging.
  • The Supermarkets segment is expected to achieve the highest CAGR during the forecast period.
  • Asia Pacific is leading market growth; the market is highly competitive with key players including PepsiCo Inc., Talking Rain Beverage Company, The Alkaline Water Company Inc., and Coca-Cola Company.

Shape Your Report to Specific Countries or Regions & Enjoy 30% Off!

Future Outlook

  • With rising health and wellness trends, the global electrolyte and vitamin water market has a bright future.
  • Rising demand for highly nutritious beverages and increased participation in sports, physical fitness, and adventure activities are the primary factors driving the market’s growth.
  • The factors restraining the market growth are a lack of scientific proof and competition from alternative beverages.
  • Key firms must focus on product innovation, growing market reach, and maintaining competitive pricing to keep ahead of the competition.

Segmentation

  • By Fortification
    • Vitamin Only
    • Electrolyte Only
    • Electrolyte & Vitamin
  • By Variants
    • Flavored
    • Non-flavored
  • By Type
    • Sweetened
    • Non-sweetened
  • By Packaging
    • PET
    • Glass
    • Aluminum
  • By Distribution Channel
    • Supermarkets
    • Convenient Stores
    • Online Stores
    • Specialty Stores
    • Others
  • By Region
  • North America
    • The US.
    • Canada
    • Mexico
  • Europe
    • Germany
    • France
    • The U.K.
    • Italy
    • Spain
    • Rest of Europe
  • Asia Pacific
    • China
    • Japan
    • India
    • South Korea
    • South-east Asia
    • Rest of Asia Pacific
  • Latin America
    • Brazil
    • Argentina
    • Rest of Latin America
  • Middle East & Africa
    • GCC Countries
    • South Africa
    • Rest of the Middle East and Africa

1. Preface
1.1. Report Description
1.1.1. Purpose of the Report
1.1.2. Target Audience
1.1.3. USP and Key Offerings
1.2. Research Scope
1.3. Research Methodology
1.3.1. Phase I – Secondary Research
1.3.2. Phase II – Data Modelling
1.3.2.1. Company Share Analysis Model
1.3.2.2. Revenue Based Modelling
1.3.3. Phase III – Primary Research
1.3.4. Research Limitations
1.3.5. Assumptions
1.4. Market Introduction
1.5. Market Research Scope

2. Executive Summary
2.1. Market Snapshot: Global Electrolyte and Vitamin Water Market
2.2. Global Electrolyte and Vitamin Water Market, By Fortification
2.3. Global Electrolyte and Vitamin Water Market, By Variants
2.4. Global Electrolyte and Vitamin Water Market, By Type
2.5. Global Electrolyte and Vitamin Water Market, By Packaging
2.6. Global Electrolyte and Vitamin Water Market, By Distribution Channel
2.7. Global Electrolyte and Vitamin Water Market, By Region

3. Market Dynamics & Factors Analysis
3.1. Introduction
3.1.1. Global Electrolyte and Vitamin Water Market Value, 2017-2030, (US$ Bn)
3.1.2. Y-o-Y Growth Trend Analysis
3.2. Market Dynamics
3.2.1. Market Drivers
3.2.2. Market Restraints
3.2.3. Market Opportunities
3.2.4. Major Industry Challenges
3.3. Growth and Development Patterns
3.4. Investment Feasibility Analysis
3.5. Market Opportunity Analysis
3.5.1. Fortification
3.5.2. Variants
3.5.3. Type
3.5.4. Packaging
3.5.5. Distribution Channel
3.5.6. Geography

4. Premium Insights
4.1. STAR (Situation, Task, Action, Results) Analysis
4.2. Porter’s Five Forces Analysis
4.2.1. Threat of New Entrants
4.2.2. Bargaining Power of Buyers/Consumers
4.2.3. Bargaining Power of Suppliers
4.2.4. Threat of Substitute Types
4.2.5. Intensity of Competitive Rivalry
4.3. Key Market Trends
4.3.1. Demand Side Trends
4.3.2. Supply Side Trends
4.4. Value Chain Analysis
4.5. Technology Analysis
4.6. Analysis and Recommendations
4.7. Marketing Strategy Analysis
4.7.1. Direct Marketing
4.7.2. Indirect Marketing
4.7.3. Marketing Channel Development Trend

5. Market Positioning of Key Players, 2022
5.1. Company market share of key players, 2022
5.2. Competitive Benchmarking
5.3. Market Positioning of Key Vendors
5.4. Geographical Presence Analysis
5.5. Major Strategies Adopted by Key Players
5.5.1. Key Strategies Analysis
5.5.2. Mergers and Acquisitions
5.5.3. Partnerships
5.5.4. Product Launch
5.5.5. Geographical Expansion
5.5.6. Others

6. Economic Impact Analysis
6.1. Recession Impact
6.1.1. North America
6.1.2. Europe
6.1.3. Asia Pacific
6.1.4. Latin America
6.1.5. Middle East and Africa
6.2. Ukraine-Russia War Impact
6.2.1. North America
6.2.2. Europe
6.2.3. Asia Pacific
6.2.4. Latin America
6.2.5. Middle East and Africa
6.3. COVID-19 Impact Analysis
6.3.1. North America
6.3.2. Europe
6.3.3. Asia Pacific
6.3.4. Latin America
6.3.5. Middle East and Africa

7. Global Electrolyte and Vitamin Water Market, By Fortification
7.1. Global Electrolyte and Vitamin Water Market Overview, By Fortification
7.1.1. Global Electrolyte and Vitamin Water Market Revenue Share, By Fortification, 2022 Vs 2030 (in %)
7.2. Vitamin Only
7.2.1. Global Electrolyte and Vitamin Water Market, By Region, 2017-2030 (US$ Bn)
7.3. Electrolyte Only
7.3.1. Global Electrolyte and Vitamin Water Market, By Region, 2017-2030 (US$ Bn)
7.4. Electrolyte & Vitamin
7.4.1. Global Electrolyte and Vitamin Water Market, By Region, 2017-2030 (US$ Bn)

8. Global Electrolyte and Vitamin Water Market, By Variants
8.1. Global Electrolyte and Vitamin Water Market Overview, By Variants
8.1.1. Global Electrolyte and Vitamin Water Market, By Variants, 2022 vs 2030 (in %)
8.2. Flavored
8.2.1. Global Electrolyte and Vitamin Water Market, By Region, 2017-2030 (US$ Bn)
8.3. Non-flavored
8.3.1. Global Electrolyte and Vitamin Water Market, By Region, 2017-2030 (US$ Bn)

9. Global Electrolyte and Vitamin Water Market, By Type, 2017-2030 (US$ Bn)
9.1. Global Electrolyte and Vitamin Water Market Overview, By Type
9.1.1. Global Electrolyte and Vitamin Water Market, By Type, 2022 vs 2030 (in%)
9.2. Sweetened
9.2.1. Global Electrolyte and Vitamin Water Market, By Region, 2017-2030 (US$ Bn)
9.3. Non-sweetened
9.3.1. Global Electrolyte and Vitamin Water Market, By Region, 2017-2030 (US$ Bn)

10. Global Electrolyte and Vitamin Water Market, by Packaging, 2017-2030 (US$ Bn)
10.1. Global Electrolyte and Vitamin Water Market Overview, by Packaging
10.1.1. Global Electrolyte and Vitamin Water Market, By Packaging, 2022 vs 2030 (in%)
10.2. PET
10.2.1. Global Electrolyte and Vitamin Water Market, By Region, 2017-2030 (US$ Bn)
10.3. Glass
10.3.1. Global Electrolyte and Vitamin Water Market, By Region, 2017-2030 (US$ Bn)
10.4. Aluminum
10.4.1. Global Electrolyte and Vitamin Water Market, By Region, 2017-2030 (US$ Bn)

11. Global Electrolyte and Vitamin Water Market, by Distribution Channel, 2017-2030 (US$ Bn)
11.1. Global Electrolyte and Vitamin Water Market Overview, by Distribution Channel
11.1.1. Global Electrolyte and Vitamin Water Market, By Distribution Channel, 2022 vs 2030 (in%)
11.2. Supermarkets
11.2.1. Global Electrolyte and Vitamin Water Market, By Region, 2017-2030 (US$ Bn)
11.3. Convenient Stores
11.3.1. Global Electrolyte and Vitamin Water Market, By Region, 2017-2030 (US$ Bn)
11.4. Online Stores
11.4.1. Global Electrolyte and Vitamin Water Market, By Region, 2017-2030 (US$ Bn)
11.5. Specialty Stores
11.5.1. Global Electrolyte and Vitamin Water Market, By Region, 2017-2030 (US$ Bn)
11.6. Others
11.6.1. Global Electrolyte and Vitamin Water Market, By Region, 2017-2030 (US$ Bn)

12. Global Electrolyte and Vitamin Water Market, By Region
12.1. Global Electrolyte and Vitamin Water Market Overview, by Region
12.1.1. Global Electrolyte and Vitamin Water Market, By Region, 2022 vs 2030 (in%)
12.2. Fortification
12.2.1. Global Electrolyte and Vitamin Water Market, By Fortification, 2017-2030 (US$ Bn)
12.3. Variants
12.3.1. Global Electrolyte and Vitamin Water Market, By Variants, 2017-2030 (US$ Bn)
12.4. Type
12.4.1. Global Electrolyte and Vitamin Water Market, By Type, 2017-2030 (US$ Bn)
12.5. Packaging
12.5.1. Global Electrolyte and Vitamin Water Market, By Packaging, 2017-2030 (US$ Bn)
12.6. Distribution Channel
12.6.1. Global Electrolyte and Vitamin Water Market, By Distribution Channel, 2017-2030 (US$ Bn)

13. North America Electrolyte and Vitamin Water Market Analysis
13.1. North America Electrolyte and Vitamin Water Market, By Fortification, 2017-2030(US$ Bn)
13.1.1. Overview
13.1.2. SRC Analysis
13.2. North America Electrolyte and Vitamin Water Market, By Variants, 2017-2030(US$ Bn)
13.2.1. Overview
13.2.2. SRC Analysis
13.3. North America Electrolyte and Vitamin Water Market, By Type, 2017-2030(US$ Bn)
13.3.1. Overview
13.3.2. SRC Analysis
13.4. North America Electrolyte and Vitamin Water Market, by Packaging, 2017-2030(US$ Bn)
13.4.1. Overview
13.4.2. SRC Analysis
13.5. North America Electrolyte and Vitamin Water Market, by Distribution Channel, 2017-2030(US$ Bn)
13.5.1. Overview
13.5.2. SRC Analysis
13.6. North America Electrolyte and Vitamin Water Market, by Country, 2017-2030 (US$ Bn)
13.6.1. North America Electrolyte and Vitamin Water Market, by Country, 2022 Vs 2030 (in%)
13.6.2. U.S.
13.6.2.1. U.S. Electrolyte and Vitamin Water Market Estimates and Forecast, 2017-2030 (US$ Bn)
13.6.2.2. U.S. Electrolyte and Vitamin Water, By Fortification, 2017-2030 (US$ Bn)
13.6.2.3. U.S. Electrolyte and Vitamin Water, By Variants, 2017-2030 (US$ Bn)
13.6.2.4. U.S. Electrolyte and Vitamin Water, By Type, 2017-2030 (US$ Bn)
13.6.2.5. U.S. Electrolyte and Vitamin Water, By Packaging, 2017-2030 (US$ Bn)
13.6.2.6. U.S. Electrolyte and Vitamin Water, By Distribution Channel, 2017-2030 (US$ Bn)
13.6.3. Canada
13.6.3.1. Canada Electrolyte and Vitamin Water Market Estimates and Forecast, 2017-2030 (US$ Bn)
13.6.3.2. Canada Electrolyte and Vitamin Water, By Fortification, 2017-2030 (US$ Bn)
13.6.3.3. Canada Electrolyte and Vitamin Water, By Variants, 2017-2030 (US$ Bn)
13.6.3.4. Canada Electrolyte and Vitamin Water, By Type, 2017-2030 (US$ Bn)
13.6.3.5. Canada Electrolyte and Vitamin Water, By Packaging, 2017-2030 (US$ Bn)
13.6.3.6. Canada Electrolyte and Vitamin Water, By Distribution Channel, 2017-2030 (US$ Bn)
13.6.4. Mexico
13.6.4.1. Mexico Electrolyte and Vitamin Water Market Estimates and Forecast, 2017-2030 (US$ Bn)
13.6.4.2. Mexico Electrolyte and Vitamin Water, By Fortification, 2017-2030 (US$ Bn)
13.6.4.3. Mexico Electrolyte and Vitamin Water, By Variants, 2017-2030 (US$ Bn)
13.6.4.4. Mexico Electrolyte and Vitamin Water, By Type, 2017-2030 (US$ Bn)
13.6.4.5. Mexico Electrolyte and Vitamin Water, By Packaging, 2017-2030 (US$ Bn)
13.6.4.6. Mexico Electrolyte and Vitamin Water, By Distribution Channel, 2017-2030 (US$ Bn)

14. Europe Electrolyte and Vitamin Water Market Analysis
14.1. Europe Electrolyte and Vitamin Water Market, By Fortification, 2017-2030(US$ Bn)
14.1.1. Overview
14.1.2. SRC Analysis
14.2. Europe Electrolyte and Vitamin Water Market, By Variants, 2017-2030(US$ Bn)
14.2.1. Overview
14.2.2. SRC Analysis
14.3. Europe Electrolyte and Vitamin Water Market, By Type, 2017-2030(US$ Bn)
14.3.1. Overview
14.3.2. SRC Analysis
14.4. Europe Electrolyte and Vitamin Water Market, by Packaging, 2017-2030(US$ Bn)
14.4.1. Overview
14.4.2. SRC Analysis
14.5. Europe Electrolyte and Vitamin Water Market, by Distribution Channel, 2017-2030(US$ Bn)
14.5.1. Overview
14.5.2. SRC Analysis
14.6. Europe Electrolyte and Vitamin Water Market, by Country, 2017-2030 (US$ Bn)
14.6.1. Europe Electrolyte and Vitamin Water Market, by Country, 2022 Vs 2030 (in%)
14.6.2. Germany
14.6.2.1. Germany Electrolyte and Vitamin Water Market Estimates and Forecast, 2017-2030 (US$ Bn)
14.6.2.2. Germany Electrolyte and Vitamin Water, By Fortification, 2017-2030 (US$ Bn)
14.6.2.3. Germany Electrolyte and Vitamin Water, By Variants, 2017-2030 (US$ Bn)
14.6.2.4. Germany Electrolyte and Vitamin Water, By Type, 2017-2030 (US$ Bn)
14.6.2.5. Germany Electrolyte and Vitamin Water, By Packaging, 2017-2030 (US$ Bn)
14.6.2.6. Germany Electrolyte and Vitamin Water, By Distribution Channel, 2017-2030 (US$ Bn)
14.6.3. France
14.6.3.1. France Electrolyte and Vitamin Water Market Estimates and Forecast, 2017-2030 (US$ Bn)
14.6.3.2. France Electrolyte and Vitamin Water, By Fortification, 2017-2030 (US$ Bn)
14.6.3.3. France Electrolyte and Vitamin Water, By Variants, 2017-2030 (US$ Bn)
14.6.3.4. France Electrolyte and Vitamin Water, By Type, 2017-2030 (US$ Bn)
14.6.3.5. France Electrolyte and Vitamin Water, By Packaging, 2017-2030 (US$ Bn)
14.6.3.6. France Electrolyte and Vitamin Water, By Distribution Channel, 2017-2030 (US$ Bn)
14.6.4. UK
14.6.4.1. UK Electrolyte and Vitamin Water Market Estimates and Forecast, 2017-2030 (US$ Bn)
14.6.4.2. UK Electrolyte and Vitamin Water, By Fortification, 2017-2030 (US$ Bn)
14.6.4.3. UK Electrolyte and Vitamin Water, By Variants, 2017-2030 (US$ Bn)
14.6.4.4. UK Electrolyte and Vitamin Water, By Type, 2017-2030 (US$ Bn)
14.6.4.5. UK Electrolyte and Vitamin Water, By Packaging, 2017-2030 (US$ Bn)
14.6.4.6. UK Electrolyte and Vitamin Water, By Distribution Channel, 2017-2030 (US$ Bn)
14.6.5. Italy
14.6.5.1. Italy Electrolyte and Vitamin Water Market Estimates and Forecast, 2017-2030 (US$ Bn)
14.6.5.2. Italy Electrolyte and Vitamin Water, By Fortification, 2017-2030 (US$ Bn)
14.6.5.3. Italy Electrolyte and Vitamin Water, By Variants, 2017-2030 (US$ Bn)
14.6.5.4. Italy Electrolyte and Vitamin Water, By Type, 2017-2030 (US$ Bn)
14.6.5.5. Italy Electrolyte and Vitamin Water, By Packaging, 2017-2030 (US$ Bn)
14.6.5.6. Italy Electrolyte and Vitamin Water, By Distribution Channel, 2017-2030 (US$ Bn)
14.6.6. Spain
14.6.6.1. Spain Electrolyte and Vitamin Water Market Estimates and Forecast, 2017-2030 (US$ Bn)
14.6.6.2. Spain Electrolyte and Vitamin Water, By Fortification, 2017-2030 (US$ Bn)
14.6.6.3. Spain Electrolyte and Vitamin Water, By Variants, 2017-2030 (US$ Bn)
14.6.6.4. Spain Electrolyte and Vitamin Water, By Type, 2017-2030 (US$ Bn)
14.6.6.5. Spain Electrolyte and Vitamin Water, By Packaging, 2017-2030 (US$ Bn)
14.6.6.6. Spain Electrolyte and Vitamin Water, By Distribution Channel, 2017-2030 (US$ Bn)
14.6.7. Rest of Europe
14.6.7.1. Rest of Europe Electrolyte and Vitamin Water Market Estimates and Forecast, 2017-2030 (US$ Bn)
14.6.7.2. Rest of Europe Electrolyte and Vitamin Water, By Fortification, 2017-2030 (US$ Bn)
14.6.7.3. Rest of Europe Electrolyte and Vitamin Water, By Variants, 2017-2030 (US$ Bn)
14.6.7.4. Rest of Europe Electrolyte and Vitamin Water, By Type, 2017-2030 (US$ Bn)
14.6.7.5. Rest of Europe Electrolyte and Vitamin Water, By Packaging, 2017-2030 (US$ Bn)
14.6.7.6. Rest of Europe Electrolyte and Vitamin Water, By Distribution Channel, 2017-2030 (US$ Bn)

15. Asia Pacific Electrolyte and Vitamin Water Market Analysis
15.1. Asia Pacific Electrolyte and Vitamin Water Market, By Fortification, 2017-2030(US$ Bn)
15.1.1. Overview
15.1.2. SRC Analysis
15.2. Asia Pacific Electrolyte and Vitamin Water Market, By Variants, 2017-2030(US$ Bn)
15.2.1. Overview
15.2.2. SRC Analysis
15.3. Asia Pacific Electrolyte and Vitamin Water Market, By Type, 2017-2030(US$ Bn)
15.3.1. Overview
15.3.2. SRC Analysis
15.4. Asia Pacific Electrolyte and Vitamin Water Market, by Packaging, 2017-2030(US$ Bn)
15.4.1. Overview
15.4.2. SRC Analysis
15.5. Asia Pacific Electrolyte and Vitamin Water Market, by Distribution Channel, 2017-2030(US$ Bn)
15.5.1. Overview
15.5.2. SRC Analysis
15.6. Asia Pacific Electrolyte and Vitamin Water Market, by Country, 2017-2030 (US$ Bn)
15.6.1. Asia Pacific Electrolyte and Vitamin Water Market, by Country, 2022 Vs 2030 (in%)
15.6.2. China
15.6.2.1. China Electrolyte and Vitamin Water Market Estimates and Forecast, 2017-2030 (US$ Bn)
15.6.2.2. China Electrolyte and Vitamin Water, By Fortification, 2017-2030 (US$ Bn)
15.6.2.3. China Electrolyte and Vitamin Water, By Variants, 2017-2030 (US$ Bn)
15.6.2.4. China Electrolyte and Vitamin Water, By Type, 2017-2030 (US$ Bn)
15.6.2.5. China Electrolyte and Vitamin Water, By Packaging, 2017-2030 (US$ Bn)
15.6.2.6. China Electrolyte and Vitamin Water, By Distribution Channel, 2017-2030 (US$ Bn)
15.6.3. Japan
15.6.3.1. Japan Electrolyte and Vitamin Water Market Estimates and Forecast, 2017-2030 (US$ Bn)
15.6.3.2. Japan Electrolyte and Vitamin Water, By Fortification, 2017-2030 (US$ Bn)
15.6.3.3. Japan Electrolyte and Vitamin Water, By Variants, 2017-2030 (US$ Bn)
15.6.3.4. Japan Electrolyte and Vitamin Water, By Type, 2017-2030 (US$ Bn)
15.6.3.5. Japan Electrolyte and Vitamin Water, By Packaging, 2017-2030 (US$ Bn)
15.6.3.6. Japan Electrolyte and Vitamin Water, By Distribution Channel, 2017-2030 (US$ Bn)
15.6.4. India
15.6.4.1. India Electrolyte and Vitamin Water Market Estimates and Forecast, 2017-2030 (US$ Bn)
15.6.4.2. India Electrolyte and Vitamin Water, By Fortification, 2017-2030 (US$ Bn)
15.6.4.3. India Electrolyte and Vitamin Water, By Variants, 2017-2030 (US$ Bn)
15.6.4.4. India Electrolyte and Vitamin Water, By Type, 2017-2030 (US$ Bn)
15.6.4.5. India Electrolyte and Vitamin Water, By Packaging, 2017-2030 (US$ Bn)
15.6.4.6. India Electrolyte and Vitamin Water, By Distribution Channel, 2017-2030 (US$ Bn)
15.6.5. South Korea
15.6.5.1. South Korea Electrolyte and Vitamin Water Market Estimates and Forecast, 2017-2030 (US$ Bn)
15.6.5.2. South Korea Electrolyte and Vitamin Water, By Fortification, 2017-2030 (US$ Bn)
15.6.5.3. South Korea Electrolyte and Vitamin Water, By Variants, 2017-2030 (US$ Bn)
15.6.5.4. South Korea Electrolyte and Vitamin Water, By Type, 2017-2030 (US$ Bn)
15.6.5.5. South Korea Electrolyte and Vitamin Water, By Packaging, 2017-2030 (US$ Bn)
15.6.5.6. South Korea Electrolyte and Vitamin Water, By Distribution Channel, 2017-2030 (US$ Bn)
15.6.6. South-East Asia
15.6.6.1. South-East Asia Electrolyte and Vitamin Water Market Estimates and Forecast, 2017-2030 (US$ Bn)
15.6.6.2. South-East Asia Electrolyte and Vitamin Water, By Fortification, 2017-2030 (US$ Bn)
15.6.6.3. South-East Asia Electrolyte and Vitamin Water, By Variants, 2017-2030 (US$ Bn)
15.6.6.4. South-East Asia Electrolyte and Vitamin Water, By Type, 2017-2030 (US$ Bn)
15.6.6.5. South-East Asia Electrolyte and Vitamin Water, By Packaging, 2017-2030 (US$ Bn)
15.6.6.6. South-East Asia Electrolyte and Vitamin Water, By Distribution Channel, 2017-2030 (US$ Bn)
15.6.7. Rest of Asia Pacific
15.6.7.1. Rest of Asia Pacific Electrolyte and Vitamin Water Market Estimates and Forecast, 2017-2030 (US$ Bn)
15.6.7.2. Rest of Asia Pacific Electrolyte and Vitamin Water, By Fortification, 2017-2030 (US$ Bn)
15.6.7.3. Rest of Asia Pacific Electrolyte and Vitamin Water, By Variants, 2017-2030 (US$ Bn)
15.6.7.4. Rest of Asia Pacific Electrolyte and Vitamin Water, By Type, 2017-2030 (US$ Bn)
15.6.7.5. Rest of Asia Pacific Electrolyte and Vitamin Water, By Packaging, 2017-2030 (US$ Bn)
15.6.7.6. Rest of Asia Pacific Electrolyte and Vitamin Water, By Distribution Channel, 2017-2030 (US$ Bn)

16. Latin America Electrolyte and Vitamin Water Market Analysis
16.1. Latin America Electrolyte and Vitamin Water Market, By Fortification, 2017-2030(US$ Bn)
16.1.1. Overview
16.1.2. SRC Analysis
16.2. Latin America Electrolyte and Vitamin Water Market, By Variants, 2017-2030(US$ Bn)
16.2.1. Overview
16.2.2. SRC Analysis
16.3. Latin America Electrolyte and Vitamin Water Market, By Type, 2017-2030(US$ Bn)
16.3.1. Overview
16.3.2. SRC Analysis
16.4. Latin America Electrolyte and Vitamin Water Market, by Packaging, 2017-2030(US$ Bn)
16.4.1. Overview
16.4.2. SRC Analysis
16.5. Latin America Electrolyte and Vitamin Water Market, by Distribution Channel, 2017-2030(US$ Bn)
16.5.1. Overview
16.5.2. SRC Analysis
16.6. Latin America Electrolyte and Vitamin Water Market, by Country, 2017-2030 (US$ Bn)
16.6.1. Latin America Electrolyte and Vitamin Water Market, by Country, 2022 Vs 2030 (in%)
16.6.2. Brazil
16.6.2.1. Brazil Electrolyte and Vitamin Water Market Estimates and Forecast, 2017-2030 (US$ Bn)
16.6.2.2. Brazil Electrolyte and Vitamin Water, By Fortification, 2017-2030 (US$ Bn)
16.6.2.3. Brazil Electrolyte and Vitamin Water, By Variants, 2017-2030 (US$ Bn)
16.6.2.4. Brazil Electrolyte and Vitamin Water, By Type, 2017-2030 (US$ Bn)
16.6.2.5. Brazil Electrolyte and Vitamin Water, By Packaging, 2017-2030 (US$ Bn)
16.6.2.6. Brazil Electrolyte and Vitamin Water, By Distribution Channel, 2017-2030 (US$ Bn)
16.6.3. Argentina
16.6.3.1. Argentina Electrolyte and Vitamin Water Market Estimates and Forecast, 2017-2030 (US$ Bn)
16.6.3.2. Argentina Electrolyte and Vitamin Water, By Fortification, 2017-2030 (US$ Bn)
16.6.3.3. Argentina Electrolyte and Vitamin Water, By Variants, 2017-2030 (US$ Bn)
16.6.3.4. Argentina Electrolyte and Vitamin Water, By Type, 2017-2030 (US$ Bn)
16.6.3.5. Argentina Electrolyte and Vitamin Water, By Packaging, 2017-2030 (US$ Bn)
16.6.3.6. Argentina Electrolyte and Vitamin Water, By Distribution Channel, 2017-2030 (US$ Bn)
16.6.4. Rest of Latin America
16.6.4.1. Rest of Latin America Electrolyte and Vitamin Water Market Estimates and Forecast, 2017-2030 (US$ Bn)
16.6.4.2. Rest of Latin America Electrolyte and Vitamin Water, By Fortification, 2017-2030 (US$ Bn)
16.6.4.3. Rest of Latin America Electrolyte and Vitamin Water, By Variants, 2017-2030 (US$ Bn)
16.6.4.4. Rest of Latin America Electrolyte and Vitamin Water, By Type, 2017-2030 (US$ Bn)
16.6.4.5. Rest of Latin America Electrolyte and Vitamin Water, By Packaging, 2017-2030 (US$ Bn)
16.6.4.6. Rest of Latin America Electrolyte and Vitamin Water, By Distribution Channel, 2017-2030 (US$ Bn)

17. Middle East and Africa Electrolyte and Vitamin Water Market Analysis
17.1. Middle East and Africa Electrolyte and Vitamin Water Market, By Fortification, 2017-2030(US$ Bn)
17.1.1. Overview
17.1.2. SRC Analysis
17.2. Middle East and Africa Electrolyte and Vitamin Water Market, By Variants, 2017-2030(US$ Bn)
17.2.1. Overview
17.2.2. SRC Analysis
17.3. Middle East and Africa Electrolyte and Vitamin Water Market, By Type, 2017-2030(US$ Bn)
17.3.1. Overview
17.3.2. SRC Analysis
17.4. Middle East and Africa Electrolyte and Vitamin Water Market, by Packaging, 2017-2030(US$ Bn)
17.4.1. Overview
17.4.2. SRC Analysis
17.5. Middle East and Africa Electrolyte and Vitamin Water Market, by Distribution Channel, 2017-2030(US$ Bn)
17.5.1. Overview
17.5.2. SRC Analysis
17.6. Middle East and Africa Electrolyte and Vitamin Water Market, by Country, 2017-2030 (US$ Bn)
17.6.1. Middle East and Africa Electrolyte and Vitamin Water Market, by Country, 2022 Vs 2030 (in%)
17.6.2. GCC Countries
17.6.2.1. GCC Countries Electrolyte and Vitamin Water Market Estimates and Forecast, 2017-2030 (US$ Bn)
17.6.2.2. GCC Countries Electrolyte and Vitamin Water, By Fortification, 2017-2030 (US$ Bn)
17.6.2.3. GCC Countries Electrolyte and Vitamin Water, By Variants, 2017-2030 (US$ Bn)
17.6.2.4. GCC Countries Electrolyte and Vitamin Water, By Type, 2017-2030 (US$ Bn)
17.6.2.5. GCC Countries Electrolyte and Vitamin Water, By Packaging, 2017-2030 (US$ Bn)
17.6.2.6. GCC Countries Electrolyte and Vitamin Water, By Distribution Channel, 2017-2030 (US$ Bn)
17.6.3. South Africa
17.6.3.1. South Africa Electrolyte and Vitamin Water Market Estimates and Forecast, 2017-2030 (US$ Bn)
17.6.3.2. South Africa Electrolyte and Vitamin Water, By Fortification, 2017-2030 (US$ Bn)
17.6.3.3. South Africa Electrolyte and Vitamin Water, By Variants, 2017-2030 (US$ Bn)
17.6.3.4. South Africa Electrolyte and Vitamin Water, By Type, 2017-2030 (US$ Bn)
17.6.3.5. South Africa Electrolyte and Vitamin Water, By Packaging, 2017-2030 (US$ Bn)
17.6.3.6. South Africa Electrolyte and Vitamin Water, By Distribution Channel, 2017-2030 (US$ Bn)
17.6.4. Rest of Middle East and Africa
17.6.4.1. Rest of Middle East and Africa Electrolyte and Vitamin Water Market Estimates and Forecast, 2017-2030 (US$ Bn)
17.6.4.2. Rest of Middle East and Africa Electrolyte and Vitamin Water, By Fortification, 2017-2030 (US$ Bn)
17.6.4.3. Rest of Middle East and Africa Electrolyte and Vitamin Water, By Variants, 2017-2030 (US$ Bn)
17.6.4.4. Rest of Middle East and Africa Electrolyte and Vitamin Water, By Type, 2017-2030 (US$ Bn)
17.6.4.5. Rest of Middle East and Africa Electrolyte and Vitamin Water, By Packaging, 2017-2030 (US$ Bn)
17.6.4.6. Rest of Middle East and Africa Electrolyte and Vitamin Water, By Distribution Channel, 2017-2030 (US$ Bn)

18. Company Profiles
18.1. Danone S.A.
18.1.1. Company Overview
18.1.2. Variantss/Services Portfolio
18.1.3. Geographical Presence
18.1.4. Financial Summary
18.1.4.1. Market Revenue and Net Profit (2019-2022)
18.1.4.2. Business Segment Revenue Analysis
18.1.4.3. Geographical Revenue Analysis
18.2. Essentia Water LLC (Nestlé USA)
18.3. Frucor Suntory (Suntory Holdings Limited)
18.4. Karma Culture LLC
18.5. Keurig Dr Pepper Inc.
18.6. PepsiCo Inc.
18.7. Talking Rain Beverage Company
18.8. The Alkaline Water Company Inc.
18.9. The Coca-Cola Company
18.10. Vitamin Well
18.11. VOSS of Norway AS

List of Figures
FIG. 1 Global Electrolyte and Vitamin Water Market: Research Methodology
FIG. 2 Market Size Estimation – Top Down & Bottom up Approach
FIG. 3 Global Electrolyte and Vitamin Water Market Segmentation
FIG. 4 Global Electrolyte and Vitamin Water Market, By Fortification, 2022 (US$ Bn)
FIG. 5 Global Electrolyte and Vitamin Water Market, By Variants, 2022 (US$ Bn)
FIG. 6 Global Electrolyte and Vitamin Water Market, By Type, 2022 (US$ Bn)
FIG. 7 Global Electrolyte and Vitamin Water Market, by Packaging, 2022 (US$ Bn)
FIG. 8 Global Electrolyte and Vitamin Water Market, by Distribution Channel, 2022 (US$ Bn)
FIG. 9 Global Electrolyte and Vitamin Water Market, by Geography, 2022 (US$ Bn)
FIG. 10 Attractive Investment Proposition, By Fortification, 2022
FIG. 11 Attractive Investment Proposition, By Variants, 2022
FIG. 12 Attractive Investment Proposition, By Type, 2022
FIG. 13 Attractive Investment Proposition, by Packaging, 2022
FIG. 14 Attractive Investment Proposition, by Distribution Channel, 2022
FIG. 15 Attractive Investment Proposition, by Geography, 2022
FIG. 16 Global Market Share Analysis of Key Electrolyte and Vitamin Water Market Manufacturers, 2022
FIG. 17 Global Market Positioning of Key Electrolyte and Vitamin Water Market Manufacturers, 2022
FIG. 18 Global Electrolyte and Vitamin Water Market Value Contribution, By Fortification, 2022 & 2030 (Value %)
FIG. 19 Global Electrolyte and Vitamin Water Market, by Vitamin Only, Value, 2017-2030 (US$ Bn)
FIG. 20 Global Electrolyte and Vitamin Water Market, by Electrolyte Only, Value, 2017-2030 (US$ Bn)
FIG. 21 Global Electrolyte and Vitamin Water Market, by Electrolyte & Vitamin, Value, 2017-2030 (US$ Bn)
FIG. 22 Global Electrolyte and Vitamin Water Market Value Contribution, By Variants, 2022 & 2030 (Value %)
FIG. 23 Global Electrolyte and Vitamin Water Market, by Flavored, Value, 2017-2030 (US$ Bn)
FIG. 24 Global Electrolyte and Vitamin Water Market, by Non-flavored, 2017-2030 (US$ Bn)
FIG. 25 Global Electrolyte and Vitamin Water Market Value Contribution, By Type, 2022 & 2030 (Value %)
FIG. 26 Global Electrolyte and Vitamin Water Market, by Sweetened, Value, 2017-2030 (US$ Bn)
FIG. 27 Global Electrolyte and Vitamin Water Market, by Non-sweetened, 2017-2030 (US$ Bn)
FIG. 28 Global Electrolyte and Vitamin Water Market Value Contribution, By Packaging, 2022 & 2030 (Value %)
FIG. 29 Global Electrolyte and Vitamin Water Market, by PET, Value, 2017-2030 (US$ Bn)
FIG. 30 Global Electrolyte and Vitamin Water Market, by Glass, 2017-2030 (US$ Bn)
FIG. 31 Global Electrolyte and Vitamin Water Market, by Aluminum, 2017-2030 (US$ Bn)
FIG. 32 Global Electrolyte and Vitamin Water Market Value Contribution, By Distribution Channel, 2022 & 2030 (Value %)
FIG. 33 Global Electrolyte and Vitamin Water Market, by Supermarkets, Value, 2017-2030 (US$ Bn)
FIG. 34 Global Electrolyte and Vitamin Water Market, by Convenient Stores, 2017-2030 (US$ Bn)
FIG. 35 Global Electrolyte and Vitamin Water Market, by Online Stores, 2017-2030 (US$ Bn)
FIG. 36 Global Electrolyte and Vitamin Water Market, by Specialty Stores, 2017-2030 (US$ Bn)
FIG. 37 Global Electrolyte and Vitamin Water Market, by Others, 2017-2030 (US$ Bn)
FIG. 38 North America Electrolyte and Vitamin Water Market, 2017-2030 (US$ Bn)
FIG. 39 U.S. Electrolyte and Vitamin Water Market, 2017-2030 (US$ Bn)
FIG. 40 Canada Electrolyte and Vitamin Water Market, 2017-2030 (US$ Bn)
FIG. 41 Europe Electrolyte and Vitamin Water Market, 2017-2030 (US$ Bn)
FIG. 42 Germany Electrolyte and Vitamin Water Market, 2017-2030 (US$ Bn)
FIG. 43 France Electrolyte and Vitamin Water Market, 2017-2030 (US$ Bn)
FIG. 44 U.K. Electrolyte and Vitamin Water Market, 2017-2030 (US$ Bn)
FIG. 45 Italy Electrolyte and Vitamin Water Market, 2017-2030 (US$ Bn)
FIG. 46 Spain Electrolyte and Vitamin Water Market, 2017-2030 (US$ Bn)
FIG. 47 Rest of Europe Electrolyte and Vitamin Water Market, 2017-2030 (US$ Bn)
FIG. 48 Asia Pacific Electrolyte and Vitamin Water Market, 2017-2030 (US$ Bn)
FIG. 49 China Electrolyte and Vitamin Water Market, 2017-2030 (US$ Bn)
FIG. 50 Japan Electrolyte and Vitamin Water Market, 2017-2030 (US$ Bn)
FIG. 51 India Electrolyte and Vitamin Water Market, 2017-2030 (US$ Bn)
FIG. 52 South Korea Electrolyte and Vitamin Water Market, 2017-2030 (US$ Bn)
FIG. 53 South-East Asia Electrolyte and Vitamin Water Market, 2017-2030 (US$ Bn)
FIG. 54 Rest of Asia Pacific Electrolyte and Vitamin Water Market, 2017-2030 (US$ Bn)
FIG. 55 Latin America Electrolyte and Vitamin Water Market, 2017-2030 (US$ Bn)
FIG. 56 Brazil Electrolyte and Vitamin Water Market, 2017-2030 (US$ Bn)
FIG. 57 Mexico Electrolyte and Vitamin Water Market, 2017-2030 (US$ Bn)
FIG. 58 Rest of Latin America Electrolyte and Vitamin Water Market, 2017-2030 (US$ Bn)
FIG. 59 Middle East & Africa Electrolyte and Vitamin Water Market, 2017-2030 (US$ Bn)
FIG. 60 GCC Countries Electrolyte and Vitamin Water Market, 2017-2030 (US$ Bn)
FIG. 61 South Africa Electrolyte and Vitamin Water Market, 2017-2030 (US$ Bn)
FIG. 62 Rest of Middle East and Africa Electrolyte and Vitamin Water Market, 2017-2030 (US$ Bn)

List of Tables
TABLE 1 Market Snapshot: Global Electrolyte and Vitamin Water Market
TABLE 2 Global Electrolyte and Vitamin Water Market: Market Drivers Impact Analysis
TABLE 3 Global Electrolyte and Vitamin Water Market: Market Restraints Impact Analysis
TABLE 4 Global Electrolyte and Vitamin Water Market, by Competitive Benchmarking, 2022
TABLE 5 Global Electrolyte and Vitamin Water Market, by Geographical Presence Analysis, 2022
TABLE 6 Global Electrolyte and Vitamin Water Market, by Key Strategies Analysis, 2022
TABLE 7 Global Electrolyte and Vitamin Water Market, by Vitamin Only, By Region, 2017-2022 (US$ Bn)
TABLE 8 Global Electrolyte and Vitamin Water Market, by Vitamin Only, By Region, 2023-2030 (US$ Bn)
TABLE 9 Global Electrolyte and Vitamin Water Market, by Electrolyte Only, By Region, 2017-2022 (US$ Bn)
TABLE 10 Global Electrolyte and Vitamin Water Market, by Electrolyte Only, By Region, 2023-2030 (US$ Bn)
TABLE 11 Global Electrolyte and Vitamin Water Market, by Electrolyte & Vitamin, By Region, 2017-2022 (US$ Bn)
TABLE 12 Global Electrolyte and Vitamin Water Market, by Electrolyte & Vitamin, By Region, 2023-2030 (US$ Bn)
TABLE 13 Global Electrolyte and Vitamin Water Market, by Flavored, By Region, 2017-2022 (US$ Bn)
TABLE 14 Global Electrolyte and Vitamin Water Market, by Flavored, By Region, 2023-2030 (US$ Bn)
TABLE 15 Global Electrolyte and Vitamin Water Market, by Non-flavored, By Region, 2017-2022 (US$ Bn)
TABLE 16 Global Electrolyte and Vitamin Water Market, by Non-flavored, By Region, 2023-2030 (US$ Bn)
TABLE 17 Global Electrolyte and Vitamin Water Market, by Sweetened, By Region, 2017-2022 (US$ Bn)
TABLE 18 Global Electrolyte and Vitamin Water Market, by Sweetened, By Region, 2023-2030 (US$ Bn)
TABLE 19 Global Electrolyte and Vitamin Water Market, by Non-sweetened, By Region, 2017-2022 (US$ Bn)
TABLE 20 Global Electrolyte and Vitamin Water Market, by Non-sweetened, By Region, 2023-2030 (US$ Bn)
TABLE 21 Global Electrolyte and Vitamin Water Market, by PET, By Region, 2017-2022 (US$ Bn)
TABLE 22 Global Electrolyte and Vitamin Water Market, by PET, By Region, 2023-2030 (US$ Bn)
TABLE 23 Global Electrolyte and Vitamin Water Market, by Glass, By Region, 2017-2022 (US$ Bn)
TABLE 24 Global Electrolyte and Vitamin Water Market, by Glass, By Region, 2023-2030 (US$ Bn)
TABLE 25 Global Electrolyte and Vitamin Water Market, by Aluminum, By Region, 2017-2022 (US$ Bn)
TABLE 26 Global Electrolyte and Vitamin Water Market, by Aluminum, By Region, 2023-2030 (US$ Bn)
TABLE 27 Global Electrolyte and Vitamin Water Market, by Supermarkets, By Region, 2017-2022 (US$ Bn)
TABLE 28 Global Electrolyte and Vitamin Water Market, by Supermarkets, By Region, 2023-2030 (US$ Bn)
TABLE 29 Global Electrolyte and Vitamin Water Market, by Convenient Stores, By Region, 2017-2022 (US$ Bn)
TABLE 30 Global Electrolyte and Vitamin Water Market, by Convenient Stores, By Region, 2023-2030 (US$ Bn)
TABLE 31 Global Electrolyte and Vitamin Water Market, by Online Stores, By Region, 2017-2022 (US$ Bn)
TABLE 32 Global Electrolyte and Vitamin Water Market, by Online Stores, By Region, 2023-2030 (US$ Bn)
TABLE 33 Global Electrolyte and Vitamin Water Market, by Specialty Stores, By Region, 2017-2022 (US$ Bn)
TABLE 34 Global Electrolyte and Vitamin Water Market, by Specialty Stores, By Region, 2023-2030 (US$ Bn)
TABLE 35 Global Electrolyte and Vitamin Water Market, by Others, By Region, 2017-2022 (US$ Bn)
TABLE 36 Global Electrolyte and Vitamin Water Market, by Others, By Region, 2023-2030 (US$ Bn)
TABLE 37 Global Electrolyte and Vitamin Water Market, By Fortification, 2017-2022 (US$ Bn)
TABLE 38 Global Electrolyte and Vitamin Water Market, By Fortification, 2023-2030 (US$ Bn)
TABLE 39 Global Electrolyte and Vitamin Water Market, By Variants, 2017-2022 (US$ Bn)
TABLE 40 Global Electrolyte and Vitamin Water Market, By Variants, 2023-2030 (US$ Bn)
TABLE 41 Global Electrolyte and Vitamin Water Market, By Type, 2017-2022 (US$ Bn)
TABLE 42 Global Electrolyte and Vitamin Water Market, By Type, 2023-2030 (US$ Bn)
TABLE 43 Global Electrolyte and Vitamin Water Market, by Packaging, 2017-2022 (US$ Bn)
TABLE 44 Global Electrolyte and Vitamin Water Market, by Packaging, 2023-2030 (US$ Bn)
TABLE 45 Global Electrolyte and Vitamin Water Market, by Distribution Channel, 2017-2022 (US$ Bn)
TABLE 46 Global Electrolyte and Vitamin Water Market, by Distribution Channel, 2023-2030 (US$ Bn)
TABLE 47 Global Electrolyte and Vitamin Water Market, by Region, 2017-2022 (US$ Bn)
TABLE 48 Global Electrolyte and Vitamin Water Market, by Region, 2023-2030 (US$ Bn)
TABLE 49 North America Electrolyte and Vitamin Water Market, By Fortification, 2017-2022 (US$ Bn)
TABLE 50 North America Electrolyte and Vitamin Water Market, By Fortification, 2023-2030 (US$ Bn)
TABLE 51 North America Electrolyte and Vitamin Water Market, By Variants, 2017-2022 (US$ Bn)
TABLE 52 North America Electrolyte and Vitamin Water Market, By Variants, 2023-2030 (US$ Bn)
TABLE 53 North America Electrolyte and Vitamin Water Market, By Type, 2017-2022 (US$ Bn)
TABLE 54 North America Electrolyte and Vitamin Water Market, By Type, 2023-2030 (US$ Bn)
TABLE 55 North America Electrolyte and Vitamin Water Market, by Packaging, 2017-2022 (US$ Bn)
TABLE 56 North America Electrolyte and Vitamin Water Market, by Packaging, 2023-2030 (US$ Bn)
TABLE 57 North America Electrolyte and Vitamin Water Market, by Distribution Channel, 2017-2022 (US$ Bn)
TABLE 58 North America Electrolyte and Vitamin Water Market, by Distribution Channel, 2023-2030 (US$ Bn)
TABLE 59 North America Electrolyte and Vitamin Water Market, by Country, 2017-2022 (US$ Bn)
TABLE 60 North America Electrolyte and Vitamin Water Market, by Country, 2023-2030 (US$ Bn)
TABLE 61 United States Electrolyte and Vitamin Water Market, By Fortification, 2017-2022 (US$ Bn)
TABLE 62 United States Electrolyte and Vitamin Water Market, By Fortification, 2023-2030 (US$ Bn)
TABLE 63 United States Electrolyte and Vitamin Water Market, By Variants, 2017-2022 (US$ Bn)
TABLE 64 United States Electrolyte and Vitamin Water Market, By Variants, 2023-2030 (US$ Bn)
TABLE 65 United States Electrolyte and Vitamin Water Market, By Type, 2017-2022 (US$ Bn)
TABLE 66 United States Electrolyte and Vitamin Water Market, By Type, 2023-2030 (US$ Bn)
TABLE 67 United States Electrolyte and Vitamin Water Market, by Packaging, 2017-2022 (US$ Bn)
TABLE 68 United States Electrolyte and Vitamin Water Market, by Packaging, 2023-2030 (US$ Bn)
TABLE 69 United States Electrolyte and Vitamin Water Market, by Distribution Channel, 2017-2022 (US$ Bn)
TABLE 70 United States Electrolyte and Vitamin Water Market, by Distribution Channel, 2023-2030 (US$ Bn)
TABLE 71 Canada Electrolyte and Vitamin Water Market, By Fortification, 2017-2022 (US$ Bn)
TABLE 72 Canada Electrolyte and Vitamin Water Market, By Fortification, 2023-2030 (US$ Bn)
TABLE 73 Canada Electrolyte and Vitamin Water Market, By Variants, 2017-2022 (US$ Bn)
TABLE 74 Canada Electrolyte and Vitamin Water Market, By Variants, 2023-2030 (US$ Bn)
TABLE 75 Canada Electrolyte and Vitamin Water Market, By Type, 2017-2022 (US$ Bn)
TABLE 76 Canada Electrolyte and Vitamin Water Market, By Type, 2023-2030 (US$ Bn)
TABLE 77 Canada Electrolyte and Vitamin Water Market, by Packaging, 2017-2022 (US$ Bn)
TABLE 78 Canada Electrolyte and Vitamin Water Market, by Packaging, 2023-2030 (US$ Bn)
TABLE 79 Canada Electrolyte and Vitamin Water Market, by Distribution Channel, 2017-2022 (US$ Bn)
TABLE 80 Canada Electrolyte and Vitamin Water Market, by Distribution Channel, 2023-2030 (US$ Bn)
TABLE 81 Mexico Electrolyte and Vitamin Water Market, By Fortification, 2017-2022 (US$ Bn)
TABLE 82 Mexico Electrolyte and Vitamin Water Market, By Fortification, 2023-2030 (US$ Bn)
TABLE 83 Mexico Electrolyte and Vitamin Water Market, By Variants, 2017-2022 (US$ Bn)
TABLE 84 Mexico Electrolyte and Vitamin Water Market, By Variants, 2023-2030 (US$ Bn)
TABLE 85 Mexico Electrolyte and Vitamin Water Market, By Type, 2017-2022 (US$ Bn)
TABLE 86 Mexico Electrolyte and Vitamin Water Market, By Type, 2023-2030 (US$ Bn)
TABLE 87 Mexico Electrolyte and Vitamin Water Market, by Packaging, 2017-2022 (US$ Bn)
TABLE 88 Mexico Electrolyte and Vitamin Water Market, by Packaging, 2023-2030 (US$ Bn)
TABLE 89 Mexico Electrolyte and Vitamin Water Market, by Distribution Channel, 2017-2022 (US$ Bn)
TABLE 90 Mexico Electrolyte and Vitamin Water Market, by Distribution Channel, 2023-2030 (US$ Bn)
TABLE 91 Europe Electrolyte and Vitamin Water Market, By Fortification, 2017-2022 (US$ Bn)
TABLE 92 Europe Electrolyte and Vitamin Water Market, By Fortification, 2023-2030 (US$ Bn)
TABLE 93 Europe Electrolyte and Vitamin Water Market, By Variants, 2017-2022 (US$ Bn)
TABLE 94 Europe Electrolyte and Vitamin Water Market, By Variants, 2023-2030 (US$ Bn)
TABLE 95 Europe Electrolyte and Vitamin Water Market, By Type, 2017-2022 (US$ Bn)
TABLE 96 Europe Electrolyte and Vitamin Water Market, By Type, 2023-2030 (US$ Bn)
TABLE 97 Europe Electrolyte and Vitamin Water Market, by Packaging, 2017-2022 (US$ Bn)
TABLE 98 Europe Electrolyte and Vitamin Water Market, by Packaging, 2023-2030 (US$ Bn)
TABLE 99 Europe Electrolyte and Vitamin Water Market, by Distribution Channel, 2017-2022 (US$ Bn)
TABLE 100 Europe Electrolyte and Vitamin Water Market, by Distribution Channel, 2023-2030 (US$ Bn)
TABLE 101 Europe Electrolyte and Vitamin Water Market, by Country, 2017-2022 (US$ Bn)
TABLE 102 Europe Electrolyte and Vitamin Water Market, by Country, 2023-2030 (US$ Bn)
TABLE 103 Germany Electrolyte and Vitamin Water Market, By Fortification, 2017-2022 (US$ Bn)
TABLE 104 Germany Electrolyte and Vitamin Water Market, By Fortification, 2023-2030 (US$ Bn)
TABLE 105 Germany Electrolyte and Vitamin Water Market, By Variants, 2017-2022 (US$ Bn)
TABLE 106 Germany Electrolyte and Vitamin Water Market, By Variants, 2023-2030 (US$ Bn)
TABLE 107 Germany Electrolyte and Vitamin Water Market, By Type, 2017-2022 (US$ Bn)
TABLE 108 Germany Electrolyte and Vitamin Water Market, By Type, 2023-2030 (US$ Bn)
TABLE 109 Germany Electrolyte and Vitamin Water Market, by Packaging, 2017-2022 (US$ Bn)
TABLE 110 Germany Electrolyte and Vitamin Water Market, by Packaging, 2023-2030 (US$ Bn)
TABLE 111 Germany Electrolyte and Vitamin Water Market, by Distribution Channel, 2017-2022 (US$ Bn)
TABLE 112 Germany Electrolyte and Vitamin Water Market, by Distribution Channel, 2023-2030 (US$ Bn)
TABLE 113 France Electrolyte and Vitamin Water Market, By Fortification, 2017-2022 (US$ Bn)
TABLE 114 France Electrolyte and Vitamin Water Market, By Fortification, 2023-2030 (US$ Bn)
TABLE 115 France Electrolyte and Vitamin Water Market, By Variants, 2017-2022 (US$ Bn)
TABLE 116 France Electrolyte and Vitamin Water Market, By Variants, 2023-2030 (US$ Bn)
TABLE 117 France Electrolyte and Vitamin Water Market, By Type, 2017-2022 (US$ Bn)
TABLE 118 France Electrolyte and Vitamin Water Market, By Type, 2023-2030 (US$ Bn)
TABLE 119 France Electrolyte and Vitamin Water Market, by Packaging, 2017-2022 (US$ Bn)
TABLE 120 France Electrolyte and Vitamin Water Market, by Packaging, 2023-2030 (US$ Bn)
TABLE 121 France Electrolyte and Vitamin Water Market, by Distribution Channel, 2017-2022 (US$ Bn)
TABLE 122 France Electrolyte and Vitamin Water Market, by Distribution Channel, 2023-2030 (US$ Bn)
TABLE 123 United Kingdom Electrolyte and Vitamin Water Market, By Fortification, 2017-2022 (US$ Bn)
TABLE 124 United Kingdom Electrolyte and Vitamin Water Market, By Fortification, 2023-2030 (US$ Bn)
TABLE 125 United Kingdom Electrolyte and Vitamin Water Market, By Variants, 2017-2022 (US$ Bn)
TABLE 126 United Kingdom Electrolyte and Vitamin Water Market, By Variants, 2023-2030 (US$ Bn)
TABLE 127 United Kingdom Electrolyte and Vitamin Water Market, By Type, 2017-2022 (US$ Bn)
TABLE 128 United Kingdom Electrolyte and Vitamin Water Market, By Type, 2023-2030 (US$ Bn)
TABLE 129 United Kingdom Electrolyte and Vitamin Water Market, by Packaging, 2017-2022 (US$ Bn)
TABLE 130 United Kingdom Electrolyte and Vitamin Water Market, by Packaging, 2023-2030 (US$ Bn)
TABLE 131 United Kingdom Electrolyte and Vitamin Water Market, by Distribution Channel, 2017-2022 (US$ Bn)
TABLE 132 United Kingdom Electrolyte and Vitamin Water Market, by Distribution Channel, 2023-2030 (US$ Bn)
TABLE 133 Italy Electrolyte and Vitamin Water Market, By Fortification, 2017-2022 (US$ Bn)
TABLE 134 Italy Electrolyte and Vitamin Water Market, By Fortification, 2023-2030 (US$ Bn)
TABLE 135 Italy Electrolyte and Vitamin Water Market, By Variants, 2017-2022 (US$ Bn)
TABLE 136 Italy Electrolyte and Vitamin Water Market, By Variants, 2023-2030 (US$ Bn)
TABLE 137 Italy Electrolyte and Vitamin Water Market, By Type, 2017-2022 (US$ Bn)
TABLE 138 Italy Electrolyte and Vitamin Water Market, By Type, 2023-2030 (US$ Bn)
TABLE 139 Italy Electrolyte and Vitamin Water Market, by Packaging, 2017-2022 (US$ Bn)
TABLE 140 Italy Electrolyte and Vitamin Water Market, by Packaging, 2023-2030 (US$ Bn)
TABLE 141 Italy Electrolyte and Vitamin Water Market, by Distribution Channel, 2017-2022 (US$ Bn)
TABLE 142 Italy Electrolyte and Vitamin Water Market, by Distribution Channel, 2023-2030 (US$ Bn)
TABLE 143 Spain Electrolyte and Vitamin Water Market, By Fortification, 2017-2022 (US$ Bn)
TABLE 144 Spain Electrolyte and Vitamin Water Market, By Fortification, 2023-2030 (US$ Bn)
TABLE 145 Spain Electrolyte and Vitamin Water Market, By Variants, 2017-2022 (US$ Bn)
TABLE 146 Spain Electrolyte and Vitamin Water Market, By Variants, 2023-2030 (US$ Bn)
TABLE 147 Spain Electrolyte and Vitamin Water Market, By Type, 2017-2022 (US$ Bn)
TABLE 148 Spain Electrolyte and Vitamin Water Market, By Type, 2023-2030 (US$ Bn)
TABLE 149 Spain Electrolyte and Vitamin Water Market, by Packaging, 2017-2022 (US$ Bn)
TABLE 150 Spain Electrolyte and Vitamin Water Market, by Packaging, 2023-2030 (US$ Bn)
TABLE 151 Spain Electrolyte and Vitamin Water Market, by Distribution Channel, 2017-2022 (US$ Bn)
TABLE 152 Spain Electrolyte and Vitamin Water Market, by Distribution Channel, 2023-2030 (US$ Bn)
TABLE 153 Rest of Europe Electrolyte and Vitamin Water Market, By Fortification, 2017-2022 (US$ Bn)
TABLE 154 Rest of Europe Electrolyte and Vitamin Water Market, By Fortification, 2023-2030 (US$ Bn)
TABLE 155 Rest of Europe Electrolyte and Vitamin Water Market, By Variants, 2017-2022 (US$ Bn)
TABLE 156 Rest of Europe Electrolyte and Vitamin Water Market, By Variants, 2023-2030 (US$ Bn)
TABLE 157 Rest of Europe Electrolyte and Vitamin Water Market, By Type, 2017-2022 (US$ Bn)
TABLE 158 Rest of Europe Electrolyte and Vitamin Water Market, By Type, 2023-2030 (US$ Bn)
TABLE 159 Rest of Europe Electrolyte and Vitamin Water Market, by Packaging, 2017-2022 (US$ Bn)
TABLE 160 Rest of Europe Electrolyte and Vitamin Water Market, by Packaging, 2023-2030 (US$ Bn)
TABLE 161 Rest of Europe Electrolyte and Vitamin Water Market, by Distribution Channel, 2017-2022 (US$ Bn)
TABLE 162 Rest of Europe Electrolyte and Vitamin Water Market, by Distribution Channel, 2023-2030 (US$ Bn)
TABLE 163 Asia Pacific Electrolyte and Vitamin Water Market, By Fortification, 2017-2022 (US$ Bn)
TABLE 164 Asia Pacific Electrolyte and Vitamin Water Market, By Fortification, 2023-2030 (US$ Bn)
TABLE 165 Asia Pacific Electrolyte and Vitamin Water Market, By Variants, 2017-2022 (US$ Bn)
TABLE 166 Asia Pacific Electrolyte and Vitamin Water Market, By Variants, 2023-2030 (US$ Bn)
TABLE 167 Asia Pacific Electrolyte and Vitamin Water Market, By Type, 2017-2022 (US$ Bn)
TABLE 168 Asia Pacific Electrolyte and Vitamin Water Market, By Type, 2023-2030 (US$ Bn)
TABLE 169 Asia Pacific Electrolyte and Vitamin Water Market, by Packaging, 2017-2022 (US$ Bn)
TABLE 170 Asia Pacific Electrolyte and Vitamin Water Market, by Packaging, 2023-2030 (US$ Bn)
TABLE 171 Asia Pacific Electrolyte and Vitamin Water Market, by Distribution Channel, 2017-2022 (US$ Bn)
TABLE 172 Asia Pacific Electrolyte and Vitamin Water Market, by Distribution Channel, 2023-2030 (US$ Bn)
TABLE 173 China Electrolyte and Vitamin Water Market, By Fortification, 2017-2022 (US$ Bn)
TABLE 174 China Electrolyte and Vitamin Water Market, By Fortification, 2023-2030 (US$ Bn)
TABLE 175 China Electrolyte and Vitamin Water Market, By Variants, 2017-2022 (US$ Bn)
TABLE 176 China Electrolyte and Vitamin Water Market, By Variants, 2023-2030 (US$ Bn)
TABLE 177 China Electrolyte and Vitamin Water Market, By Type, 2017-2022 (US$ Bn)
TABLE 178 China Electrolyte and Vitamin Water Market, By Type, 2023-2030 (US$ Bn)
TABLE 179 China Electrolyte and Vitamin Water Market, by Packaging, 2017-2022 (US$ Bn)
TABLE 180 China Electrolyte and Vitamin Water Market, by Packaging, 2023-2030 (US$ Bn)
TABLE 181 China Electrolyte and Vitamin Water Market, by Distribution Channel, 2017-2022 (US$ Bn)
TABLE 182 China Electrolyte and Vitamin Water Market, by Distribution Channel, 2023-2030 (US$ Bn)
TABLE 183 Japan Electrolyte and Vitamin Water Market, By Fortification, 2017-2022 (US$ Bn)
TABLE 184 Japan Electrolyte and Vitamin Water Market, By Fortification, 2023-2030 (US$ Bn)
TABLE 185 Japan Electrolyte and Vitamin Water Market, By Variants, 2017-2022 (US$ Bn)
TABLE 186 Japan Electrolyte and Vitamin Water Market, By Variants, 2023-2030 (US$ Bn)
TABLE 187 Japan Electrolyte and Vitamin Water Market, By Type, 2017-2022 (US$ Bn)
TABLE 188 Japan Electrolyte and Vitamin Water Market, By Type, 2023-2030 (US$ Bn)
TABLE 189 Japan Electrolyte and Vitamin Water Market, by Packaging, 2017-2022 (US$ Bn)
TABLE 190 Japan Electrolyte and Vitamin Water Market, by Packaging, 2023-2030 (US$ Bn)
TABLE 191 Japan Electrolyte and Vitamin Water Market, by Distribution Channel, 2017-2022 (US$ Bn)
TABLE 192 Japan Electrolyte and Vitamin Water Market, by Distribution Channel, 2023-2030 (US$ Bn)
TABLE 193 India Electrolyte and Vitamin Water Market, By Fortification, 2017-2022 (US$ Bn)
TABLE 194 India Electrolyte and Vitamin Water Market, By Fortification, 2023-2030 (US$ Bn)
TABLE 195 India Electrolyte and Vitamin Water Market, By Variants, 2017-2022 (US$ Bn)
TABLE 196 India Electrolyte and Vitamin Water Market, By Variants, 2023-2030 (US$ Bn)
TABLE 197 India Electrolyte and Vitamin Water Market, By Type, 2017-2022 (US$ Bn)
TABLE 198 India Electrolyte and Vitamin Water Market, By Type, 2023-2030 (US$ Bn)
TABLE 199 India Electrolyte and Vitamin Water Market, by Packaging, 2017-2022 (US$ Bn)
TABLE 200 India Electrolyte and Vitamin Water Market, by Packaging, 2023-2030 (US$ Bn)
TABLE 201 India Electrolyte and Vitamin Water Market, by Distribution Channel, 2017-2022 (US$ Bn)
TABLE 202 India Electrolyte and Vitamin Water Market, by Distribution Channel, 2023-2030 (US$ Bn)
TABLE 203 South Korea Electrolyte and Vitamin Water Market, By Fortification, 2017-2022 (US$ Bn)
TABLE 204 South Korea Electrolyte and Vitamin Water Market, By Fortification, 2023-2030 (US$ Bn)
TABLE 205 South Korea Electrolyte and Vitamin Water Market, By Variants, 2017-2022 (US$ Bn)
TABLE 206 South Korea Electrolyte and Vitamin Water Market, By Variants, 2023-2030 (US$ Bn)
TABLE 207 South Korea Electrolyte and Vitamin Water Market, By Type, 2017-2022 (US$ Bn)
TABLE 208 South Korea Electrolyte and Vitamin Water Market, By Type, 2023-2030 (US$ Bn)
TABLE 209 South Korea Electrolyte and Vitamin Water Market, by Packaging, 2017-2022 (US$ Bn)
TABLE 210 South Korea Electrolyte and Vitamin Water Market, by Packaging, 2023-2030 (US$ Bn)
TABLE 211 South Korea Electrolyte and Vitamin Water Market, by Distribution Channel, 2017-2022 (US$ Bn)
TABLE 212 South Korea Electrolyte and Vitamin Water Market, by Distribution Channel, 2023-2030 (US$ Bn)
TABLE 213 South-East Asia Electrolyte and Vitamin Water Market, By Fortification, 2017-2022 (US$ Bn)
TABLE 214 South-East Asia Electrolyte and Vitamin Water Market, By Fortification, 2023-2030 (US$ Bn)
TABLE 215 South-East Asia Electrolyte and Vitamin Water Market, By Variants, 2017-2022 (US$ Bn)
TABLE 216 South-East Asia Electrolyte and Vitamin Water Market, By Variants, 2023-2030 (US$ Bn)
TABLE 217 South-East Asia Electrolyte and Vitamin Water Market, By Type, 2017-2022 (US$ Bn)
TABLE 218 South-East Asia Electrolyte and Vitamin Water Market, By Type, 2023-2030 (US$ Bn)
TABLE 219 South-East Asia Electrolyte and Vitamin Water Market, by Packaging, 2017-2022 (US$ Bn)
TABLE 220 South-East Asia Electrolyte and Vitamin Water Market, by Packaging, 2023-2030 (US$ Bn)
TABLE 221 South-East Asia Electrolyte and Vitamin Water Market, by Distribution Channel, 2017-2022 (US$ Bn)
TABLE 222 South-East Asia Electrolyte and Vitamin Water Market, by Distribution Channel, 2023-2030 (US$ Bn)
TABLE 223 Rest of Asia Pacific Electrolyte and Vitamin Water Market, By Fortification, 2017-2022 (US$ Bn)
TABLE 224 Rest of Asia Pacific Electrolyte and Vitamin Water Market, By Fortification, 2023-2030 (US$ Bn)
TABLE 225 Rest of Asia Pacific Electrolyte and Vitamin Water Market, By Variants, 2017-2022 (US$ Bn)
TABLE 226 Rest of Asia Pacific Electrolyte and Vitamin Water Market, By Variants, 2023-2030 (US$ Bn)
TABLE 227 Rest of Asia Pacific Electrolyte and Vitamin Water Market, By Type, 2017-2022 (US$ Bn)
TABLE 228 Rest of Asia Pacific Electrolyte and Vitamin Water Market, By Type, 2023-2030 (US$ Bn)
TABLE 229 Rest of Asia Pacific Electrolyte and Vitamin Water Market, by Packaging, 2017-2022 (US$ Bn)
TABLE 230 Rest of Asia Pacific Electrolyte and Vitamin Water Market, by Packaging, 2023-2030 (US$ Bn)
TABLE 231 Rest of Asia Pacific Electrolyte and Vitamin Water Market, by Distribution Channel, 2017-2022 (US$ Bn)
TABLE 232 Rest of Asia Pacific Electrolyte and Vitamin Water Market, by Distribution Channel, 2023-2030 (US$ Bn)
TABLE 233 Latin America Electrolyte and Vitamin Water Market, By Fortification, 2017-2022 (US$ Bn)
TABLE 234 Latin America Electrolyte and Vitamin Water Market, By Fortification, 2023-2030 (US$ Bn)
TABLE 235 Latin America Electrolyte and Vitamin Water Market, By Variants, 2017-2022 (US$ Bn)
TABLE 236 Latin America Electrolyte and Vitamin Water Market, By Variants, 2023-2030 (US$ Bn)
TABLE 237 Latin America Electrolyte and Vitamin Water Market, By Type, 2017-2022 (US$ Bn)
TABLE 238 Latin America Electrolyte and Vitamin Water Market, By Type, 2023-2030 (US$ Bn)
TABLE 239 Latin America Electrolyte and Vitamin Water Market, by Packaging, 2017-2022 (US$ Bn)
TABLE 240 Latin America Electrolyte and Vitamin Water Market, by Packaging, 2023-2030 (US$ Bn)
TABLE 241 Latin America Electrolyte and Vitamin Water Market, by Distribution Channel, 2017-2022 (US$ Bn)
TABLE 242 Latin America Electrolyte and Vitamin Water Market, by Distribution Channel, 2023-2030 (US$ Bn)
TABLE 243 Brazil Electrolyte and Vitamin Water Market, By Fortification, 2017-2022 (US$ Bn)
TABLE 244 Brazil Electrolyte and Vitamin Water Market, By Fortification, 2023-2030 (US$ Bn)
TABLE 245 Brazil Electrolyte and Vitamin Water Market, By Variants, 2017-2022 (US$ Bn)
TABLE 246 Brazil Electrolyte and Vitamin Water Market, By Variants, 2023-2030 (US$ Bn)
TABLE 247 Brazil Electrolyte and Vitamin Water Market, By Type, 2017-2022 (US$ Bn)
TABLE 248 Brazil Electrolyte and Vitamin Water Market, By Type, 2023-2030 (US$ Bn)
TABLE 249 Brazil Electrolyte and Vitamin Water Market, by Packaging, 2017-2022 (US$ Bn)
TABLE 250 Brazil Electrolyte and Vitamin Water Market, by Packaging, 2023-2030 (US$ Bn)
TABLE 251 Brazil Electrolyte and Vitamin Water Market, by Distribution Channel, 2017-2022 (US$ Bn)
TABLE 252 Brazil Electrolyte and Vitamin Water Market, by Distribution Channel, 2023-2030 (US$ Bn)
TABLE 253 Argentina Electrolyte and Vitamin Water Market, By Fortification, 2017-2022 (US$ Bn)
TABLE 254 Argentina Electrolyte and Vitamin Water Market, By Fortification, 2023-2030 (US$ Bn)
TABLE 255 Argentina Electrolyte and Vitamin Water Market, By Variants, 2017-2022 (US$ Bn)
TABLE 256 Argentina Electrolyte and Vitamin Water Market, By Variants, 2023-2030 (US$ Bn)
TABLE 257 Argentina Electrolyte and Vitamin Water Market, By Type, 2017-2022 (US$ Bn)
TABLE 258 Argentina Electrolyte and Vitamin Water Market, By Type, 2023-2030 (US$ Bn)
TABLE 259 Argentina Electrolyte and Vitamin Water Market, by Packaging, 2017-2022 (US$ Bn)
TABLE 260 Argentina Electrolyte and Vitamin Water Market, by Packaging, 2023-2030 (US$ Bn)
TABLE 261 Argentina Electrolyte and Vitamin Water Market, by Distribution Channel, 2017-2022 (US$ Bn)
TABLE 262 Argentina Electrolyte and Vitamin Water Market, by Distribution Channel, 2023-2030 (US$ Bn)
TABLE 263 Rest of Latin America Electrolyte and Vitamin Water Market, By Fortification, 2017-2022 (US$ Bn)
TABLE 264 Rest of Latin America Electrolyte and Vitamin Water Market, By Fortification, 2023-2030 (US$ Bn)
TABLE 265 Rest of Latin America Electrolyte and Vitamin Water Market, By Variants, 2017-2022 (US$ Bn)
TABLE 266 Rest of Latin America Electrolyte and Vitamin Water Market, By Variants, 2023-2030 (US$ Bn)
TABLE 267 Rest of Latin America Electrolyte and Vitamin Water Market, By Type, 2017-2022 (US$ Bn)
TABLE 268 Rest of Latin America Electrolyte and Vitamin Water Market, By Type, 2023-2030 (US$ Bn)
TABLE 269 Rest of Latin America Electrolyte and Vitamin Water Market, by Packaging, 2017-2022 (US$ Bn)
TABLE 270 Rest of Latin America Electrolyte and Vitamin Water Market, by Packaging, 2023-2030 (US$ Bn)
TABLE 271 Rest of Latin America Electrolyte and Vitamin Water Market, by Distribution Channel, 2017-2022 (US$ Bn)
TABLE 272 Rest of Latin America Electrolyte and Vitamin Water Market, by Distribution Channel, 2023-2030 (US$ Bn)
TABLE 273 Middle East and Africa Electrolyte and Vitamin Water Market, By Fortification, 2017-2022 (US$ Bn)
TABLE 274 Middle East and Africa Electrolyte and Vitamin Water Market, By Fortification, 2023-2030 (US$ Bn)
TABLE 275 Middle East and Africa Electrolyte and Vitamin Water Market, By Variants, 2017-2022 (US$ Bn)
TABLE 276 Middle East and Africa Electrolyte and Vitamin Water Market, By Variants, 2023-2030 (US$ Bn)
TABLE 277 Middle East and Africa Electrolyte and Vitamin Water Market, By Type, 2017-2022 (US$ Bn)
TABLE 278 Middle East and Africa Electrolyte and Vitamin Water Market, By Type, 2023-2030 (US$ Bn)
TABLE 279 Middle East and Africa Electrolyte and Vitamin Water Market, by Packaging, 2017-2022 (US$ Bn)
TABLE 280 Middle East and Africa Electrolyte and Vitamin Water Market, by Packaging, 2023-2030 (US$ Bn)
TABLE 281 Middle East and Africa Electrolyte and Vitamin Water Market, by Distribution Channel, 2017-2022 (US$ Bn)
TABLE 282 Middle East and Africa Electrolyte and Vitamin Water Market, by Distribution Channel, 2023-2030 (US$ Bn)
TABLE 283 GCC Countries Electrolyte and Vitamin Water Market, By Fortification, 2017-2022 (US$ Bn)
TABLE 284 GCC Countries Electrolyte and Vitamin Water Market, By Fortification, 2023-2030 (US$ Bn)
TABLE 285 GCC Countries Electrolyte and Vitamin Water Market, By Variants, 2017-2022 (US$ Bn)
TABLE 286 GCC Countries Electrolyte and Vitamin Water Market, By Variants, 2023-2030 (US$ Bn)
TABLE 287 GCC Countries Electrolyte and Vitamin Water Market, By Type, 2017-2022 (US$ Bn)
TABLE 288 GCC Countries Electrolyte and Vitamin Water Market, By Type, 2023-2030 (US$ Bn)
TABLE 289 GCC Countries Electrolyte and Vitamin Water Market, by Packaging, 2017-2022 (US$ Bn)
TABLE 290 GCC Countries Electrolyte and Vitamin Water Market, by Packaging, 2023-2030 (US$ Bn)
TABLE 291 GCC Countries Electrolyte and Vitamin Water Market, by Distribution Channel, 2017-2022 (US$ Bn)
TABLE 292 GCC Countries Electrolyte and Vitamin Water Market, by Distribution Channel, 2023-2030 (US$ Bn)
TABLE 293 South Africa Electrolyte and Vitamin Water Market, By Fortification, 2017-2022 (US$ Bn)
TABLE 294 South Africa Electrolyte and Vitamin Water Market, By Fortification, 2023-2030 (US$ Bn)
TABLE 295 South Africa Electrolyte and Vitamin Water Market, By Variants, 2017-2022 (US$ Bn)
TABLE 296 South Africa Electrolyte and Vitamin Water Market, By Variants, 2023-2030 (US$ Bn)
TABLE 297 South Africa Electrolyte and Vitamin Water Market, By Type, 2017-2022 (US$ Bn)
TABLE 298 South Africa Electrolyte and Vitamin Water Market, By Type, 2023-2030 (US$ Bn)
TABLE 299 South Africa Electrolyte and Vitamin Water Market, by Packaging, 2017-2022 (US$ Bn)
TABLE 300 South Africa Electrolyte and Vitamin Water Market, by Packaging, 2023-2030 (US$ Bn)
TABLE 301 South Africa Electrolyte and Vitamin Water Market, by Distribution Channel, 2017-2022 (US$ Bn)
TABLE 302 South Africa Electrolyte and Vitamin Water Market, by Distribution Channel, 2023-2030 (US$ Bn)
TABLE 303 Rest of Middle East and Africa Electrolyte and Vitamin Water Market, By Fortification, 2017-2022 (US$ Bn)
TABLE 304 Rest of Middle East and Africa Electrolyte and Vitamin Water Market, By Fortification, 2023-2030 (US$ Bn)
TABLE 305 Rest of Middle East and Africa Electrolyte and Vitamin Water Market, By Variants, 2017-2022 (US$ Bn)
TABLE 306 Rest of Middle East and Africa Electrolyte and Vitamin Water Market, By Variants, 2023-2030 (US$ Bn)
TABLE 307 Rest of Middle East and Africa Electrolyte and Vitamin Water Market, By Type, 2017-2022 (US$ Bn)
TABLE 308 Rest of Middle East and Africa Electrolyte and Vitamin Water Market, By Type, 2023-2030 (US$ Bn)
TABLE 309 Rest of Middle East and Africa Electrolyte and Vitamin Water Market, by Packaging, 2017-2022 (US$ Bn)
TABLE 310 Rest of Middle East and Africa Electrolyte and Vitamin Water Market, by Packaging, 2023-2030 (US$ Bn)
TABLE 311 Rest of Middle East and Africa Electrolyte and Vitamin Water Market, by Distribution Channel, 2017-2022 (US$ Bn)
TABLE 312 Rest of Middle East and Africa Electrolyte and Vitamin Water Market, by Distribution Channel, 2023-2030 (US$ Bn)

Frequently Asked Questions

How big is the global Electrolyte and Vitamin Water market right now?

In 2022, the global electrolyte and vitamin water market was estimated to be worth USD 7.3 billion.

What is the predicted growth rate of the Electrolyte and Vitamin Water market between 2023 and 2030?

The market for electrolyte and vitamin water is estimated to increase at an 8.00% CAGR between 2023 and 2030, reaching USD 12.51 billion in 2030.

Which segment is leading the market in terms of fortification?

Vitamin only is the leading segment by fortification.

Which segment is leading the market in terms of variants?

Flavored is the leading segment by variants.

Which segment is predicted to have the highest CAGR during the forecast period?

During the forecast period, the Supermarkets segment is expected to achieve the highest CAGR.

Which region is driving the electrolyte and vitamin water industry’s expansion?

Asia Pacific is driving the growth of the Electrolyte and Vitamin Water industry.

Who are the top participants in the global market for electrolytes and vitamin water?

The top players include PepsiCo Inc., Talking Rain Beverage Company, Alkaline Water Company Inc., and The Coca-Cola Company. Other major players include Danone S.A., Essentia Water LLC (Nestlé USA), and Frucor Suntory (Suntory Holdings Limited).

What are the primary market factors driving the Electrolyte and Vitamin Water industry?

Rising demand for highly nutritious beverages and increased participation in sports, physical fitness, and adventure activities are the primary factors driving the market’s growth.

What are the most significant market restrictions in the Electrolyte and Vitamin Water industry?

The factors restraining the market growth are a lack of scientific proof and competition from alternative beverages.

What are the most significant market opportunities in the Electrolyte and Vitamin Water industry?

Rising health and wellness trends and product innovation and diversification are the market’s significant opportunities.

Matcha Tea Market

Published:
Report ID: 37133

Natural Flavors Market

Published:
Report ID: 14378

Oat Milk Market

Published:
Report ID: 37052

Processed Meat Market

Published:
Report ID: 11443

Dill Juice Market

Published:
Report ID: 5087

Edible Oils Market

Published:
Report ID: 4775

Dehydrated Food Market

Published:
Report ID: 4904

Argan Oil Market

Published:
Report ID: 1674

India Pet Food Market

Published:
Report ID: 36785

Amla Extracts Market

Published:
Report ID: 12475

Fermented Beverages Market

Published:
Report ID: 6227

Dairy Ingredients Market

Published:
Report ID: 4463

Purchase Options

$2999
Delivery Format: Excel.
$4999
Designed for the individual purchaser.
$6999
Users located at a single corporate site or regional office.
$7999
Allowed for unlimited sharing globally within one company.
Smallform of Sample request

Have a question?

User Profile

Don’t settle for less – trust Mitul to help you find the best solution.

Report delivery within 24 to 48 hours

– Other Info –

What people say?-

User Review

I am very impressed with the information in this report. The author clearly did their research when they came up with this product and it has already given me a lot of ideas.

Jana Schmidt
CEDAR CX Technologies

– Connect with us –

Phone

+91 6232 49 3207


support

24/7 Research Support


sales@credenceresearch.com

– Research Methodology –

Going beyond the basics: advanced techniques in research methodology

– Trusted By –

Pepshi, LG, Nestle
Motorola, Honeywell, Johnson and johnson
LG Chem, SIEMENS, Pfizer
Unilever, Samsonite, QIAGEN