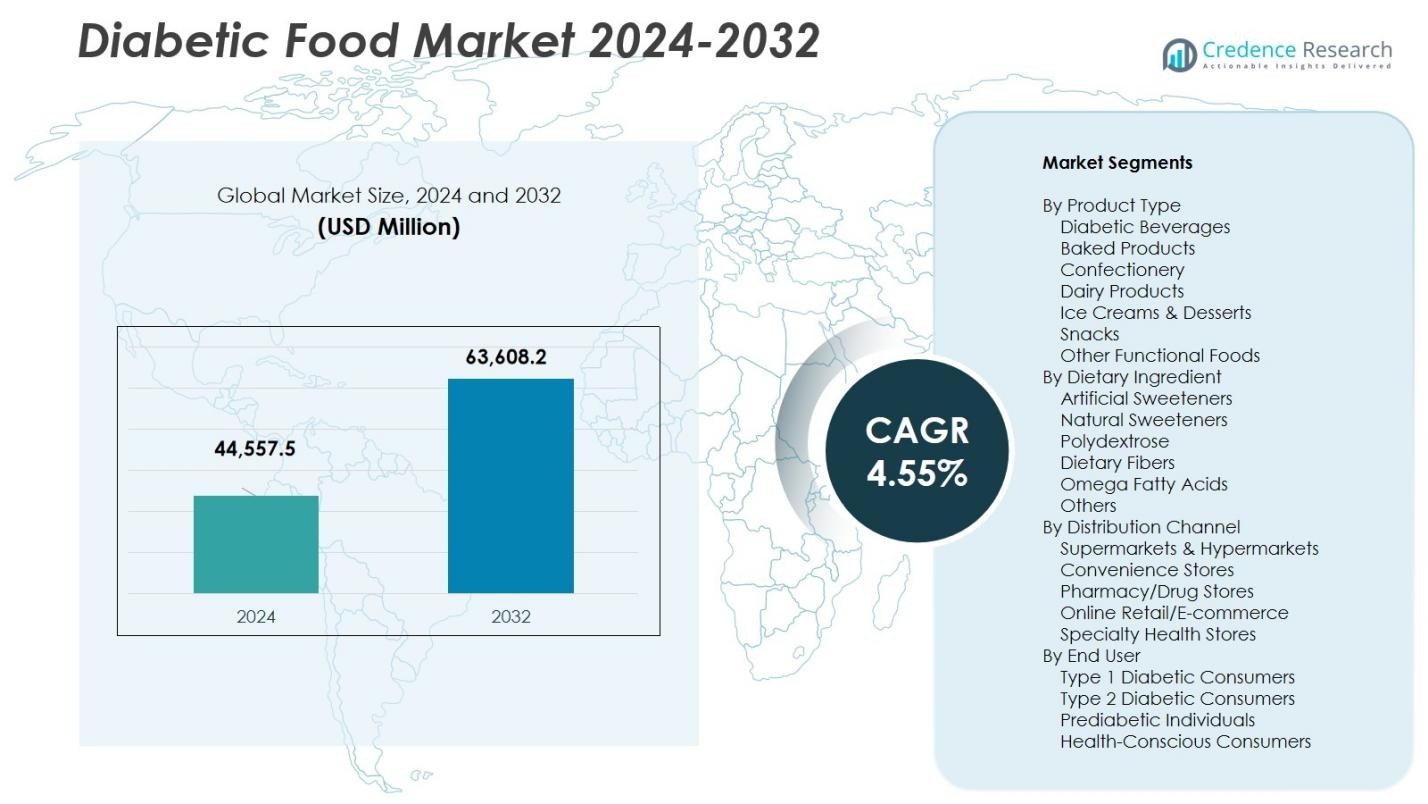
Home » Food & Beverage » Diabetic Food Market

Diabetic Food Market By Price (Range, Low, Medium, High)-Growth, Future Prospects & Competitive Analysis, 2016 – 2030

Price: $4999

Published: | Report ID: 4367 | Report Format : PDF

Market Insights

  • When it comes to growth, the diabetic food market is consistent.
  • A primary motive for that is the growing prevalence of diabetes globally.
  • As per our research, the variety of people affected by diabetes is predicted to reach seven hundred million by 2045.
  • This increasing diabetic population formulates a major demand for specialized food products to serve their dietary needs.
  • Due to this figure, manufacturers spend money on research and development to innovate diabetic-friendly food options.

Diabetic Food Market

Executive Summary

Market Definition

The diabetic food market, as in keeping with our comprehensive research, has witnessed a sizable growth within the previous few years. This growth results from many elements, such as the growing diabetic population, government initiatives, product innovation, and rising disposable incomes.

With that stated, there are certain obstacles that the marketplace faces as well. These complications consist of high costs, taste and texture limitations, and the availability of natural options.

While those restraints exist, in keeping with our research, many different opportunities also are available in untapped markets, online retailing, growing demand for sugar substitutes, and collaborations/partnerships.

This report offers an evaluation that is complete and in-depth about the marketplace. It includes marketplace drivers, restraints, possibilities, aggressive panorama, key findings, and future outlook.

Design Element 2

Access crucial information at unmatched prices!

Request your free sample report today & start making informed decisions powered by Credence Research!

Download Free Sample
CTA Design Element 3

Market Overview

The worldwide diabetic food market is segmented based on product kind, distribution channel, and geography. Product types include baked products, confectionery, dairy products, nutritional liquids, ice cream, and jellies.

Per our comprehensive research, the dairy product segment holds a large marketplace proportion of over 25%. Diabetic consumers select dairy products like sugar-free yogurts and milk substitutes because of their dietary value and taste.

Regarding distribution channels, supermarkets, and hypermarkets dominate the marketplace with a percentage of over 60%. These retail channels provide an extensive range of diabetic food products, providing comfort and accessibility to purchasers. Online retailing is likewise gaining traction, permitting consumers to purchase diabetic food products comfortably from the comfort of their homes.

Geographically, Europe holds the second biggest marketplace proportion inside the worldwide diabetic food market. The region’s high awareness regarding diabetes control and the presence of key market players make contributions to its massive market role. North America leads the marketplace, on the whole, driven using the US, which has a large diabetic population.

Key Highlights of the Report

The global diabetic food market is extraordinarily competitive, with several key players operating at both regional and worldwide levels. These players focus on product innovation, expanding distribution networks, and strategic collaborations to gain a competitive edge.

Market leaders spend money on research and development to introduce new diabetic food products, improve taste and texture, and cater to changing customer preferences. Key players within the market encompass Nestlé S.A., Unilever Plc, The Hershey Company, Kellogg Company, and Mars, Incorporated, among others.

Diabetic Food Market

What Are the Main Drivers of the Diabetic Food Market?

Increasing diabetic population, government initiatives, product innovation, and rise in disposable incomes.

What Are The Major Challenges Faced By the Diabetic Food Market?

High cost, taste and texture limitations, and availability of natural alternatives.

What Are The Growth Opportunities In the Diabetic Food Market?

Untapped markets, online retailing, rising demand for sugar substitutes, and collaborations and partnerships.

Increasing Diabetic Population

The rising prevalence of diabetes globally is a first-rate driving force for the diabetic food market. As the number of people with diabetes grows, the demand for diabetic-friendly food products is expected to grow substantially.

Government Initiatives

Governments across various countries impose tasks to combat diabetes and promote healthy lifestyles. These projects include consciousness campaigns, academic packages, and regulations to inspire growing and eating diabetic food products.

Product Innovation

Manufacturers are investing in research and development to introduce progressive diabetic food products. These products focus on retaining taste, texture, and dietary value while being low in sugar, fat, and calories. Product innovation is important in attracting diabetic purchasers and increasing the marketplace.

Rise in Disposable Income

Increasing disposable income permits consumers to prioritize their fitness and well-being, leading to better demand for healthier food alternatives, including diabetic foods. Consumers are inclined to spend more on premium diabetic food products that align with their dietary necessities.

High Cost

Diabetic food products often comes at a premium price because of specialized ingredients and production processes. The high cost of those products poses a vast restraint, limiting the affordability for a few purchasers.

Taste and Texture Limitations

Developing diabetic food products that meet consumers’ taste and texture expectations can be hard. The elimination or reduction of sugar and fats can affect the overall taste and texture, making it difficult to replicate the sensory enjoyment of conventional food products.

Availability of Natural Alternatives

Some purchasers choose natural options for diabetic products, like whole foods with low glycemic index values. This choice of natural alternatives restricts the market as customers may be apt for non-processed alternatives. They are still skeptical about specialized diabetic food products.

Untapped Markets

There are several untapped markets globally, specifically in developing regions, with an excessive occurrence of diabetes. Manufacturers can make their reach bigger by concentrating on those markets and introducing diabetic food products tailor-made to nearby choices and nutritional conduct.

Online Retailing

The increase in e-commerce presents a great opportunity for diabetic food producers. Online platforms allow customers to access a wide range of diabetic food products, compare prices, and make convenient purchases. Manufacturers can leverage online retailing to attain a broader client base and increase sales.

Rising Demand for Sugar Substitutes

As consumers become more health conscious, the demand for sugar substitutes in diabetic food products increases. Manufacturers can capitalize on this trend by incorporating natural or synthetic sweeteners that flavor like sugar without impacting blood glucose degrees.

Collaborations and Partnerships

Collaborations between diabetic food producers and healthcare corporations or diabetic institutions can create opportunities for mutual growth. Such partnerships can increase recognition, training, and distribution of diabetic food products through healthcare channels.

Key Players

The diabetic food market is highly competitive, with several key players. Some of the major players in the market and their market share are as follows:

  • Nestlé SA
  • Unilever PLC
  • Mars, Inc.
  • Kellogg Company
  • PepsiCo, Inc.

Shape Your Report to Specific Countries or Regions & Enjoy 30% Off!

Summary of Key Findings

  • Our exhaustive research on the global diabetic food market revealed that the enterprise will likely reach USD 18,476.39 million by 2030. It is currently growing at a CAGR of 5.78% between 2023 and 2030.
  • The dairy product segment holds over 25% of the marketplace share, indicating the importance of dairy-primarily based diabetic food products.
  • Supermarkets and hypermarkets lead the marketplace with a proportion of over 60%, highlighting the dominance of these retail channels.
  • Europe is the second-leading marketplace for diabetic food, reflecting the location’s growing awareness and demand for wholesome food options.

Segmentation

  • By Price Range
    • Low
    • Medium
    • High
  • By Region
    • North America
      • Canada
      • Mexico
    • Europe
      • Germany
      • France
      • U.K.
      • Italy
      • Spain
      • Rest of Europe
    • Asia Pacific
      • China
      • Japan
      • India
      • South Korea
      • South-east Asia
      • Rest of Asia Pacific
    • Latin America
      • Brazil
      • Argentina
      • Rest of Latin America
    • Middle East & Africa
      • GCC Countries
      • South Africa
      • Rest of the Middle East and Africa

CHAPTER NO. 1 : INTRODUCTION 15
1.1. Report Description 15
1.1.1. Purpose of the Report 15
1.1.2. USP & Key Offerings 15
1.2. Key Benefits for Stakeholders 15
1.3. Target Audience 16
1.4. Report Scope 16

CHAPTER NO. 2 : EXECUTIVE SUMMARY 19
2.1. Diabetic Food Market Snapshot 19
2.2. Global Diabetic Food Market, 2017 – 2030 (Kilo Tons) (USD Million) 21
2.1. Insights from Primary Respondents 21

CHAPTER NO. 3 : COVID 19 IMPACT ANALYSIS 22
3.1. Impact Assessment of COVID-19 Pandemic, By Region 22

CHAPTER NO. 4 : DIABETIC FOOD MARKET – INDUSTRY ANALYSIS 23
4.1. Introduction 23
4.2. Market Drivers 24
4.2.1. Increasing Diabetic Population 24
4.2.2. Rise in Disposable Income 25
4.3. Market Restraints 25
4.3.1. Restraining Factor Analysis 25
4.4. Market Opportunities 26
4.4.1. Market Opportunity Analysis 26
4.5. Porter’s Five Forces Analysis 26
4.6. Value Chain Analysis 27

CHAPTER NO. 5 : KEY INVESTMENT POCKETS ANALYSIS 28
5.1. Top Investment Pockets 28
5.1.1.1. Diabetic Food Market Attractiveness Analysis, By Type 28
5.1.1.2. Diabetic Food Market Attractiveness Analysis, By Distribution Channel 28
5.2. Product Life Cycle Analysis 29
5.3. Incremental Revenue Growth Opportunity, 2023 – 2030 30
5.3.1. Type 30
5.3.2. Distribution Channel 30

CHAPTER NO. 6 : IMPORT EXPORT ANALYSIS 31
6.1. Import Analysis by Region 31
6.1.1. Global Diabetic Food Market Import Volume, By Region, 2017 – 2022 (Kilo Tons) 31
6.2. Export Analysis by Region 31
6.2.1. Global Diabetic Food Market Export Volume, By Region, 2017 – 2022 (Kilo Tons) 31

CHAPTER NO. 7 : DEMAND SUPPLY ANALYSIS 32
7.1. Demand Analysis by Region 32
7.1.1. Global Diabetic Food Market Demand Volume, By Region, 2017 – 2022 (Kilo Tons) 32
7.2. Supply Analysis by Region 32
7.2.1. Global Diabetic Food Market Supply Volume, By Region, 2017 – 2022 (Kilo Tons) 32

CHAPTER NO. 8 : MARKET POSITIONING OF KEY PLAYERS 33
8.1. Company Market Share Analysis –2020 and 2022 33
8.1.1. Global Diabetic Food Market: Company Market Share, 2022 33
8.1.2. Global Diabetic Food Market: Company Market Share, 2022 33
8.1. Global Diabetic Food Market Company Volume Market Share, 2022 34
8.2. Global Diabetic Food Market Company Revenue Market Share, 2022 35
8.3. Market Position of Key Players 2022 36
8.3.1. Market Position of Key Players, 2022 36
8.4. Strategic Developments 37
8.4.1. Acquisitions & Mergers 37
8.4.2. New Product Launch 37
8.4.3. Regional Expansion 37

CHAPTER NO. 9 : DIABETIC FOOD MARKET – BY TYPE SEGMENT ANALYSIS 38
9.1. Diabetic Food Market Overview, by Type Segment 38
9.1.1. Global Diabetic Food Market Volume Share, By Type, 2022 & 2030 39
9.1.2. Global Diabetic Food Market Revenue Share, By Type, 2022 & 2030 39
9.2. Diabetic beverages 40
9.2.1. Global Diabetic beverages Diabetic Food Market Volume, By Region, 2017 – 2022 (Kilo Tons) 40
9.2.2. Global Diabetic beverages Diabetic Food Market Revenue, By Region, 2017 – 2022 (USD Million) 41
9.3. Baked products 42
9.3.1. Global Baked products Diabetic Food Market Volume, By Region, 2017 – 2022 (Kilo Tons) 42
9.3.2. Global Diabetic beverages Diabetic Food Market Revenue, By Region, 2017 – 2022 (USD Million) 43
9.4. Dairy products 44
9.4.1. Global Dairy products Diabetic Food Market Volume, By Region, 2017 – 2022 (Kilo Tons) 44
9.4.2. Global Dairy products Diabetic Food Market Revenue, By Region, 2017 – 2022 (USD Million) 45
9.5. Snacks 46
9.5.1. Global Snacks Diabetic Food Market Volume, By Region, 2017 – 2022 (Kilo Tons) 46
9.5.2. Global Snacks Diabetic Food Market Revenue, By Region, 2017 – 2022 (USD Million) 47
9.6. Others (Confectionery, Spreads, etc.) 48
9.6.1. Global Others (Confectionery, Spreads, etc.) Diabetic Food Market Volume, By Region, 2017 – 2022 (Kilo Tons) 48
9.6.2. Global Others (Confectionery, Spreads, etc.) Diabetic Food Market Revenue, By Region, 2017 – 2022 (USD Million) 49

CHAPTER NO. 10 : DIABETIC FOOD MARKET – BY DISTRIBUTION CHANNEL SEGMENT ANALYSIS 50
10.1. Diabetic Food Market Overview, by Distribution Channel Segment 50
10.1.1. Global Diabetic Food Market Volume Share, By Distribution Channel, 2022 & 2030 51
10.1.2. Global Diabetic Food Market Revenue Share, By Distribution Channel, 2022 & 2030 51
10.2. Hypermarkets/supermarkets 52
10.2.1. Global Diabetic Food for Hypermarkets/supermarkets Market Volume, By Region, 2017 – 2022 (Kilo Tons) 52
10.2.2. Global Diabetic Food for Hypermarkets/supermarkets Market Revenue, By Region, 2017 – 2022 (USD Million) 53
10.3. Specialty stores 54
10.3.1. Global Diabetic Food for Specialty stores Market Volume, By Region, 2017 – 2022 (Kilo Tons) 54
10.3.2. Global Diabetic Food for Specialty stores Market Revenue, By Region, 2017 – 2022 (USD Million) 55
10.4. Online retail 56
10.4.1. Global Diabetic Food for Online retail Market Volume, By Region, 2017 – 2022 (Kilo Tons) 56
10.4.2. Global Diabetic Food for Online retail Market Revenue, By Region, 2017 – 2022 (USD Million) 57
10.5. Others 58
10.5.1. Global Diabetic Food for Others Market Volume, By Region, 2017 – 2022 (Kilo Tons) 58
10.5.2. Global Diabetic Food for Others Market Revenue, By Region, 2017 – 2022 (USD Million) 59

CHAPTER NO. 11 : DIABETIC FOOD MARKET – REGIONAL ANALYSIS 62
11.1. Diabetic Food Market Overview, by Region Segment 62
11.1.1. Global Diabetic Food Market Volume Share, By Region, 2022 & 2030 63
11.1.2. Global Diabetic Food Market Revenue Share, By Region, 2022 & 2030 63
11.1.3. Global Diabetic Food Market Volume, By Region, 2017 – 2022 (Kilo Tons) 64
11.1.4. Global Diabetic Food Market Revenue, By Region, 2017 – 2022 (USD Million) 65
11.1.5. Global Diabetic Food Market Volume, By Type, 2017 – 2022 (Kilo Tons) 66
11.1.6. Global Diabetic Food Market Revenue, By Type, 2017 – 2022 (USD Million) 67
11.1.7. Global Diabetic Food Market Volume, By Distribution Channel, 2017 – 2022 (Kilo Tons) 68
11.1.8. Global Diabetic Food Market Revenue, By Distribution Channel, 2017 – 2022 (USD Million) 69
11.2. North America 70
11.2.1. North America Diabetic Food Market Volume, By Country, 2017 – 2022 (Kilo Tons) 71
11.2.2. North America Diabetic Food Market Revenue, By Country, 2017 – 2022 (USD Million) 71
11.2.2.1. North America Diabetic Food Market Volume, By Type, 2017 – 2022 (Kilo Tons) 72
11.2.3. North America Diabetic Food Market Revenue, By Type, 2017 – 2022 (USD Million) 73
11.2.4. North America Diabetic Food Market Volume, By Distribution Channel, 2017 – 2022 (Kilo Tons) 74
11.2.5. North America Diabetic Food Market Revenue, By Distribution Channel, 2017 – 2022 (USD Million) 75
11.2.6. U.S. 76
11.2.7. Canada 76
11.2.8. Mexico 76
11.3. Europe 77
11.3.1. Europe Diabetic Food Market Volume, By Country, 2017 – 2022 (Kilo Tons) 78
11.3.2. Europe Diabetic Food Market Revenue, By Country, 2017 – 2022 (USD Million) 79
11.3.3. Europe Diabetic Food Market Volume, By Type, 2017 – 2022 (Kilo Tons) 80
11.3.4. Europe Diabetic Food Market Revenue, By Type, 2017 – 2022 (USD Million) 81
11.3.5. Europe Diabetic Food Market Volume, By Distribution Channel, 2017 – 2022 (Kilo Tons) 82
11.3.6. Europe Diabetic Food Market Revenue, By Distribution Channel, 2017 – 2022 (USD Million) 83
11.3.7. UK 84
11.3.8. France 84
11.3.9. Germany 84
11.3.10. Italy 84
11.3.11. Spain 84
11.3.12. Russia 84
11.3.13. BENELUX 84
11.3.14. Sweden 84
11.3.15. Denmark 84
11.3.16. Poland 84
11.3.17. Austria 84
11.3.18. Rest of Europe 84
11.4. Asia Pacific 85
11.4.1. Asia Pacific Diabetic Food Market Volume, By Country, 2017 – 2022 (Kilo Tons) 86
11.4.2. Asia Pacific Diabetic Food Market Revenue, By Country, 2017 – 2022 (USD Million) 87
11.4.3. Asia Pacific Diabetic Food Market Volume, By Type, 2017 – 2022 (Kilo Tons) 88
11.4.4. Asia Pacific Diabetic Food Market Revenue, By Type, 2017 – 2022 (USD Million) 89
11.4.5. Asia Pacific Diabetic Food Market Volume, By Distribution Channel, 2017 – 2022 (Kilo Tons) 90
11.4.6. Asia Pacific Diabetic Food Market Revenue, By Distribution Channel, 2017 – 2022 (USD Million) 91
11.4.7. China 92
11.4.8. Japan 92
11.4.9. South Korea 92
11.4.10. India 92
11.4.11. Thailand 92
11.4.12. Indonesia 92
11.4.13. Vietnam 92
11.4.14. Malaysia 92
11.4.15. Philippines 92
11.4.16. Taiwan 92
11.4.17. Rest of Asia Pacific 92
11.5. Latin America 93
11.5.1. Latin America Diabetic Food Market Volume, By Country, 2017 – 2022 (Kilo Tons) 94
11.5.2. Latin America Diabetic Food Market Revenue, By Country, 2017 – 2022 (USD Million) 95
11.5.3. Latin America Diabetic Food Market Volume, By Type, 2017 – 2022 (Kilo Tons) 96
11.5.4. Latin America Diabetic Food Market Revenue, By Type, 2017 – 2022 (USD Million) 97
11.5.5. Latin America Diabetic Food Market Volume, By Distribution Channel, 2017 – 2022 (Kilo Tons) 98
11.5.6. Latin America Diabetic Food Market Revenue, By Distribution Channel, 2017 – 2022 (USD Million) 99
11.5.7. Brazil 100
11.5.8. Argentina 100
11.5.9. Colombia 100
11.5.10. Chile 100
11.5.11. Peru 100
11.5.12. Rest of Latin America 100
11.6. The Middle-East 101
11.6.1. Middle East Diabetic Food Market Volume, By Country, 2017 – 2022 (Kilo Tons) 102
11.6.2. Middle East Diabetic Food Market Revenue, By Country, 2017 – 2022 (USD Million) 103
11.6.3. Middle East Diabetic Food Market Volume, By Type, 2017 – 2022 (Kilo Tons) 104
11.6.4. Middle East Diabetic Food Market Revenue, By Type, 2017 – 2022 (USD Million) 105
11.6.5. Middle East Diabetic Food Market Volume, By Distribution Channel, 2017 – 2022 (Kilo Tons) 106
11.6.6. Middle East Diabetic Food Market Revenue, By Distribution Channel, 2017 – 2022 (USD Million) 107
11.6.7. GCC Countries 108
11.6.8. Israel 108
11.6.9. Turkey 108
11.6.10. Iran 108
11.6.11. Rest of Middle East & Africa 108
11.7. Africa 109
11.7.1. Africa Diabetic Food Market Volume, By Country, 2017 – 2022 (Kilo Tons) 110
11.7.2. Africa Diabetic Food Market Revenue, By Country, 2017 – 2022 (USD Million) 111
11.7.3. Africa Diabetic Food Market Volume, By Type, 2017 – 2022 (Kilo Tons) 112
11.7.4. Africa Diabetic Food Market Revenue, By Type, 2017 – 2022 (USD Million) 113
11.7.5. Africa Diabetic Food Market Volume, By Distribution Channel, 2017 – 2022 (Kilo Tons) 114
11.7.6. Africa Diabetic Food Market Revenue, By Distribution Channel, 2017 – 2022 (USD Million) 115
11.7.7. South Africa 116
11.7.8. Egypt 116
11.7.9. Nigeria 116
11.7.10. Algeria 116
11.7.11. Morocco 116
11.7.12. Rest of Africa 116

CHAPTER NO. 12 : COMPANY PROFILES 117
12.1. Nestlé S.A. 117
12.1.1. Company Overview 117
12.1.2. Product Portfolio 117
12.1.3. Financial Overview 117
12.2. Unilever Group 118
12.3. The Coca-Cola Company 118
12.4. PepsiCo, Inc. 118
12.5. Mars, Incorporated 118
12.6. Kellogg Company 118
12.7. Cadbury Schweppes Plc (Mondelez International) 118
12.8. The Hershey Company 118
12.9. Abbott Laboratories 118
12.10. Amara Raja Foods Pvt. Ltd. 118
12.11. Fifty 50 Foods Corporation 118
12.12. J&J Snack Foods Corp. 118
12.13. Zen Health Japan Co., Ltd. 118
12.14. PepsiCo Foods Canada Inc. 118

CHAPTER NO. 13 : RESEARCH METHODOLOGY 119
13.1. Research Methodology 119
13.2. Phase I – Secondary Research 120
13.3. Phase II – Data Modeling 120
13.3.1. Company Share Analysis Model 121
13.3.2. Revenue Based Modeling 121
13.4. Phase III – Primary Research 122
13.5. Research Limitations 123
13.5.1. Assumptions 123

List of Figures
FIG NO. 1. Global Diabetic Food Market Volume & Revenue, 2017 – 2030 (Kilo Tons) (USD Million) 22
FIG NO. 2. Porter’s Five Forces Analysis for Global Diabetic Food Market 27
FIG NO. 3. Value Chain Analysis for Global Diabetic Food Market 28
FIG NO. 4. Market Attractiveness Analysis, By Type 29
FIG NO. 5. Market Attractiveness Analysis, By Distribution Channel 29
FIG NO. 6. Product Life Cycle Analysis 30
FIG NO. 7. Incremental Revenue Growth Opportunity by Type 31
FIG NO. 8. Incremental Revenue Growth Opportunity by Distribution Channel 31
FIG NO. 9. Company Share Analysis, 2020 34
FIG NO. 10. Company Share Analysis, 2022 34
FIG NO. 11. Diabetic Food Market – Company Volume Market Share, 2022 35
FIG NO. 12. Diabetic Food Market – Company Revenue Market Share, 2022 36
FIG NO. 13. Market Position of Key Players, 2022 37
FIG NO. 14. Global Diabetic Food Market Volume Share, By Type, 2022 & 2030 40
FIG NO. 15. Global Diabetic Food Market Revenue Share, By Type, 2022 & 2030 40
FIG NO. 16. Global Diabetic Food Market for Diabetic beverages, Volume & Revenue (Kilo Tons) (USD Million) 2017 – 2030 41
FIG NO. 17. Global Diabetic Food Market for Baked products, Volume & Revenue (Kilo Tons) (USD Million) 2017 – 2030 43
FIG NO. 18. Global Diabetic Food Market for Dairy products, Volume & Revenue (Kilo Tons) (USD Million) 2017 – 2030 45
FIG NO. 19. Global Diabetic Food Market for Snacks, Volume & Revenue (Kilo Tons) (USD Million) 2017 – 2030 47
FIG NO. 20. Global Diabetic Food Market for Others (Confectionery, Spreads, etc.), Volume & Revenue (Kilo Tons) (USD Million) 2017 – 2030 49
FIG NO. 21. Global Diabetic Food Market Volume Share, By Distribution Channel, 2022 & 2030 52
FIG NO. 22. Global Diabetic Food Market Revenue Share, By Distribution Channel, 2022 & 2030 52
FIG NO. 23. Global Diabetic Food Market for Hypermarkets/supermarkets, Volume & Revenue (Kilo Tons) (USD Million) 2017 – 2030 53
FIG NO. 24. Global Diabetic Food Market for Specialty stores, Volume & Revenue (Kilo Tons) (USD Million) 2017 – 2030 55
FIG NO. 25. Global Diabetic Food Market for Online retail, Volume & Revenue (Kilo Tons) (USD Million) 2017 – 2030 57
FIG NO. 26. Global Diabetic Food Market for Others, Volume & Revenue (Kilo Tons) (USD Million) 2017 – 2030 59
FIG NO. 27. Global Diabetic Food Market for Distribution Channel 5, Volume & Revenue (Kilo Tons) (USD Million) 2017 – 2030 61
FIG NO. 28. Global Diabetic Food Market Volume Share, By Region, 2022 & 2030 64
FIG NO. 29. Global Diabetic Food Market Revenue Share, By Region, 2022 & 2030 64
FIG NO. 30. North America Diabetic Food Market Volume & Revenue, 2017 – 2022 (Kilo Tons) (USD Million) 71
FIG NO. 31. Europe Diabetic Food Market Volume & Revenue, 2017 – 2022 (Kilo Tons) (USD Million) 78
FIG NO. 32. Asia Pacific Diabetic Food Market Volume & Revenue, 2017 – 2022 (Kilo Tons) (USD Million) 86
FIG NO. 33. Latin America Diabetic Food Market Volume & Revenue, 2017 – 2022 (Kilo Tons) (USD Million) 94
FIG NO. 34. The Middle-East Diabetic Food Market Volume & Revenue, 2017 – 2022 (Kilo Tons) (USD Million) 102
FIG NO. 35. Africa Diabetic Food Market Volume & Revenue, 2017 – 2022 (Kilo Tons) (USD Million) 110
FIG NO. 36. Research Methodology – Detailed View 120
FIG NO. 37. Research Methodology 121

List of Tables
TABLE NO. 1. : Global Diabetic Food Market: Snapshot 20
TABLE NO. 2. : Drivers for the Diabetic Food Market: Impact Analysis 25
TABLE NO. 3. : Restraints for the Diabetic Food Market: Impact Analysis 26
TABLE NO. 4. : Global Diabetic Food Market Import Volume, By End-user, 2017 – 2022 (Kilo Tons) 32
TABLE NO. 5. : Global Diabetic Food Market Export Volume, By End-user, 2017 – 2022 (Kilo Tons) 32
TABLE NO. 6. : Global Diabetic Food Market Demand Volume, By End-user, 2017 – 2022 (Kilo Tons) 33
TABLE NO. 7. : Global Diabetic Food Market Supply Volume, By End-user, 2017 – 2022 (Kilo Tons) 33
TABLE NO. 8. : Global Diabetic beverages Diabetic Food Market Volume, By Region, 2017 – 2022 (Kilo Tons) 41
TABLE NO. 9. : Global Diabetic beverages Diabetic Food Market Volume, By Region, 2023– 2030 (Kilo Tons) 41
TABLE NO. 10. : Global Diabetic beverages Diabetic Food Market Revenue, By Region, 2017 – 2022 (USD Million) 42
TABLE NO. 11. : Global Diabetic beverages Diabetic Food Market Revenue, By Region, 2023– 2030 (USD Million) 42
TABLE NO. 12. : Global Baked products Diabetic Food Market Volume, By Region, 2017 – 2022 (Kilo Tons) 43
TABLE NO. 13. : Global Baked products Diabetic Food Market Volume, By Region, 2023– 2030 (Kilo Tons) 43
TABLE NO. 14. : Global Diabetic beverages Diabetic Food Market Revenue, By Region, 2017 – 2022 (USD Million) 44
TABLE NO. 15. : Global Diabetic beverages Diabetic Food Market Revenue, By Region, 2023– 2030 (USD Million) 44
TABLE NO. 16. : Global Dairy products Diabetic Food Market Volume, By Region, 2017 – 2022 (Kilo Tons) 45
TABLE NO. 17. : Global Dairy products Diabetic Food Market Volume, By Region, 2023– 2030 (Kilo Tons) 45
TABLE NO. 18. : Global Dairy products Diabetic Food Market Revenue, By Region, 2017 – 2022 (USD Million) 46
TABLE NO. 19. : Global Dairy products Diabetic Food Market Revenue, By Region, 2023– 2030 (USD Million) 46
TABLE NO. 20. : Global Snacks Diabetic Food Market Revenue, By Region, 2017 – 2022 (USD Million) 47
TABLE NO. 21. : Global Snacks Diabetic Food Market Volume, By Region, 2023– 2030 (Kilo Tons) 47
TABLE NO. 22. : Global Snacks Diabetic Food Market Revenue, By Region, 2017 – 2022 (USD Million) 48
TABLE NO. 23. : Global Snacks Diabetic Food Market Revenue, By Region, 2023– 2030 (USD Million) 48
TABLE NO. 24. : Global Others (Confectionery, Spreads, etc.) Diabetic Food Market Volume, By Region, 2017 – 2022 (Kilo Tons) 49
TABLE NO. 25. : Global Others (Confectionery, Spreads, etc.) Diabetic Food Market Volume, By Region, 2023– 2030 (Kilo Tons) 49
TABLE NO. 26. : Global Others (Confectionery, Spreads, etc.) Diabetic Food Market Revenue, By Region, 2017 – 2022 (USD Million) 50
TABLE NO. 27. : Global Others (Confectionery, Spreads, etc.) Diabetic Food Market Revenue, By Region, 2023– 2030 (USD Million) 50
TABLE NO. 28. : Global Diabetic Food for Hypermarkets/supermarkets Market Volume, By Region, 2017 – 2022 (Kilo Tons) 53
TABLE NO. 29. : Global Diabetic Food for Hypermarkets/supermarkets Market Volume, By Region, 2023– 2030 (Kilo Tons) 53
TABLE NO. 30. : Global Diabetic Food for Hypermarkets/supermarkets Market Revenue, By Region, 2017 – 2022 (USD Million) 54
TABLE NO. 31. : Global Diabetic Food for Hypermarkets/supermarkets Market Revenue, By Region, 2023– 2030 (USD Million) 54
TABLE NO. 32. : Global Diabetic Food for Specialty stores Market Volume, By Region, 2017 – 2022 (Kilo Tons) 55
TABLE NO. 33. : Global Diabetic Food for Specialty stores Market Volume, By Region, 2023– 2030 (Kilo Tons) 55
TABLE NO. 34. : Global Diabetic Food for Specialty stores Market Revenue, By Region, 2017 – 2022 (USD Million) 56
TABLE NO. 35. : Global Diabetic Food for Specialty stores Market Revenue, By Region, 2023– 2030 (USD Million) 56
TABLE NO. 36. : Global Diabetic Food for Online retail Market Volume, By Region, 2017 – 2022 (Kilo Tons) 57
TABLE NO. 37. : Global Diabetic Food for Online retail Market Volume, By Region, 2023– 2030 (Kilo Tons) 57
TABLE NO. 38. : Global Diabetic Food for Online retail Market Revenue, By Region, 2017 – 2022 (USD Million) 58
TABLE NO. 39. : Global Diabetic Food for Online retail Market Revenue, By Region, 2023– 2030 (USD Million) 58
TABLE NO. 40. : Global Diabetic Food for Others Market Volume, By Region, 2017 – 2022 (Kilo Tons) 59
TABLE NO. 41. : Global Diabetic Food for Others Market Volume, By Region, 2023– 2030 (Kilo Tons) 59
TABLE NO. 42. : Global Diabetic Food for Others Market Revenue, By Region, 2017 – 2022 (USD Million) 60
TABLE NO. 43. : Global Diabetic Food for Others Market Revenue, By Region, 2023– 2030 (USD Million) 60
TABLE NO. 44. : Global Diabetic Food for Distribution Channel 5 Market Volume, By Region, 2017 – 2022 (Kilo Tons) 61
TABLE NO. 45. : Global Diabetic Food for Distribution Channel 5 Market Volume, By Region, 2023– 2030 (Kilo Tons) 61
TABLE NO. 46. : Global Diabetic Food for Distribution Channel 5 Market Revenue, By Region, 2017 – 2022 (USD Million) 62
TABLE NO. 47. : Global Diabetic Food for Distribution Channel 5 Market Revenue, By Region, 2023– 2030 (USD Million) 62
TABLE NO. 48. : Global Diabetic Food Market Volume, By Region, 2017 – 2022 (Kilo Tons) 65
TABLE NO. 49. : Global Diabetic Food Market Volume, By Region, 2023– 2030 (Kilo Tons) 65
TABLE NO. 50. : Global Diabetic Food Market Revenue, By Region, 2017 – 2022 (USD Million) 66
TABLE NO. 51. : Global Diabetic Food Market Revenue, By Region, 2023– 2030 (USD Million) 66
TABLE NO. 52. : Global Diabetic Food Market Volume, By Type, 2017 – 2022 (Kilo Tons) 67
TABLE NO. 53. : Global Diabetic Food Market Volume, By Type, 2023– 2030 (Kilo Tons) 67
TABLE NO. 54. : Global Diabetic Food Market Revenue, By Type, 2017 – 2022 (USD Million) 68
TABLE NO. 55. : Global Diabetic Food Market Revenue, By Type, 2023– 2030 (USD Million) 68
TABLE NO. 56. : Global Diabetic Food Market Volume, By Distribution Channel, 2017 – 2022 (Kilo Tons) 69
TABLE NO. 57. : Global Diabetic Food Market Volume, By Distribution Channel, 2023– 2030 (Kilo Tons) 69
TABLE NO. 58. : Global Diabetic Food Market Revenue, By Distribution Channel, 2017 – 2022 (USD Million) 70
TABLE NO. 59. : Global Diabetic Food Market Revenue, By Distribution Channel, 2023– 2030 (USD Million) 70
TABLE NO. 60. : North America Diabetic Food Market Volume, By Country, 2017 – 2022 (Kilo Tons) 72
TABLE NO. 61. : North America Diabetic Food Market Volume, By Country, 2023– 2030 (Kilo Tons) 72
TABLE NO. 62. : North America Diabetic Food Market Revenue, By Country, 2017 – 2022 (USD Million) 72
TABLE NO. 63. : North America Diabetic Food Market Revenue, By Country, 2023– 2030 (USD Million) 72
TABLE NO. 64. : North America Diabetic Food Market Volume, By Type, 2017 – 2022 (Kilo Tons) 73
TABLE NO. 65. : North America Diabetic Food Market Volume, By Type, 2023– 2030 (Kilo Tons) 73
TABLE NO. 66. : North America Diabetic Food Market Revenue, By Type, 2017 – 2022 (USD Million) 74
TABLE NO. 67. : North America Diabetic Food Market Revenue, By Type, 2023– 2030 (USD Million) 74
TABLE NO. 68. : North America Diabetic Food Market Volume, By Distribution Channel, 2017 – 2022 (Kilo Tons) 75
TABLE NO. 69. : North America Diabetic Food Market Volume, By Distribution Channel, 2023– 2030 (Kilo Tons) 75
TABLE NO. 70. : North America Diabetic Food Market Revenue, By Distribution Channel, 2017 – 2022 (USD Million) 76
TABLE NO. 71. : North America Diabetic Food Market Revenue, By Distribution Channel, 2023– 2030 (USD Million) 76
TABLE NO. 72. : Europe Diabetic Food Market Volume, By Country, 2017 – 2022 (Kilo Tons) 79
TABLE NO. 73. : Europe Diabetic Food Market Volume, By Country, 2023– 2030 (Kilo Tons) 79
TABLE NO. 74. : Europe Diabetic Food Market Revenue, By Country, 2017 – 2022 (USD Million) 80
TABLE NO. 75. : Europe Diabetic Food Market Revenue, By Country, 2023– 2030 (USD Million) 80
TABLE NO. 76. : Europe Diabetic Food Market Volume, By Type, 2017 – 2022 (Kilo Tons) 81
TABLE NO. 77. : Europe Diabetic Food Market Volume, By Type, 2023– 2030 (Kilo Tons) 81
TABLE NO. 78. : Europe Diabetic Food Market Revenue, By Type, 2017 – 2022 (USD Million) 82
TABLE NO. 79. : Europe Diabetic Food Market Revenue, By Type, 2023– 2030 (USD Million) 82
TABLE NO. 80. : Europe Diabetic Food Market Volume, By Distribution Channel, 2017 – 2022 (Kilo Tons) 83
TABLE NO. 81. : Europe Diabetic Food Market Volume, By Distribution Channel, 2023– 2030 (Kilo Tons) 83
TABLE NO. 82. : Europe Diabetic Food Market Revenue, By Distribution Channel, 2017 – 2022 (USD Million) 84
TABLE NO. 83. : Europe Diabetic Food Market Revenue, By Distribution Channel, 2023– 2030 (USD Million) 84
TABLE NO. 84. : Asia Pacific Diabetic Food Market Volume, By Country, 2017 – 2022 (Kilo Tons) 87
TABLE NO. 85. : Asia Pacific Diabetic Food Market Volume, By Country, 2023– 2030 (Kilo Tons) 87
TABLE NO. 86. : Asia Pacific Diabetic Food Market Revenue, By Country, 2017 – 2022 (USD Million) 88
TABLE NO. 87. : Asia Pacific Diabetic Food Market Revenue, By Country, 2023– 2030 (USD Million) 88
TABLE NO. 88. : Asia Pacific Diabetic Food Market Volume, By Type, 2017 – 2022 (Kilo Tons) 89
TABLE NO. 89. : Asia Pacific Diabetic Food Market Volume, By Type, 2023– 2030 (Kilo Tons) 89
TABLE NO. 90. : Asia Pacific Diabetic Food Market Revenue, By Type, 2017 – 2022 (USD Million) 90
TABLE NO. 91. : Asia Pacific Diabetic Food Market Revenue, By Type, 2023– 2030 (USD Million) 90
TABLE NO. 92. : Asia Pacific Diabetic Food Market Volume, By Distribution Channel, 2017 – 2022 (Kilo Tons) 91
TABLE NO. 93. : Asia Pacific Diabetic Food Market Volume, By Distribution Channel, 2023– 2030 (Kilo Tons) 91
TABLE NO. 94. : Asia Pacific Diabetic Food Market Revenue, By Distribution Channel, 2017 – 2022 (USD Million) 92
TABLE NO. 95. : Asia Pacific Diabetic Food Market Revenue, By Distribution Channel, 2023– 2030 (USD Million) 92
TABLE NO. 96. : Latin America Diabetic Food Market Volume, By Country, 2017 – 2022 (Kilo Tons) 95
TABLE NO. 97. : Latin America Diabetic Food Market Volume, By Country, 2023– 2030 (Kilo Tons) 95
TABLE NO. 98. : Latin America Diabetic Food Market Revenue, By Country, 2017 – 2022 (USD Million) 96
TABLE NO. 99. : Latin America Diabetic Food Market Revenue, By Country, 2023– 2030 (USD Million) 96
TABLE NO. 100. : Latin America Diabetic Food Market Volume, By Type, 2017 – 2022 (Kilo Tons) 97
TABLE NO. 101. : Latin America Diabetic Food Market Volume, By Type, 2023– 2030 (Kilo Tons) 97
TABLE NO. 102. : Latin America Diabetic Food Market Revenue, By Type, 2017 – 2022 (USD Million) 98
TABLE NO. 103. : Latin America Diabetic Food Market Revenue, By Type, 2023– 2030 (USD Million) 98
TABLE NO. 104. : Latin America Diabetic Food Market Volume, By Distribution Channel, 2017 – 2022 (Kilo Tons) 99
TABLE NO. 105. : Latin America Diabetic Food Market Volume, By Distribution Channel, 2023– 2030 (Kilo Tons) 99
TABLE NO. 106. : Latin America Diabetic Food Market Revenue, By Distribution Channel, 2017 – 2022 (USD Million) 100
TABLE NO. 107. : Latin America Diabetic Food Market Revenue, By Distribution Channel, 2023– 2030 (USD Million) 100
TABLE NO. 108. : Middle East Diabetic Food Market Volume, By Country, 2017 – 2022 (Kilo Tons) 103
TABLE NO. 109. : Middle East Diabetic Food Market Volume, By Country, 2023– 2030 (Kilo Tons) 103
TABLE NO. 110. : Middle East Diabetic Food Market Revenue, By Country, 2017 – 2022 (USD Million) 104
TABLE NO. 111. : Middle East Diabetic Food Market Revenue, By Country, 2023– 2030 (USD Million) 104
TABLE NO. 112. : Middle East Diabetic Food Market Volume, By Type, 2017 – 2022 (Kilo Tons) 105
TABLE NO. 113. : Middle East Diabetic Food Market Volume, By Type, 2023– 2030 (Kilo Tons) 105
TABLE NO. 114. : Middle East Diabetic Food Market Revenue, By Type, 2017 – 2022 (USD Million) 106
TABLE NO. 115. : Middle East Diabetic Food Market Revenue, By Type, 2023– 2030 (USD Million) 106
TABLE NO. 116. : Middle East Diabetic Food Market Volume, By Distribution Channel, 2017 – 2022 (Kilo Tons) 107
TABLE NO. 117. : Middle East Diabetic Food Market Volume, By Distribution Channel, 2023– 2030 (Kilo Tons) 107
TABLE NO. 118. : Middle East Diabetic Food Market Revenue, By Distribution Channel, 2017 – 2022 (USD Million) 108
TABLE NO. 119. : Middle East Diabetic Food Market Revenue, By Distribution Channel, 2023– 2030 (USD Million) 108
TABLE NO. 120. : Africa Diabetic Food Market Volume, By Country, 2017 – 2022 (Kilo Tons) 111
TABLE NO. 121. : Africa Diabetic Food Market Volume, By Country, 2023– 2030 (Kilo Tons) 111
TABLE NO. 122. : Africa Diabetic Food Market Revenue, By Country, 2017 – 2022 (USD Million) 112
TABLE NO. 123. : Africa Diabetic Food Market Revenue, By Country, 2023– 2030 (USD Million) 112
TABLE NO. 124. : Africa Diabetic Food Market Volume, By Type, 2017 – 2022 (Kilo Tons) 113
TABLE NO. 125. : Africa Diabetic Food Market Volume, By Type, 2023– 2030 (Kilo Tons) 113
TABLE NO. 126. : Africa Diabetic Food Market Revenue, By Type, 2017 – 2022 (USD Million) 114
TABLE NO. 127. : Africa Diabetic Food Market Revenue, By Type, 2023– 2030 (USD Million) 114
TABLE NO. 128. : Africa Diabetic Food Market Volume, By Distribution Channel, 2017 – 2022 (Kilo Tons) 115
TABLE NO. 129. : Africa Diabetic Food Market Volume, By Distribution Channel, 2023– 2030 (Kilo Tons) 115
TABLE NO. 130. : Africa Diabetic Food Market Revenue, By Distribution Channel, 2017 – 2022 (USD Million) 116
TABLE NO. 131. : Africa Diabetic Food Market Revenue, By Distribution Channel, 2023– 2030 (USD Million) 116

Frequently Asked Question

What is the diabetic food market?

The diabetic food market refers to the food industry segment that caters to individuals with diabetes. It consists of foods and liquids designed to fulfill the dietary needs of humans with diabetes, specializing in handling blood sugar degrees and supplying balanced vitamins.

Why is the diabetic food market growing?

The marketplace for diabetic food is experiencing growth because of the increasing prevalence of diabetes worldwide. Rising consciousness about the importance of handling diabetes via weight loss plan, coupled with a developing diabetic populace, has created a demand for specialized food products that cater to their specific dietary necessities.

What types of products are available in the diabetic food market?

The diabetic food market offers a huge variety of products, such as sugar-loose or reduced-sugar products, low-carbohydrate foods, diabetic-friendly snacks, diabetic drinks, artificial sweeteners, and specialized food designed to provide balanced vitamins even as dealing with blood sugar levels.

Are diabetic foods only for human beings with diabetes?

While diabetic foods are ordinarily designed for people with diabetes, they can also be fed to people without diabetes who need to manage their weight or reduce their sugar intake. However, it is important to consult a healthcare expert or nutritionist before making extensive dietary adjustments.

Are diabetic foods safe to eat?

Diabetic foods that comply with food safety regulations are typically safe to consume. However, it’s critical to read labels, recognize components, and consider an individual’s nutritional necessities or allergic reactions. Some diabetic foods may include carbohydrates, fat, or energy, so moderation and element control are key.

Are diabetic foods more expensive than ordinary foods?

Diabetic foods can sometimes be more expensive than regular foods because of the specialized ingredients and production methods involved. However, the price distinction varies depending on the brand and product type. It is always helpful to compare prices and the general nutritional plan and budget before buying.

Can diabetic ingredients replace the medication for diabetes management?

Diabetic foods are not meant to replace medication for diabetes control. They are part of a complete method comprising medication, physical activity, and healthy lifestyle choices. It is vital to observe the recommendation of healthcare experts and take prescribed medication as directed.

Can diabetic foods help prevent diabetes?

While a healthy diet is vital for diabetes prevention, eating diabetic foods alone cannot guarantee the prevention of diabetes. Maintaining a balanced food regimen, engaging in everyday physical activity, and maintaining a healthy weight are essential to decrease the risk of developing type 2 diabetes.

Are all diabetic food products labelled as such?

Not all products designed for people with diabetes are explicitly labelled as “diabetic food.” Some products may additionally have specific claims approximately low sugar, reduced carbohydrates, or being appropriate for diabetics. It is essential to read product labels carefully, test dietary information, and visit a healthcare expert if unsure.

Where can diabetic food products be purchased?

Diabetic food products can be discovered in various places, including specialized health food shops, supermarkets, and online shops. Some pharmacies or healthcare facilities may additionally deliver a choice of diabetic ingredients. Additionally, many manufacturers provide direct purchase alternatives through their websites.

Food Encapsulation Market

Published:
Report ID: 5663

Gluten-Free Bakery Products Market

Published:
Report ID: 36306

Low Calorie Food Market

Published:
Report ID: 12195

Food Preservatives Market

Published:
Report ID: 5660

Dairy Blends Market

Published:
Report ID: 4452

Sodium Benzoate Market

Published:
Report ID: 10462

Ready to Use Therapeutic Food Market

Published:
Report ID: 8866

Sunflower Oil Market

Published:
Report ID: 10108

Specialty Milk Formula Market

Published:
Report ID: 9566

UK Clean Label Starch Market

Published:
Report ID: 35481

Germany Clean Label Starch Market

Published:
Report ID: 35468

U.S. Clean Label Starch Market

Published:
Report ID: 35460

Purchase Options

$2999
Delivery Format: Excel.
$4999
Designed for the individual purchaser.
$6999
Users located at a single corporate site or regional office.
$7999
Allowed for unlimited sharing globally within one company.
Smallform of Sample request

Have a question?

User Profile

Don’t settle for less – trust Mitul to help you find the best solution.

Report delivery within 24 to 48 hours

– Other Info –

What people say?-

User Review

I am very impressed with the information in this report. The author clearly did their research when they came up with this product and it has already given me a lot of ideas.

Jana Schmidt
CEDAR CX Technologies

– Connect with us –

Phone

+91 6232 49 3207


support

24/7 Research Support


sales@credenceresearch.com

– Research Methodology –

Going beyond the basics: advanced techniques in research methodology

– Trusted By –

Pepshi, LG, Nestle
Motorola, Honeywell, Johnson and johnson
LG Chem, SIEMENS, Pfizer
Unilever, Samsonite, QIAGEN