Market Overview
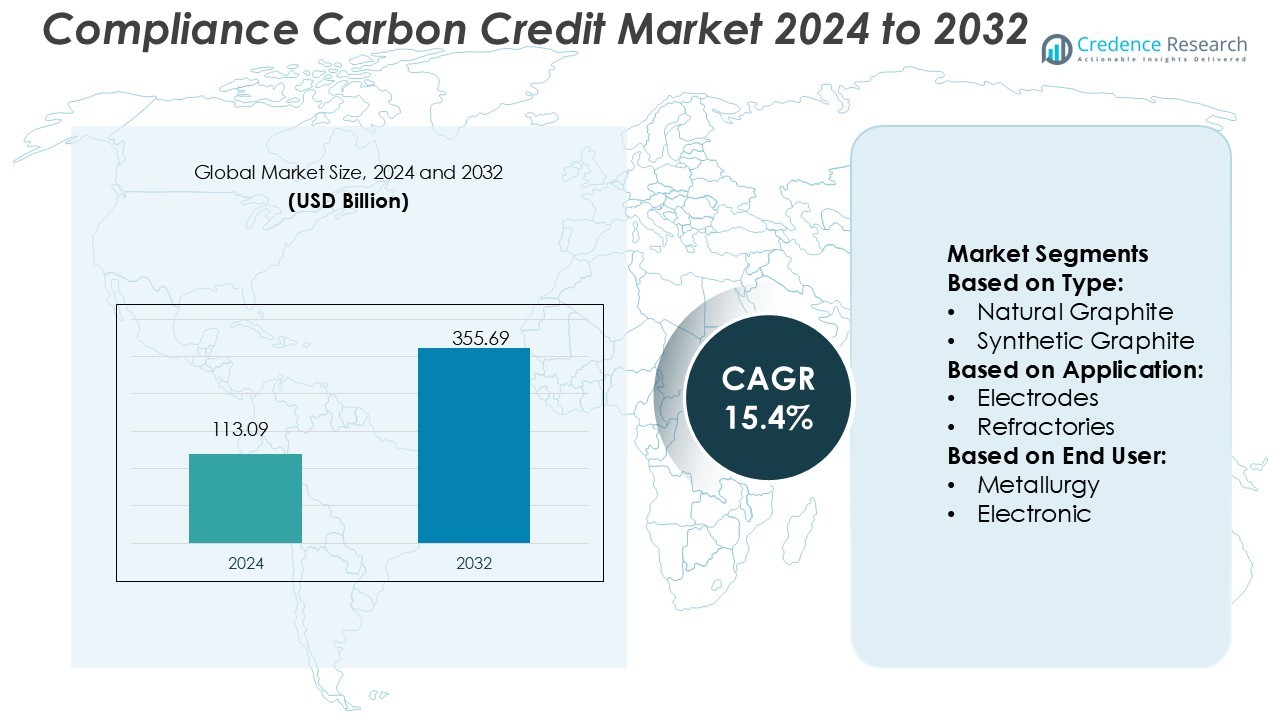
Compliance Carbon Credit Market size was valued USD 113.09 billion in 2024 and is anticipated to reach USD 355.69 billion by 2032, at a CAGR of 15.4% during the forecast period.
| REPORT ATTRIBUTE |
DETAILS |
| Historical Period |
2020-2023 |
| Base Year |
2024 |
| Forecast Period |
2025-2032 |
| Compliance Carbon Credit Market Size 2024 |
USD 113.09 Billion |
| Compliance Carbon Credit Market, CAGR |
15.4% |
| Compliance Carbon Credit Market Size 2032 |
USD 355.69 Billion |
The Compliance Carbon Credit Market is characterized by strong competition among major participants such as GrafTech International Ltd., Mersen S.A., Mason Graphite Inc., Syrah Resources Ltd., Showa Denko K.K., Northern Graphite Corporation, Imerys Graphite & Carbon, Asbury Carbons, Triton Minerals Ltd., and SGL Carbon SE. These companies focus on sustainable operations, emission reduction technologies, and verified credit generation to enhance market presence. Europe leads the global market with a 39% share in 2024, supported by the European Union Emissions Trading System (EU ETS), which promotes transparent carbon pricing and regulatory compliance. Strong policy frameworks and industrial decarbonization initiatives make Europe the primary hub for compliance carbon trading and innovation.
Access crucial information at unmatched prices!
Request your sample report today & start making informed decisions powered by Credence Research Inc.!
Download Sample
Market Insights
- The Compliance Carbon Credit Market was valued at USD 113.09 billion in 2024 and is projected to reach USD 355.69 billion by 2032, growing at a CAGR of 15.4%.
- Market growth is driven by expanding emission trading systems, stricter carbon regulations, and rising corporate commitments toward achieving net-zero targets.
- Key trends include increasing adoption of blockchain for credit verification, digital MRV systems, and cross-border trading platforms enhancing transparency and market efficiency.
- The market faces restraints such as price volatility, lack of global standardization, and limited availability of verified carbon credits in emerging economies.
- Europe dominates with a 39% share in 2024 due to the EU ETS framework, followed by North America with strong regulatory participation, while the metallurgy segment leads the market with a 48% share driven by industrial decarbonization and sustainable manufacturing practices.
Market Segmentation Analysis:
By Type
The Compliance Carbon Credit Market is segmented into natural graphite and synthetic graphite. Synthetic graphite holds the dominant share of 63% in 2024, driven by its superior purity, structural uniformity, and consistent performance in high-energy applications. It is increasingly used in carbon credit-linked projects due to its controlled production and recyclability. Demand is fueled by growing emphasis on sustainable energy storage and carbon offset programs in industrial sectors, where companies seek reliable, low-carbon solutions aligned with environmental compliance goals.
- For instance, GrafTech International Ltd. operates with a graphite electrode production capacity of approximately 178,000 metric tons as of December 31, 2024. The company is substantially vertically integrated into petroleum needle coke production through its Seadrift facility, providing a competitive advantage.
By Application
The market is categorized into electrodes, refractories, casting and foundries, batteries, lubricants, and other applications. The electrodes segment leads with a 41% share in 2024, driven by strong adoption in steelmaking and electric arc furnaces. Rising industrial decarbonization efforts and clean manufacturing regulations are supporting this dominance. The integration of renewable energy in production processes and increasing demand for high-efficiency electrodes in carbon-neutral operations further strengthen segment growth across developed economies.
- For instance, Mersen’s Columbia (USA) plant delivers 4,000 metric tons of extruded graphite and 2,000 metric tons of isostatic graphite annually for electrode production.
By End-User
The Compliance Carbon Credit Market is divided into metallurgy, electronic, automotive, and other end-user industries. The metallurgy sector dominates with a 48% share in 2024, supported by emission reduction initiatives and sustainable steel manufacturing. Industries are leveraging carbon credit trading to offset process-related emissions. Increased focus on circular production and low-carbon alloys drives demand for graphite-based solutions. Government incentives for cleaner industrial operations and broader participation in global carbon markets continue to accelerate segment expansion.
Key Growth Drivers
Rising Corporate Commitment to Carbon Neutrality
Global corporations are committing to net-zero emission targets, driving strong demand for compliance carbon credits. Governments are enforcing emission trading systems (ETS) that require companies to offset carbon output through certified credits. Firms in energy, manufacturing, and transportation are increasingly adopting carbon offset portfolios to meet regulatory obligations and enhance ESG performance. This growing corporate accountability, coupled with transparent verification frameworks, fuels the expansion of the compliance carbon credit market across major economies.
- For instance, Syrah operates the Balama Graphite Operation with a reserve of 110 million tonnes at 16 % Total Graphitic Carbon (TGC), and a wider resource base of 1,036 million tonnes at 12 % TGC.
Expansion of Cap-and-Trade Programs
The continuous expansion of cap-and-trade schemes in North America, Europe, and Asia-Pacific is a key driver. These programs impose emission limits and allow trading of surplus credits, encouraging cost-effective carbon reduction strategies. Regional initiatives such as the EU Emissions Trading System (EU ETS) and China’s National ETS significantly boost market participation. The inclusion of new industries like shipping, aviation, and heavy manufacturing widens the compliance base, fostering greater liquidity and price stability within the carbon credit ecosystem.
- For instance, Resonac Holdings Corporation (formerly Showa Denko) announced in 2025 that it would reduce its global graphite electrode manufacturing capacity to 210,000 metric tons per year, down from a historical high of 250,000 metric tons.
Technological Advancements in Carbon Monitoring and Reporting
Innovations in carbon accounting technologies, including blockchain and AI-based emission tracking, enhance market transparency and verification accuracy. These tools streamline credit issuance and prevent double counting, strengthening investor and regulatory confidence. Automated monitoring systems help companies quantify emissions in real time, improving compliance efficiency. The integration of digital MRV (Measurement, Reporting, and Verification) systems is reducing operational costs and facilitating cross-border credit trading, accelerating the digital transformation of the carbon compliance market.
Key Trends & Opportunities
Integration of Carbon Credits in Financial Portfolios
Carbon credits are emerging as a new asset class within institutional investment strategies. Financial institutions and hedge funds are incorporating credits into diversified portfolios to hedge environmental and regulatory risks. This financialization of carbon assets creates new liquidity channels and price discovery mechanisms. The rise of carbon-backed exchange-traded funds (ETFs) and derivatives markets also presents strong growth opportunities for investors seeking sustainable and high-yield instruments in compliance carbon markets.
- For instance, Imerys’s ENSACO® carbon blacks are engineered for easy dispersion. Its ENSACO® 250G grade features high structure for conductive polymer mixes, with primary particles sized in the nanometer range.
Growing Collaboration Between Public and Private Sectors
Public-private partnerships are strengthening carbon market frameworks by supporting sustainable project development and credit certification. Governments are collaborating with technology providers, energy firms, and NGOs to expand access to verified carbon reduction projects. This collaboration enables cross-sector innovation in renewable energy, reforestation, and carbon capture initiatives. The growing synergy fosters credibility, scalability, and inclusiveness in compliance markets, aligning emission reduction goals with long-term environmental and economic growth objectives.
- For instance, Brembo-SGL Carbon Ceramic Brakes (BSCCB)—a joint venture between SGL and Brembo—expanded its brake disc capacity by 50 % at plants in Stezzano (Italy) and Meitingen (Germany).
Key Challenges
Lack of Global Standardization in Credit Verification
The absence of a unified global standard for carbon credit validation limits interoperability across regional markets. Differing regulatory definitions, verification methods, and project eligibility criteria create uncertainty for multinational corporations. This fragmentation reduces market efficiency and increases compliance complexity. The need for harmonized frameworks and internationally recognized certification mechanisms remains critical to ensuring transparency, credibility, and cross-border trading consistency in the compliance carbon credit ecosystem.
Volatility in Carbon Credit Prices
Price fluctuations remain a major challenge in the compliance carbon credit market. Factors such as changing emission caps, political instability, and policy revisions can significantly affect credit valuations. This volatility discourages long-term investments and complicates corporate planning. Additionally, limited supply of verified credits in certain regions intensifies price instability. Establishing predictable policy environments and expanding project pipelines are essential steps to mitigate market risk and encourage stable participation from both regulators and enterprises.
Regional Analysis
North America
North America holds a 32% share of the Compliance Carbon Credit Market in 2024, driven by robust regulatory systems and strong corporate sustainability commitments. The U.S. and Canada operate well-established carbon trading mechanisms, including California’s Cap-and-Trade Program and the Regional Greenhouse Gas Initiative (RGGI). These frameworks promote market liquidity and corporate participation. Growing investments in renewable energy, carbon capture technologies, and emission monitoring systems support regional market expansion. The region’s continued policy focus on decarbonization and industrial emission control reinforces its leadership in global carbon compliance frameworks.
Europe
Europe dominates the Compliance Carbon Credit Market with a 39% share in 2024, supported by the European Union Emissions Trading System (EU ETS), the world’s largest and most mature cap-and-trade program. The region’s stringent climate policies and ambitious carbon neutrality goals by 2050 drive consistent credit demand. Key economies such as Germany, France, and the U.K. are advancing renewable integration and industrial emission reduction projects. The inclusion of sectors like shipping and aviation under the EU ETS framework enhances market scope. Europe’s regulatory stability and transparent carbon pricing maintain its competitive edge globally.
Asia-Pacific
Asia-Pacific accounts for a 22% share of the Compliance Carbon Credit Market in 2024, showing rapid growth fueled by expanding emission control programs in China, Japan, and South Korea. China’s National ETS is now the largest in the world by emission volume, encouraging broad corporate participation. Government-led carbon reduction policies and renewable energy investments are accelerating regional compliance initiatives. The emergence of new trading platforms in Singapore and India further strengthens market accessibility. Rising industrialization and energy transition programs position Asia-Pacific as a major growth engine in the coming decade.
Latin America
Latin America holds a 4% share of the Compliance Carbon Credit Market in 2024, with Brazil, Chile, and Colombia emerging as key participants. The region’s abundant natural resources and focus on forest preservation projects support verified carbon credit generation. National emission reduction policies and international partnerships enhance compliance participation. Brazil’s progress in implementing a regulated carbon market and Chile’s carbon pricing initiatives create new growth opportunities. The focus on reforestation, renewable energy, and industrial decarbonization strengthens the region’s contribution to global carbon compliance frameworks.
Middle East & Africa
The Middle East & Africa region represents a 3% share of the Compliance Carbon Credit Market in 2024, with growing participation from the UAE, Saudi Arabia, and South Africa. Regional governments are introducing carbon trading systems and emission reduction programs aligned with sustainability agendas such as Saudi Vision 2030 and UAE Net Zero 2050. Renewable energy expansion and carbon capture investments are gaining momentum. Africa’s reforestation and clean energy initiatives contribute to verified credit generation. The region’s emerging policy frameworks and international cooperation are expected to drive future market development.
Market Segmentations:
By Type:
- Natural Graphite
- Synthetic Graphite
By Application:
By End User:
By Geography
- North America
- Europe
- Germany
- France
- U.K.
- Italy
- Spain
- Rest of Europe
- Asia Pacific
- China
- Japan
- India
- South Korea
- South-east Asia
- Rest of Asia Pacific
- Latin America
- Brazil
- Argentina
- Rest of Latin America
- Middle East & Africa
- GCC Countries
- South Africa
- Rest of the Middle East and Africa
Competitive Landscape
The Compliance Carbon Credit Market is driven by key players including GrafTech International Ltd., Mersen S.A., Mason Graphite Inc., Syrah Resources Ltd., Showa Denko K.K., Northern Graphite Corporation, Imerys Graphite & Carbon, Asbury Carbons, Triton Minerals Ltd., and SGL Carbon SE. The Compliance Carbon Credit Market is witnessing intense competition as companies focus on sustainability-driven strategies and regulatory alignment. Market participants are investing in emission reduction technologies, renewable integration, and carbon capture solutions to strengthen compliance and gain a competitive edge. Firms are increasingly adopting blockchain-based tracking systems and digital verification tools to ensure transparency in credit issuance and trading. Strategic collaborations with governments, industrial sectors, and technology providers enhance market access and credibility. Continuous innovation in carbon accounting, project validation, and renewable asset development supports business expansion and reinforces leadership in the evolving carbon compliance ecosystem.
Shape Your Report to Specific Countries or Regions & Enjoy 30% Off!
Key Player Analysis
- GrafTech International Ltd.
- Mersen S.A.
- Mason Graphite Inc.
- Syrah Resources Ltd.
- Showa Denko K.K.
- Northern Graphite Corporation
- Imerys Graphite & Carbon
- Asbury Carbons
- Triton Minerals Ltd.
- SGL Carbon SE
Recent Developments
- In September 2025, ExxonMobil unveiled a major technological breakthrough, the development of a new synthetic graphite that can extend EV battery lifespans by up to 30%.
- In April 2025, Imerys introduced SU-NERGY, an industrial-scale graphite solution that cuts CO₂ emissions by up to 60% versus conventional grades. The launch illustrates how process innovation directly improves customers’ Scope 3 emissions disclosure while widening Imerys’ specialty-materials portfolio.
- In July 2024, Graphit Kropfmühl partnered with BASF to access renewable-energy certificates for its Hauzenberg plant in Germany. The agreement lowers the site’s graphite carbon footprint by at least 25%, enabling customers to meet EU battery passport requirements ahead of schedule.
- In February 2024, Toyo Tanso Co., Ltd. announced a capital investment of approximately to expand its production capacity for SiC (silicon carbide) and TaC (tantalum carbide)-coated graphite products at its Technology Centre in Kanonji City, Kagawa Prefecture, Japan.
Report Coverage
The research report offers an in-depth analysis based on Type, Application, End-User and Geography. It details leading market players, providing an overview of their business, product offerings, investments, revenue streams, and key applications. Additionally, the report includes insights into the competitive environment, SWOT analysis, current market trends, as well as the primary drivers and constraints. Furthermore, it discusses various factors that have driven market expansion in recent years. The report also explores market dynamics, regulatory scenarios, and technological advancements that are shaping the industry. It assesses the impact of external factors and global economic changes on market growth. Lastly, it provides strategic recommendations for new entrants and established companies to navigate the complexities of the market.
Future Outlook
- Global adoption of carbon trading systems will expand across emerging and developed economies.
- Governments will strengthen emission regulations to promote transparent and verified carbon markets.
- Integration of blockchain and AI will improve traceability and accuracy in credit verification.
- Industrial sectors will increasingly use carbon credits to achieve net-zero emission targets.
- Investment in renewable energy and carbon capture projects will rise to support compliance goals.
- Corporate sustainability reporting will drive higher demand for verified carbon credits.
- Cross-border trading platforms will enhance market liquidity and global participation.
- Public-private collaborations will accelerate large-scale carbon offset initiatives.
- Price stabilization measures and unified standards will improve investor confidence.
- Growing focus on digital MRV systems will streamline credit issuance and compliance efficiency.


