
Market Overview
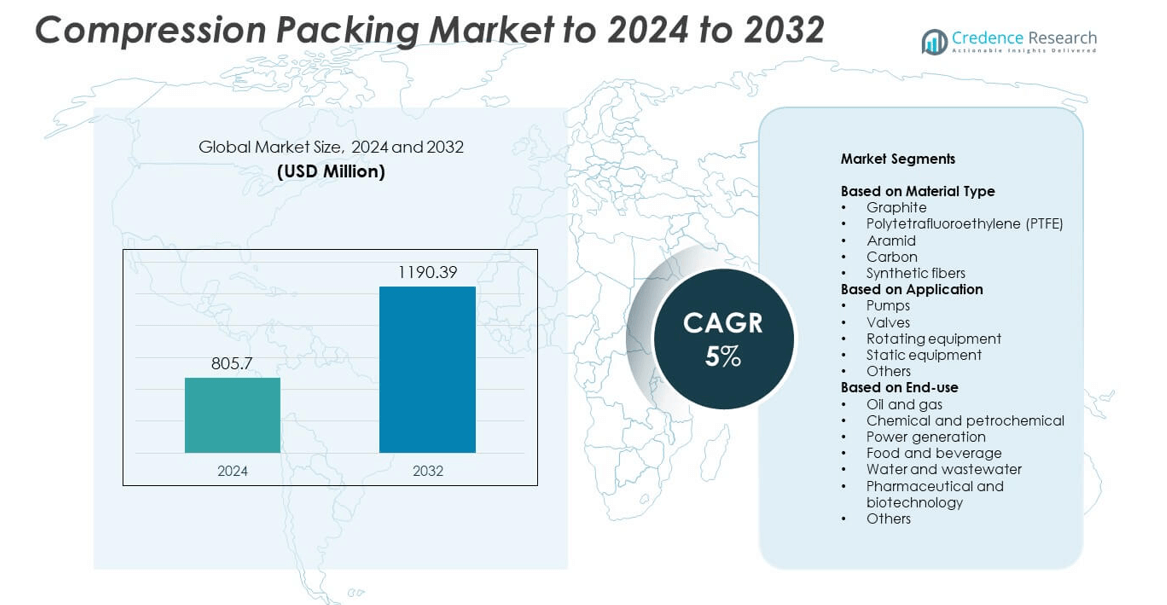
Compression Packing Market size was valued at USD 805.7 million in 2024 and is anticipated to reach USD 1,190.39 million by 2032, at a CAGR of 5% during the forecast period.
| REPORT ATTRIBUTE | DETAILS |
|---|---|
| Historical Period | 2020-2023 |
| Base Year | 2024 |
| Forecast Period | 2025-2032 |
| Compression Packing Market Size 2024 | UUSD 805.7 million |
| Compression Packing Market, CAGR | 5% |
| Compression Packing Market Size 2032 | USD 1,190.39 million |
The compression packing market is dominated by key players such as Freudenberg Sealing Technologies, John Crane, Trelleborg Sealing Solutions, Garlock, EagleBurgmann, and Flexitallic. These companies focus on developing advanced sealing materials with superior chemical and thermal resistance for demanding industrial applications. Continuous investment in innovation, product customization, and global distribution networks strengthens their market presence. Asia-Pacific led the global market with a 34% share in 2024, driven by rapid industrial expansion in China and India. North America followed with a 31% share, supported by strong demand from oil, gas, and chemical processing industries.
Market Insights
- The global compression packing market was valued at USD 805.7 million in 2024 and is projected to reach USD 1,190.39 million by 2032, growing at a CAGR of 5%.
- Increasing demand from oil and gas, power generation, and chemical sectors drives market growth due to the need for reliable sealing solutions under high pressure and temperature.
- Advancements in high-performance materials like graphite, PTFE, and aramid enhance product durability, supporting the shift toward long-lasting, eco-friendly sealing technologies.
- The market is highly competitive, with global players focusing on innovation, customized products, and digital manufacturing to strengthen their presence.
- Asia-Pacific led the market with a 34% share, followed by North America with 31%, while the graphite material segment accounted for 34% of total revenue in 2024, supported by strong demand across industrial and petrochemical applications.
Market Segmentation Analysis:
By Material Type
Graphite held the dominant share of around 34% in the compression packing market in 2024. Its superior thermal conductivity, chemical resistance, and ability to withstand high pressures make it the preferred choice across harsh industrial environments. The material’s flexibility and minimal friction loss also enhance equipment lifespan and sealing performance. PTFE and aramid materials follow closely, driven by demand in chemical processing and food industries for low contamination risk and durability. Increasing emphasis on high-temperature sealing applications in refineries and power plants continues to drive demand for graphite-based packing solutions.
- For instance, TEADIT Style 2000 lists −240 °C to 450 °C continuous, 650 °C steam, and up to 300 bar static and 30 bar rotating service.
By Application
The pumps segment accounted for the largest share of about 41% in 2024. Pumps widely use compression packing for sealing shafts and preventing leakage in fluid transfer systems. Their high adaptability, ease of installation, and cost-effectiveness make them popular in oil, gas, and chemical industries. The valves segment follows due to its importance in regulating flow under high pressure. Expanding industrial infrastructure and increased maintenance of rotating equipment are driving the steady growth of compression packing use across diverse mechanical systems.
- For instance, GARLOCK SYNTHEPAK 8921-K is rated to 11.43 m/s pump speed, 34.5 bar pump pressure, and 172.4 bar valve pressure.
By End-use
The oil and gas industry dominated the market with a 36% share in 2024. Compression packing is essential in upstream and downstream operations to prevent leakage in pumps, valves, and rotating shafts exposed to extreme pressure and temperature. The material’s chemical resistance and sealing efficiency enhance safety and operational reliability. Chemical and petrochemical sectors also show strong demand, driven by expanding refinery capacity. Meanwhile, growth in water and wastewater treatment projects and the power generation sector supports additional adoption of durable sealing materials in critical process applications.
Key Growth Drivers
Rising Demand from Oil and Gas Industry
The oil and gas industry drives strong demand for compression packing due to its critical sealing role in pumps and valves under high pressure and temperature. These products prevent fluid leakage, ensuring safety and efficiency in drilling and refining operations. Expanding upstream and midstream projects, coupled with rising energy production, continue to boost market growth. Manufacturers are also developing advanced materials that improve resistance to aggressive chemicals, further strengthening their use across global oilfield operations.
- For instance, SEPCO ML4002 (GFO®) operates to 288 °C with speeds to 4,400 fpm and pH 0–14 for refinery and chemical service.
Expanding Industrial Infrastructure
Rapid industrialization in emerging economies is a major growth factor for the compression packing market. Growth in power generation, water treatment, and manufacturing sectors has increased the need for reliable sealing materials. Compression packing offers cost-effective and durable solutions suitable for various mechanical systems. Infrastructure expansion in Asia-Pacific, especially in China and India, has created substantial demand. Investments in new industrial plants and pipeline systems continue to strengthen the market outlook over the forecast period.
- For instance, KLINGER offers the K54 PTFE filament packing, which is rated for temperatures from −240 °C to 260 °C and a maximum static pressure of 200 bar, and maintains a wide pH range of 0–14. The standard K54 can handle a peripheral speed of up to 10 m/s, while the K54S variant, a universal gasket, can withstand a slightly higher maximum temperature of 280 °C but has a lower maximum rotary speed of 5 m/s.
Shift Toward High-Performance Materials
Manufacturers are increasingly adopting high-performance materials such as graphite, PTFE, and aramid fibers to enhance product efficiency. These materials offer better heat resistance, low friction, and chemical stability compared to conventional options. Industries requiring high-temperature sealing, like petrochemical and power generation, benefit significantly from these advancements. Continuous innovation in hybrid material combinations helps extend equipment life and reduce maintenance downtime, reinforcing market expansion in sectors where reliability and durability are critical.
Key Trends and Opportunities
Adoption of Eco-Friendly and Low-Emission Materials
Sustainability trends are encouraging the use of eco-friendly and low-VOC materials in compression packing production. Manufacturers are focusing on bio-based and recyclable fibers to meet regulatory and environmental standards. This shift supports global emission goals while improving product safety for food, pharmaceutical, and water treatment applications. The transition to green materials also creates new business opportunities as industries seek sustainable sealing alternatives without compromising performance.
- For instance, James Walker Supagraf Premier achieved ISO 15848-1 Class AH with leakage ≤ 5 ppmV at 69 MPa on a five-ring set in a BSM valve; API 622 testing reported an average 10.5 ppmV.
Automation and Smart Manufacturing Integration
The integration of automation and smart manufacturing technologies is transforming compression packing production. Automated systems ensure consistent product quality, precision in material blending, and reduced production waste. Digital monitoring tools and AI-based inspection systems enhance performance testing and quality assurance. This shift improves operational efficiency and scalability, allowing manufacturers to meet the growing demand for customized, high-performance sealing solutions across energy and industrial sectors.
- For instance, HERZOG PA1 1/24-168 lists 24 carriers, speed to 130 rpm, PLC control, and specialized components for abrasive yarns.
Key Challenges
Volatility in Raw Material Prices
Fluctuations in prices of graphite, PTFE, and synthetic fibers pose a major challenge for manufacturers. Rising material costs impact overall production expenses and profit margins, especially for small and mid-sized producers. The dependence on imported raw materials also exposes the industry to currency risks and supply disruptions. To mitigate this, companies are focusing on long-term supplier agreements and exploring alternative materials that offer stability without compromising product performance.
Competition from Advanced Sealing Technologies
The growing adoption of mechanical seals and advanced sealing systems is challenging compression packing demand. These alternatives offer improved leakage control and lower maintenance requirements in critical applications. As industries modernize their equipment, preference is shifting toward more durable sealing technologies. However, compression packing remains relevant due to its cost-effectiveness and easy installation. Manufacturers must continue innovating material composition and design to maintain competitiveness in high-performance applications.
Regional Analysis
North America
North America held a 31% share of the compression packing market in 2024. The region benefits from a strong industrial base, including oil and gas, chemical, and power generation sectors that rely heavily on reliable sealing solutions. The United States dominates regional demand, driven by ongoing maintenance in refineries and pipeline infrastructure. Technological innovation and the presence of major manufacturers enhance product performance and sustainability. Increasing investment in renewable energy and water treatment facilities also supports market growth across the region during the forecast period.
Europe
Europe accounted for 27% of the global compression packing market in 2024. The region’s established manufacturing sector, strict emission norms, and focus on energy efficiency drive demand for high-performance sealing materials. Germany, France, and the United Kingdom are key contributors, supported by mature chemical and power generation industries. Growing investment in renewable energy infrastructure and wastewater treatment systems also fuels product use. The European market emphasizes eco-friendly and low-leakage packing solutions, aligning with sustainability regulations that promote advanced material innovation and long-term operational reliability.
Asia-Pacific
Asia-Pacific dominated the global market with a 34% share in 2024. Rapid industrialization and expansion of oil refining, petrochemical, and power generation plants across China, India, and Japan drive demand. Growing urbanization and infrastructure development increase equipment usage, leading to higher consumption of compression packing for pumps and valves. The region also benefits from lower manufacturing costs and strong domestic production capacity. Government initiatives supporting industrial growth and energy efficiency further strengthen the market outlook, positioning Asia-Pacific as the fastest-growing regional segment during the forecast period.
Latin America
Latin America captured an 5% share of the compression packing market in 2024. The regional market is supported by the expansion of oil and gas activities in Brazil and Mexico. Increasing industrial output and investments in petrochemical and power generation projects boost product demand. However, economic fluctuations and limited domestic manufacturing capacity slightly restrain growth. Ongoing infrastructure development and rising awareness of preventive maintenance practices are improving adoption rates. The demand for cost-effective and durable sealing materials continues to grow, supporting moderate market expansion across the region.
Middle East & Africa
The Middle East & Africa region accounted for 3% of the global compression packing market in 2024. The market is driven by large-scale oil and gas projects in Saudi Arabia, the UAE, and South Africa. The expansion of petrochemical and desalination facilities creates steady demand for advanced sealing materials. However, limited diversification and dependency on imported raw materials remain challenges. Rising investment in industrial infrastructure and maintenance services is expected to support future growth. Increased focus on operational safety and energy efficiency will likely sustain regional market development through 2032.
Market Segmentations:
By Material Type
- Graphite
- Polytetrafluoroethylene (PTFE)
- Aramid
- Carbon
- Synthetic fibers
By Application
- Pumps
- Valves
- Rotating equipment
- Static equipment
- Others
By End-use
- Oil and gas
- Chemical and petrochemical
- Power generation
- Food and beverage
- Water and wastewater
- Pharmaceutical and biotechnology
- Others
By Geography
- North America
- U.S.
- Canada
- Europe
- Germany
- France
- U.K.
- Italy
- Spain
- Rest of Europe
- Asia Pacific
- China
- Japan
- India
- South Korea
- South-east Asia
- Rest of Asia Pacific
- Latin America
- Brazil
- Mexico
- Rest of Latin America
- Middle East & Africa
- GCC Countries
- South Africa
- Rest of Middle East and Africa
Competitive Landscape
The compression packing market features strong competition among leading manufacturers such as Freudenberg Sealing Technologies, Lamons, SGL Carbon, John Crane, PAR Group, Trelleborg Sealing Solutions, Teadit, EagleBurgmann, James Walker Group, Fluiten Italia, W. L. Gore and Associates, Flexitallic, SEPCO, Klinger Group, Garlock, Chesterton Customseal, Dobson Gaskets, Delmar Company, and GoFREAK. The market is characterized by continual innovation in sealing materials and designs to meet high-performance and sustainability requirements. Companies focus on developing durable, temperature-resistant, and chemically stable packing solutions suitable for demanding industrial environments. Strategic initiatives include product diversification, global distribution network expansion, and collaboration with end-use industries for customized applications. The competitive environment is further shaped by advancements in eco-friendly formulations and automation-driven production processes. Intense rivalry encourages consistent investment in research, digital process monitoring, and long-term customer support, allowing manufacturers to strengthen brand positioning and gain a competitive edge in industrial sealing solutions.
Key Player Analysis
- Freudenberg Sealing Technologies
- Lamons
- SGL Carbon
- John Crane
- PAR Group
- Trelleborg Sealing Solutions
- Teadit
- EagleBurgmann
- James Walker Group
- Fluiten Italia
- L. Gore and Associates
- Flexitallic
- SEPCO
- Klinger Group
- Garlock
- Chesterton Customseal
- Dobson Gaskets
- Delmar Company
- GoFREAK
Recent Developments
- In 2025, John Crane Introduced Type 93AX next-gen coaxial separation seal. Designed to reduce emissions and improve reliability.
- In 2024, GoFREAK Launched compression packing cubes for travel. Consumer luggage accessory.
- In 2024, John Crane (Smiths Group plc) Provided advanced PTFE-based packing with enhanced chemical resistance and minimal friction, catering to the chemical processing sector.
- In 2022, EagleBurgmann Enhanced its HSMR34 and SeccoMix R mechanical seals, resulting in safer and more reliable operation.
Report Coverage
The research report offers an in-depth analysis based on Material Type, Application, End-Use and Geography. It details leading market players, providing an overview of their business, product offerings, investments, revenue streams, and key applications. Additionally, the report includes insights into the competitive environment, SWOT analysis, current market trends, as well as the primary drivers and constraints. Furthermore, it discusses various factors that have driven market expansion in recent years. The report also explores market dynamics, regulatory scenarios, and technological advancements that are shaping the industry. It assesses the impact of external factors and global economic changes on market growth. Lastly, it provides strategic recommendations for new entrants and established companies to navigate the complexities of the market.
Future Outlook
- Demand will rise with expanding oil, gas, and petrochemical operations worldwide.
- Growing industrial automation will drive adoption of precision-engineered sealing products.
- Use of eco-friendly and recyclable materials will increase due to stricter regulations.
- Manufacturers will focus on hybrid materials combining graphite, PTFE, and aramid for better performance.
- Infrastructure investments in Asia-Pacific will create strong growth opportunities.
- Digital monitoring tools will enhance predictive maintenance and reduce equipment downtime.
- Power generation and water treatment industries will remain key end-use sectors.
- Market players will expand through strategic mergers and regional distribution networks.
- Technological innovation will improve product lifespan and thermal resistance.
- Rising emphasis on operational safety will sustain long-term demand for compression packing.
Request a Free Sample
Fill in your details and we'll send you a free sample report.
- Sample data tables & charts
- Research methodology
Need a Custom Version of This Report?
Tailor the scope, geography, or segments to your exact requirements.
- Custom geography or segment scope
- Direct access to our analyst team
Frequently Asked Questions
What is the current market size for Compression Packing Market, and what is its projected size in 2032?
At what Compound Annual Growth Rate is the Compression Packing Market projected to grow between 2025 and 2032?
Which Compression Packing Market segment held the largest share in 2024?
What are the primary factors fueling the growth of the Compression Packing Market?
Who are the leading companies in the Compression Packing Market?
Table of Content
Chapter 1. Report Introduction
- 1.1 Report Description & Purpose
- 1.1.1 Report Title & Market Definition
- 1.1.2 Unique Selling Propositions (USP) & Key Differentiators
- 1.1.3 Value Proposition for Stakeholders
- 1.2 Research Objectives
- 1.2.1 Market Sizing Objectives (Volume & Revenue)
- 1.2.2 Segmentation Objectives
- 1.2.3 Competitive Intelligence Objectives
- 1.2.4 Forecast & Scenario Objectives
- 1.3 Report Scope
- 1.3.1 Compression Packing Scope – Types & Subtypes Covered
- 1.3.2 Geographic Scope – Regions & Countries Covered
- 1.3.3 Historical Period, Base Year & Forecast Period (2024; forecast to 2032)
- 1.3.4 Inclusions & Exclusions
- 1.4 HS Code & Classification Framework
- 1.5 Currency, Units & Pricing Basis
- 1.6 Target Stakeholders
- 1.7 Limitations & Assumptions
Chapter 2. Executive Summary
- 2.1 Global Compression Packing Market Snapshot
- 2.1.1 Market Size – Historical (2024) & Forecast (2024-2032) (2024: USD 805.7 million → 2032: USD 1,190.39 million)
- 2.1.2 Volume & Revenue – Global Totals
- 2.1.3 Key Market Highlights – Top Five Facts
- 2.2 Compression Packing Market Segmentation Snapshot
- 2.2.1 Market Split by Region – 2024 vs. 2032
- 2.3 Competitive Snapshot
- 2.3.1 Top 10 Players by Revenue Share – 2024
- 2.3.2 Top 10 Players by Volume Share – 2024
- 2.3.3 Recent Strategic Developments (18-Month Summary)
- 2.4 Key Investment Highlights & Strategic Conclusions
Chapter 3. Compression Packing Market Dynamics & Industry Analysis
- 3.1 Market Overview & Context
- 3.1.1 Compression Packing Market Position in the Broader Automotive Value Chain
- 3.1.2 OEM vs. Replacement Market Dynamics
- 3.1.3 Market Maturity & Development Stage by Region
- 3.2 Compression Packing Market Drivers
- 3.3 Compression Packing Market Restraints & Challenges
- 3.4 Compression Packing Market Opportunities
- 3.5 Porter's Five Forces Analysis
- 3.5.1 Threat of New Entrants
- 3.5.2 Bargaining Power of Suppliers
- 3.5.3 Bargaining Power of Buyers
- 3.5.4 Threat of Substitutes
- 3.5.5 Competitive Rivalry – Intensity Assessment
- 3.6 Compression Packing Value Chain Analysis
- 3.6.1 Upstream – Raw Material/Input Suppliers
- 3.6.1.1 Raw Material/Input 1
- 3.6.1.2 Raw Material/Input 2
- 3.6.1.3 Raw Material/Input 3
- 3.6.2 Midstream – Production/Manufacturing/Service Delivery
- 3.6.2.1 Production/Process Overview
- 3.6.2.2 Key Facility Locations & Capacity by Manufacturer
- 3.6.3 Downstream – Distribution & End Consumer
- 3.6.3.1 Primary Channel – B2B/OEM
- 3.6.3.2 Secondary Channels – Dealer, Retail, Online, Direct
- 3.6.4 Value Chain Profitability Analysis
- 3.6.1 Upstream – Raw Material/Input Suppliers
- 3.7 PESTEL Analysis
- 3.7.1 Political Factors
- 3.7.2 Economic Factors
- 3.7.3 Social Factors
- 3.7.4 Technological Factors
- 3.7.5 Environmental Factors
- 3.7.6 Legal Factors
- 3.8 Compression Packing Supply Chain Analysis
- 3.8.1 Raw Material/Input Supply Risk Assessment
- 3.8.2 Manufacturing Concentration Risk (Geographic Exposure)
- 3.8.3 Trade Disruption Impact Analysis
- 3.9 Regulatory & Policy Landscape
Note: The regulatory and policy landscape section covers regulations based on their applicability to the market, Compression Packing category, geography, and scope of the study. Only regulatory frameworks with a material impact on operations, compliance, trade, sustainability, or market access are analyzed in detail.
Chapter 4. Key Investment Pockets & Opportunity Analysis
- 4.1 Compression Packing Market Attractiveness Analysis
- 4.1.1 By Region – Investment Attractiveness Matrix (Volume × CAGR)
- 4.2 Absolute Revenue Growth Opportunity
- 4.2.1 By Region – Absolute USD Growth Through 2032
- 4.3 Incremental Volume Opportunity
- 4.3.1 By Region – Incremental Volume Through 2032
- 4.3.2 Segment – Incremental Volume
- 4.4 Emerging Submarket Opportunity Deep Dive (Subject to Applicability)
- 4.5 Emerging Market Opportunity Scorecards
- 4.5.1 United States
- 4.5.2 Europe
- 4.5.3 Asia
- 4.5.4 Middle East & Africa
Note: Emerging Market Opportunity Scorecards will be included based on relevance and strategic importance. Regions listed are indicative and may vary depending on data availability and market dynamics.
Chapter 5. Compression Packing Import-Export Analysis & Trade Flows
- 5.1 Global Trade Overview
- 5.1.1 Global Export Value by Country (2024)
- 5.1.2 Global Export Volume by Country (2024)
- 5.1.3 Global Import Value by Country (2024)
- 5.1.4 Global Import Volume by Country (2024)
- 5.1.5 Net Trade Balance by Country (2024)
- 5.2 Export Analysis – Segment
- 5.2.1 Type 1 (HS Code)
- 5.2.2 Type 2 (HS Code)
- 5.2.3 Type 3 (HS Code)
- 5.2.4 Type 4 (HS Code)
- 5.2.5 Type 5 (HS Code)
- 5.3 Import Analysis – Segment
- 5.3.1 Type 1 (HS Code)
- 5.3.2 Type 2 (HS Code)
- 5.3.3 Type 3 (HS Code)
- 5.3.4 Type 4 (HS Code)
- 5.3.5 Type 5 (HS Code)
- 5.4 Average Unit Trade Prices
- 5.4.1 Average Export Price – Segment & Country
- 5.4.2 Average Import Price – Segment & Source Country
- 5.4.3 Price Trends (2024)
- 5.5 Key Trade Route Analysis
- 5.5.1 Trade Route 1
- 5.5.2 Trade Route 2
- 5.5.3 Trade Route 3
- 5.5.4 Trade Route 4
- 5.5.5 Trade Route 5
- 5.6 Trade Policy Impact Assessment
- 5.6.1 US Anti-Dumping & Section 301 Tariffs
- 5.6.2 EU Customs Union Impact
- 5.6.3 Major Free Trade Agreements
- 5.6.4 USMCA Rules of Origin
Note: Trade policy analysis will be included only where relevant to the Compression Packing market.
Chapter 6. Competitive Landscape & Company Benchmarking
- 6.1 Compression Packing Market Concentration & Structure
- 6.1.1 Herfindahl-Hirschman Index (HHI) – vs. 2024
- 6.1.2 Tier 1, Tier 2 & Tier 3 Market Structure
- 6.1.3 Global, Regional & Local Player Dynamics
- 6.2 Compression Packing Market Share Analysis – 2024
- 6.2.1 Global Revenue Share by Company
- 6.2.2 Global Volume Share by Company
- 6.2.3 Regional Revenue Share
- 6.2.4 Market Share Evolution ( vs. 2024)
- 6.2.5 OEM Segment Share by Company
- 6.2.6 Replacement Segment Share by Company
- 6.3 Production/Delivery Capacity & Facility Analysis
- 6.3.1 Global Installed Capacity
- 6.3.2 Capacity Utilization Rates
- 6.3.3 Production/Output Volume
- 6.3.4 Facility Locations & Capacity Map
- 6.3.5 Planned Capacity Additions
- 6.4 Compression Packing Competitive Benchmarking Matrix
- 6.4.1 Revenue, Volume, CAGR & Profitability Comparison
- 6.4.2 Channel Revenue Mix
- 6.4.3 Geographic Revenue Exposure
- 6.4.4 R&D Intensity
- 6.4.5 Sustainability Maturity
- 6.5 Strategic Developments in Compression Packing (Last 24 Months)
- 6.5.1 Mergers, Acquisitions & Divestments
- 6.5.2 New Compression Packing Launches
- 6.5.3 Facility Expansions
- 6.5.4 Strategic Alliances, Joint Ventures & Partnerships
- 6.5.5 Distribution Expansion & Market Entry
- 6.5.6 Sustainability & ESG Initiatives
- 6.6 Competitive Strategy Mapping
- 6.6.1 Leader, Challenger, Follower & Niche Classification
- 6.6.2 Pricing Strategy Comparison
- 6.6.3 Channel Strategy Matrix
Note: Strategic developments are included based on their materiality and the availability of reliable information.
Chapter 7. Global Compression Packing Market – By Distribution Channel
- 7.1 Segment Overview
- 7.1.1 Volume & Revenue Split by Channel (2024 & 2032)
- 7.1.2 Channel Mix Evolution (2024-2032)
Chapter 8. Regional Market Analysis – Global Overview
- 8.1 Global Regional Overview
- 8.1.1 Regional Volume Share
- 8.1.2 Regional Revenue Share
- 8.1.3 Regional Volume by Region
- 8.1.4 Regional Revenue by Region
- 8.1.5 Regional Forecast Through 2032
- 8.2 Cross-Regional Segment Analysis
- 8.2.1 By Distribution Channel
- 8.2.2 By Brand/Price Tier
Chapter 9. North America Compression Packing Market
- 9.1 United States
- 9.2 Canada
- 9.3 Mexico
Chapter 10. Europe Compression Packing Market
- 10.1 Germany
- 10.2 France
- 10.3 Italy
- 10.4 United Kingdom
- 10.5 Spain
- 10.6 Poland
- 10.7 Russia
- 10.8 Netherlands
- 10.9 Belgium
- 10.10 Sweden
- 10.11 Denmark
- 10.12 Norway
- 10.13 Rest of Europe
Chapter 11. Asia Pacific Compression Packing Market
- 11.1 China
- 11.2 India
- 11.3 Japan
- 11.4 South Korea
- 11.5 Thailand
- 11.6 Indonesia
- 11.7 Vietnam
- 11.8 Malaysia
- 11.9 Australia
- 11.10 Rest of Asia Pacific
Chapter 12. Latin America Compression Packing Market
- 12.1 Brazil
- 12.2 Argentina
- 12.3 Colombia
- 12.4 Chile
- 12.5 Rest of Latin America
Chapter 13. Middle East Compression Packing Market
- 13.1 Saudi Arabia
- 13.2 United Arab Emirates
- 13.3 Turkey
- 13.4 Israel
- 13.5 Iran
- 13.6 Rest of the Middle East
Chapter 14. Africa Compression Packing Market
- 14.1 South Africa
- 14.2 Egypt
- 14.3 Nigeria
- 14.4 Morocco
- 14.5 Rest of Africa
Chapter 15. Compression Packing Company Profiles
- 15.1 [Company 01]
- 15.1.1 Company Overview
- 15.1.2 Key Management Personnel
- 15.1.3 Products & Services Portfolio
- 15.1.4 Financial Performance
- 15.1.5 Key Market Focus & Geographic Presence
- 15.1.6 Recent Developments & Strategic Initiatives
Note: The company profile list is preliminary and may change based on research findings, market developments, data availability, and client requirements.
Chapter 16. Appendices
- Appendix A – List of Abbreviations & Acronyms
- Appendix B – Industry Classification Code Reference – Full Series
- Appendix C – Production & Capacity Data Tables
- Appendix D – End-Use & Demand Base Tables
- Appendix E – Consumption & Replacement Rate Assumptions
- Appendix F – ASP Reference Tables
- Appendix G – Manufacturing & Facility Database
- Appendix H – Import-Export Data Tables
- Appendix I – Regulatory Summary Tables
- Appendix J – Primary Research Participant List (Anonymized)
- Appendix K – Primary Research Questionnaire Framework
- Appendix L – Data Sources & Bibliography
- Appendix M – Market Size Divergence & Source Comparison
Chapter 17. Research Methodology
- 17.1 Research Framework & Philosophy
- 17.2 Secondary Research – Sources, Hierarchy & Data Extraction
- 17.3 Data Modeling – Bottom-Up & Top-Down Market Sizing
- 17.4 Primary Research – Stakeholder Framework, LOI & Sample Sizes
- 17.5 Forecast Methodology – Regression, Scenario & Sensitivity Analysis
- 17.6 Quality Control – Four-Layer Validation Framework
- 17.7 Limitations & Standard Assumptions
- 17.8 Disclaimer
