
Confectionery Ingredients Market Overview:
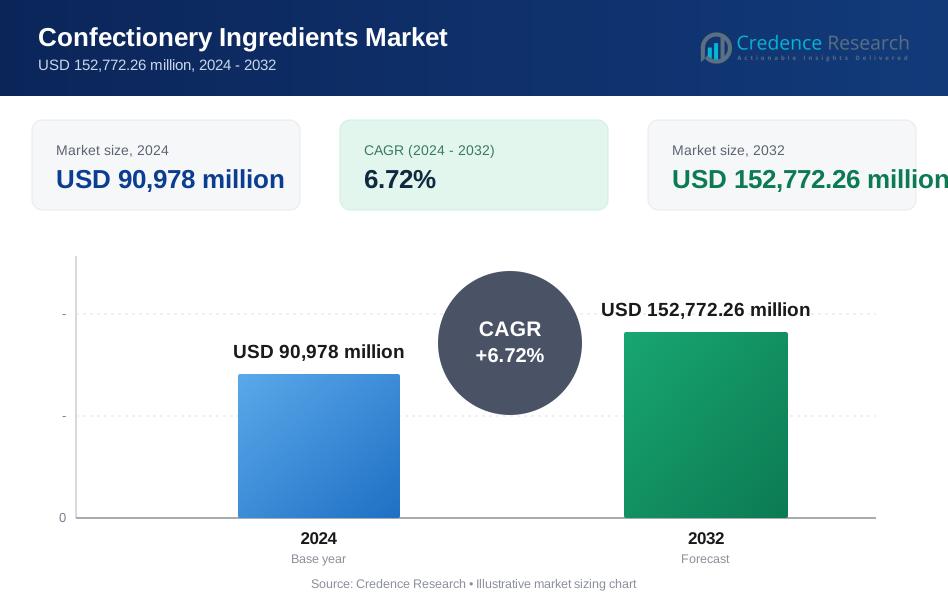
Confectionery Ingredients Market size was valued USD 90978 million in 2024 and is anticipated to reach USD 152772.26 million by 2032, at a CAGR of 6.72% during the forecast period.
| REPORT ATTRIBUTE | DETAILS |
|---|---|
| Historical Period | 2020-2023 |
| Base Year | 2024 |
| Forecast Period | 2025-2032 |
| Confectionery Ingredients Market Size 2024 | USD 90978 million |
| Confectionery Ingredients Market, CAGR | 6.72% |
| Confectionery Ingredients Market Size 2032 | USD 152772.26 million |
Confectionery Ingredients Market Insights
- Market growth is primarily driven by rising consumption of premium confectionery, increasing demand for clean-label formulations, and strong adoption of sugar reduction and plant-based ingredient solutions across developed and emerging economies.
- Key market trends include higher use of alternative sweeteners, functional fibers, cocoa replacers, and texture-enhancing ingredients, with sweeteners and cocoa & chocolate ingredients together accounting for the largest segment share.
- The competitive landscape is characterized by globally integrated suppliers leveraging broad ingredient portfolios, application labs, and scalable production, while focusing on innovation, regulatory compliance, and supply-chain reliability.
- Regionally, North America leads the market with an exact 38% share, followed by Europe and Asia-Pacific, with Asia-Pacific showing faster adoption driven by urbanization, expanding confectionery manufacturing, and rising disposable incomes.
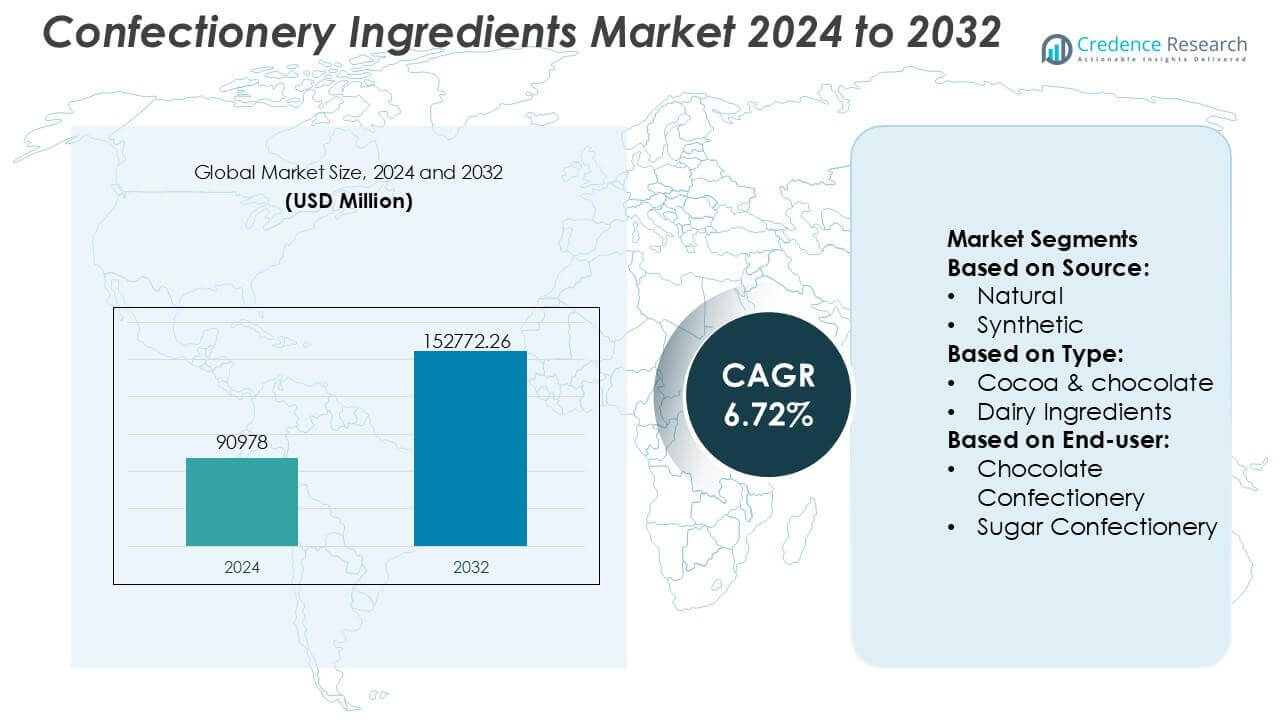
Confectionery Ingredients Market Segmentation Analysis:
By Source
By source, natural ingredients dominate the confectionery ingredients market, accounting for the largest market share due to rising consumer preference for clean-label, plant-derived, and minimally processed formulations. Natural cocoa powders, cane sugar, fruit-based flavors, and natural colors benefit from strong demand for transparency and perceived healthfulness. Regulatory scrutiny on artificial additives and growing awareness of allergen and safety concerns further reinforce this dominance. Synthetic ingredients retain relevance in cost-sensitive and high-volume applications, supported by superior stability, consistency, and shelf life, but their growth is comparatively restrained by reformulation trends favoring natural alternatives.
- For instance, Omega Protein Corporation operates large-scale natural protein extraction facilities along the U.S. Gulf Coast with an annual processing capacity exceeding 400,000 metric tons of raw fish biomass, using continuous low-temperature rendering systems below 90 °C to preserve native amino acid integrity, and deploying centrifugation lines rated at 120 cubic meters per hour to produce food-grade marine proteins suitable for clean-label ingredient applications without chemical solvents.
By Type
By type, cocoa & chocolate ingredients represent the dominant sub-segment, holding the highest market share as core inputs for both premium and mass-market confectionery products. Strong global demand for chocolate bars, filled chocolates, and coatings drives sustained consumption of cocoa liquor, butter, and powders. Premiumization, single-origin sourcing, and dark chocolate formulations further strengthen this segment. Sweeteners follow closely, supported by sugar reduction strategies and the use of alternatives such as polyols and high-intensity sweeteners. Dairy ingredients, flavors, and oils play critical functional roles in texture, taste, and mouthfeel optimization.
- For instance, Roquette utilizes enzymatic systems to convert plant starches into carbohydrates and polyols. To ensure enzyme efficiency and product quality, these reaction temperatures are typically maintained below 60 °C (often around 35 °C to 55 °C depending on the specific enzyme used).
By End-user
By end-user, chocolate confectionery leads the market with the largest share, driven by consistent global consumption, seasonal gifting demand, and innovation in premium and functional chocolates. Manufacturers increasingly focus on texture enhancement, flavor complexity, and cocoa quality differentiation to maintain competitiveness. Sugar confectionery follows, supported by high-volume production of candies, gummies, and jellies, particularly in emerging markets. Bakery confectionery represents a stable segment, benefiting from crossover applications in filled baked goods, inclusions, and decorative toppings, supported by indulgence-driven consumption and expanding artisanal and packaged bakery offerings.
Key Growth Drivers
Rising Demand for Premium and Indulgent Confectionery
Premiumization remains a core growth driver as consumers increasingly seek indulgent, high-quality confectionery experiences. Artisanal chocolates, filled candies, and specialty bakery confections require superior cocoa derivatives, dairy ingredients, flavors, and texturizers to deliver rich taste, smooth mouthfeel, and consistent performance. Urbanization, higher disposable incomes, and gifting culture further support demand for premium formulations. Ingredient suppliers respond by offering refined cocoa powders, specialty fats, and advanced flavor systems that enable manufacturers to differentiate products while maintaining scalability and consistent sensory profiles across global markets.
- For instance, Cargill’s EverSweet® stevia sweetener is the result of more than 300,000 hours of dedicated development by in-house scientists and is manufactured via fermentation systems that deliver consistent Reb M and D profiles suitable for confectionery and beverage applications, with strict traceability to source and controlled glycoside levels established during ISO-reviewed life-cycle assessments.
Expansion of Clean-Label and Natural Ingredient Adoption
Clean-label preferences strongly influence ingredient selection in confectionery manufacturing. Consumers increasingly scrutinize ingredient lists, driving demand for natural colors, flavors, sweeteners, and plant-based emulsifiers. This shift encourages manufacturers to reformulate products by reducing artificial additives without compromising taste, shelf life, or processing efficiency. Natural cocoa, fruit-based flavors, and non-synthetic emulsifiers gain wider acceptance across chocolate and sugar confectionery. Regulatory pressure and retailer standards further accelerate this trend, positioning clean-label ingredient innovation as a structural growth driver across both developed and emerging markets.
- For instance, Tate & Lyle’s Automated Laboratory for Ingredient Experimentation (ALFIE) deployed at its Customer Collaboration and Innovation Center in Singapore can execute up to 96 programmed trials per run, significantly increasing prototype throughput and enabling rapid characterization of ingredient functionality across specified viscosity and gel strength targets in starch and hydrocolloid systems, as documented by industry publications detailing this capability.
Growth of Bakery and Chocolate Confectionery Consumption
Bakery confectionery and chocolate products continue to experience steady consumption growth, supporting higher ingredient demand. Packaged cakes, cookies, chocolate bars, and filled products rely heavily on oils, shortenings, dairy solids, sweeteners, and stabilizers for texture and stability. Convenience-driven lifestyles and expanding modern retail channels boost demand for long-shelf-life formulations. In parallel, foodservice and quick-service bakery expansion fuels bulk ingredient consumption. Ingredient suppliers increasingly tailor solutions for high-throughput production, freeze-thaw stability, and consistent quality across multiple distribution formats.
Key Trends & Opportunities
Innovation in Sugar Reduction and Alternative Sweeteners
Sugar reduction remains a critical trend as health awareness rises globally. Manufacturers increasingly incorporate alternative sweeteners, bulk replacers, and flavor modulators to maintain sweetness and mouthfeel while lowering sugar content. Ingredients such as high-intensity sweeteners, polyols, and natural sweetness enhancers open opportunities for reformulated chocolates and candies aligned with wellness positioning. This trend creates opportunities for ingredient suppliers to deliver customized blends that balance taste, texture, and processing compatibility, particularly for reduced-sugar and portion-controlled confectionery products.
- For instance, Golden Grain Group’s rice protein powders are produced at defined protein concentration levels of 70 grams, 80 grams, and 90 grams per 100 grams respectively, obtained through controlled enzymatic extraction and fractionation systems that manage particle size distribution and solubility metrics directly specified in the company’s product documentation.
Functional and Fortified Confectionery Development
Confectionery products increasingly integrate functional benefits, creating opportunities for value-added ingredients. Vitamins, minerals, proteins, and botanical extracts are incorporated into chocolates, gummies, and bakery confectionery to support energy, immunity, or digestive health claims. This trend expands the role of ingredient suppliers beyond basic inputs toward formulation expertise. Functional confectionery appeals strongly to younger consumers seeking permissible indulgence, encouraging innovation in encapsulation, stability, and flavor masking technologies that ensure nutritional efficacy without compromising sensory appeal.
- For instance, Ingredion recently launched its NOVATION® Indulge 2940 functional native starch, a non-GMO corn starch engineered for enhanced gelling and mouthfeel performance, produced via controlled hydrothermal processing that delivers defined rheology characteristics with peak viscosity profiles calibrated during pilot trials at sethold temperatures of 92 °C and a standardized gel strength measured at 1,800 grams force in texture profile analyses, demonstrating improved sensory texture over conventional native starches in dessert and confectionery applications.
Sustainability-Driven Ingredient Sourcing
Sustainability considerations increasingly influence procurement strategies across the confectionery value chain. Demand grows for responsibly sourced cocoa, sustainable palm oil alternatives, and traceable dairy ingredients. Manufacturers prioritize suppliers offering certified, transparent, and environmentally responsible raw materials to align with corporate sustainability goals. This trend creates long-term opportunities for ingredient producers that invest in sustainable sourcing, supply-chain transparency, and reduced environmental impact, while also supporting brand storytelling and compliance with evolving retailer and regulatory expectations.
Key Challenges
Volatility in Raw Material Prices and Supply
The confectionery ingredients market faces persistent challenges from raw material price volatility and supply uncertainty. Cocoa, dairy, sugar, and vegetable oil markets are highly sensitive to climate conditions, geopolitical factors, and trade disruptions. Fluctuating input costs complicate pricing strategies for both ingredient suppliers and confectionery manufacturers. Managing this volatility requires robust sourcing strategies, long-term supplier relationships, and inventory optimization, all of which increase operational complexity and margin pressure across the value chain.
Balancing Reformulation with Sensory Expectations
Reformulating confectionery products to meet clean-label, sugar-reduction, or functional requirements presents technical challenges. Changes in sweeteners, fats, or emulsifiers can significantly affect taste, texture, shelf life, and processing behavior. Maintaining consumer-expected indulgence while altering formulations requires advanced R&D, extensive testing, and higher development costs. Smaller manufacturers may face resource constraints, while ingredient suppliers must continuously innovate to deliver solutions that achieve regulatory compliance and health objectives without compromising sensory quality.
Regional Analysis
North America
North America holds the largest share of the confectionery ingredients market, accounting for approximately 34% of global demand, supported by high per-capita consumption of chocolate and bakery confectionery. The region benefits from advanced food processing infrastructure, strong presence of multinational confectionery brands, and continuous product innovation. Clean-label reformulation, sugar reduction, and premium chocolate trends drive demand for high-quality cocoa derivatives, dairy ingredients, and specialty fats. Strong retail penetration and foodservice growth further support ingredient consumption, while regulatory clarity and well-established supply chains enable consistent sourcing and large-scale production.
Europe
Europe represents around 29% of the global confectionery ingredients market, driven by a long-standing confectionery tradition and strong demand for premium and artisanal products. Countries with mature chocolate and bakery sectors generate sustained demand for cocoa, dairy solids, flavors, and natural colors. Clean-label compliance, sustainability certifications, and reduced-sugar formulations strongly influence ingredient selection. The region also leads in ethical cocoa sourcing and plant-based alternatives. Stable consumer demand, coupled with innovation in premium chocolates and specialty bakery confectionery, supports consistent ingredient utilization across both industrial and artisanal manufacturers.
Asia-Pacific
Asia-Pacific accounts for approximately 26% of the global market and is the fastest-growing regional segment. Rapid urbanization, rising disposable incomes, and westernization of diets fuel demand for chocolate, sugar confectionery, and bakery products. Expanding modern retail, e-commerce, and local manufacturing capacity accelerate ingredient consumption. The region shows strong growth in sweeteners, flavors, and cocoa substitutes tailored to local taste preferences. Increasing investments in domestic confectionery production and rising demand for affordable indulgence position Asia-Pacific as a key growth engine for global ingredient suppliers.
Latin America
Latin America holds about 7% of the global confectionery ingredients market, supported by growing consumption of chocolate, candies, and bakery confectionery. The region benefits from local availability of key raw materials such as sugar and cocoa, supporting regional ingredient processing. Expanding middle-class populations and improving retail infrastructure drive demand for packaged confectionery. While price sensitivity remains high, manufacturers increasingly adopt value-added ingredients to improve product quality and shelf life. Growth is further supported by rising private-label production and gradual adoption of clean-label and fortified confectionery formats.
Middle East & Africa
The Middle East & Africa region accounts for roughly 4% of global market share, with steady growth driven by urbanization, population expansion, and rising demand for packaged sweets. Increasing penetration of modern retail and international confectionery brands boosts ingredient demand, particularly for sweeteners, flavors, and fats. In the Middle East, premium chocolates and gifting culture support higher-value ingredient usage, while Africa shows gradual growth linked to improving local manufacturing capabilities. Despite infrastructure and supply-chain challenges, long-term demand fundamentals support incremental expansion of the confectionery ingredients market.
Confectionery Ingredients Market Segmentations:
By Source:
- Natural
- Synthetic
By Type:
- Cocoa & chocolate
- Dairy Ingredients
By End-user:
- Chocolate Confectionery
- Sugar Confectionery
By Geography
- North America
- U.S.
- Canada
- Mexico
- Europe
- Germany
- France
- U.K.
- Italy
- Spain
- Rest of Europe
- Asia Pacific
- China
- Japan
- India
- South Korea
- South-east Asia
- Rest of Asia Pacific
- Latin America
- Brazil
- Argentina
- Rest of Latin America
- Middle East & Africa
- GCC Countries
- South Africa
- Rest of the Middle East and Africa
Competitive Landscape
The competitive landscape of the confectionery ingredients market players such as , Roquette Frères, Plasma Nutrition Inc., Cargill, Incorporated, NutriBiotic, Tate & Lyle, Golden Grain Group Limited, Ingredion Incorporated, FMC Corporation, ADM. the confectionery ingredients market reflects a dynamic balance between large-scale ingredient manufacturers and specialized suppliers focused on functional and nutrition-led solutions. Competition centers on the ability to deliver consistent quality across sweeteners, starches, cocoa and chocolate ingredients, dairy components, flavors, fats, and functional additives used in chocolate, sugar confectionery, and bakery confectionery applications. Market participants increasingly differentiate through clean-label formulations, sugar and calorie reduction technologies, and plant-based or allergen-free ingredient platforms that align with evolving consumer preferences. Strong emphasis is placed on application-driven innovation, with suppliers supporting customers through formulation expertise, pilot-scale testing, and customized ingredient systems. Supply-chain integration, global sourcing capabilities, and compliance with stringent food safety and regulatory standards remain critical competitive factors. At the same time, sustainability initiatives, traceability, and responsible sourcing practices are becoming central to long-term positioning, intensifying competition across both mature and emerging confectionery markets.
Key Player Analysis
- Omega Protein Corporation
- Roquette Frères
- Plasma Nutrition Inc.
- Cargill, Incorporated
- NutriBiotic
- Tate & Lyle
- Golden Grain Group Limited
- Ingredion Incorporated
- FMC Corporation
- ADM
Recent Developments
- In May 2025, Chipotle launched "Ingredient Quest," a Roblox game to teach Gen Z about their 53 ingredients through virtual card collecting, rewarding the first 50,000 to complete the collection with free entrees, alongside other digital offers like delivery and free chips/queso via promo codes.
- In April 2025, Arla Foods Ingredients launched its Lacprodan MicelPure portfolio at Vitafoods Europe, featuring new micellar casein isolate (MCI) solutions, including Lacprodan MicelPure Medical, specifically for the growing medical nutrition market, offering high-quality protein with mild taste, low viscosity, and excellent stability for patient compliance in drinks and puddings.
- In March 2025, Nestlé India launched a new CEREGROW with no refined sugar in March 2025, a multigrain cereal for toddlers (2-6 years) packed with 19 key nutrients, protein, calcium, iron, Omega-3, and vitamins, reinforcing their commitment to reducing added sugars in children's products following past criticisms, as confirmed by Vineet Singh, Nestlé Nutrition Director, who stated it's a step towards eliminating sucrose from baby foods.
- In April 2024, Nektium, a Spanish company, launched a new botanical extract named Vanizem, which is sourced from Aframomum melegueta spice. The product is marketed for boosting the mood and alleviating stress.
Report Coverage
The research report offers an in-depth analysis based on Source, Type, End-User and Geography. It details leading market players, providing an overview of their business, product offerings, investments, revenue streams, and key applications. Additionally, the report includes insights into the competitive environment, SWOT analysis, current market trends, as well as the primary drivers and constraints. Furthermore, it discusses various factors that have driven market expansion in recent years. The report also explores market dynamics, regulatory scenarios, and technological advancements that are shaping the industry. It assesses the impact of external factors and global economic changes on market growth. Lastly, it provides strategic recommendations for new entrants and established companies to navigate the complexities of the market.
Future Outlook
- Clean-label and naturally sourced ingredients will gain stronger adoption as manufacturers respond to transparency and traceability demands.
- Sugar reduction solutions using alternative sweeteners and functional fibers will expand across mainstream confectionery formulations.
- Plant-based fats, proteins, and emulsifiers will see higher usage to support vegan and allergen-free product lines.
- Functional ingredients such as fibers, minerals, and bioactive compounds will be increasingly incorporated for added health benefits.
- Sustainable cocoa alternatives and responsibly sourced raw materials will influence supplier selection and formulation strategies.
- Advanced processing technologies will improve texture, stability, and shelf life while reducing formulation complexity.
- Customization and co-development partnerships between ingredient suppliers and confectionery brands will intensify.
- Regulatory compliance and reformulation support will become more critical as food safety and labeling standards tighten globally.
- Emerging markets will drive incremental demand through urbanization, rising incomes, and premium confectionery consumption.
- Digital tools and data-driven formulation platforms will enhance product development speed and consistency.
Request a Free Sample
Fill in your details and we'll send you a free sample report.
- Sample data tables & charts
- Research methodology
Need a Custom Version of This Report?
Tailor the scope, geography, or segments to your exact requirements.
- Custom geography or segment scope
- Direct access to our analyst team
Frequently Asked Questions
What is the current market size for the Confectionery Ingredients Market, and what is its projected size in 2032?
At what Compound Annual Growth Rate is the Confectionery Ingredients Market projected to grow between 2024 and 2032?
Which Confectionery Ingredients Market segment held the largest share in 2024?
What are the primary factors fueling the growth of the Confectionery Ingredients Market?
Who are the leading companies in the Confectionery Ingredients Market?
Which region commanded the largest share of the Confectionery Ingredients Market in 2024?
Table of Content
Chapter 1. Report Introduction
- 1.1 Report Description & Purpose
- 1.1.1 Report Title & Market Definition
- 1.1.2 Unique Selling Propositions (USP) & Key Differentiators
- 1.1.3 Value Proposition for Stakeholders
- 1.2 Research Objectives
- 1.2.1 Market Sizing Objectives (Volume & Revenue)
- 1.2.2 Segmentation Objectives
- 1.2.3 Competitive Intelligence Objectives
- 1.2.4 Forecast & Scenario Objectives
- 1.3 Report Scope
- 1.3.1 Confectionery Ingredients Scope – Types & Subtypes Covered
- 1.3.2 Geographic Scope – Regions & Countries Covered
- 1.3.3 Historical Period, Base Year & Forecast Period (2024; forecast to 2032)
- 1.3.4 Inclusions & Exclusions
- 1.4 HS Code & Classification Framework
- 1.5 Currency, Units & Pricing Basis
- 1.6 Target Stakeholders
- 1.7 Limitations & Assumptions
Chapter 2. Executive Summary
- 2.1 Global Confectionery Ingredients Market Snapshot
- 2.1.1 Market Size – Historical (2024) & Forecast (2024-2032) (2024: USD 90,978 million → 2032: USD 152,772.26 million)
- 2.1.2 Volume & Revenue – Global Totals
- 2.1.3 Key Market Highlights – Top Five Facts
- 2.2 Confectionery Ingredients Market Segmentation Snapshot
- 2.2.1 Market Split by Region – 2024 vs. 2032
- 2.3 Competitive Snapshot
- 2.3.1 Top 10 Players by Revenue Share – 2024
- 2.3.2 Top 10 Players by Volume Share – 2024
- 2.3.3 Recent Strategic Developments (18-Month Summary)
- 2.4 Key Investment Highlights & Strategic Conclusions
Chapter 3. Confectionery Ingredients Market Dynamics & Industry Analysis
- 3.1 Market Overview & Context
- 3.1.1 Confectionery Ingredients Market Position in the Broader Automotive Value Chain
- 3.1.2 OEM vs. Replacement Market Dynamics
- 3.1.3 Market Maturity & Development Stage by Region
- 3.2 Confectionery Ingredients Market Drivers
- 3.3 Confectionery Ingredients Market Restraints & Challenges
- 3.4 Confectionery Ingredients Market Opportunities
- 3.5 Porter's Five Forces Analysis
- 3.5.1 Threat of New Entrants
- 3.5.2 Bargaining Power of Suppliers
- 3.5.3 Bargaining Power of Buyers
- 3.5.4 Threat of Substitutes
- 3.5.5 Competitive Rivalry – Intensity Assessment
- 3.6 Confectionery Ingredients Value Chain Analysis
- 3.6.1 Upstream – Raw Material/Input Suppliers
- 3.6.1.1 Raw Material/Input 1
- 3.6.1.2 Raw Material/Input 2
- 3.6.1.3 Raw Material/Input 3
- 3.6.2 Midstream – Production/Manufacturing/Service Delivery
- 3.6.2.1 Production/Process Overview
- 3.6.2.2 Key Facility Locations & Capacity by Manufacturer
- 3.6.3 Downstream – Distribution & End Consumer
- 3.6.3.1 Primary Channel – B2B/OEM
- 3.6.3.2 Secondary Channels – Dealer, Retail, Online, Direct
- 3.6.4 Value Chain Profitability Analysis
- 3.6.1 Upstream – Raw Material/Input Suppliers
- 3.7 PESTEL Analysis
- 3.7.1 Political Factors
- 3.7.2 Economic Factors
- 3.7.3 Social Factors
- 3.7.4 Technological Factors
- 3.7.5 Environmental Factors
- 3.7.6 Legal Factors
- 3.8 Confectionery Ingredients Supply Chain Analysis
- 3.8.1 Raw Material/Input Supply Risk Assessment
- 3.8.2 Manufacturing Concentration Risk (Geographic Exposure)
- 3.8.3 Trade Disruption Impact Analysis
- 3.9 Regulatory & Policy Landscape
Note: The regulatory and policy landscape section covers regulations based on their applicability to the market, Confectionery Ingredients category, geography, and scope of the study. Only regulatory frameworks with a material impact on operations, compliance, trade, sustainability, or market access are analyzed in detail.
Chapter 4. Key Investment Pockets & Opportunity Analysis
- 4.1 Confectionery Ingredients Market Attractiveness Analysis
- 4.1.1 By Region – Investment Attractiveness Matrix (Volume × CAGR)
- 4.2 Absolute Revenue Growth Opportunity
- 4.2.1 By Region – Absolute USD Growth Through 2032
- 4.3 Incremental Volume Opportunity
- 4.3.1 By Region – Incremental Volume Through 2032
- 4.3.2 Segment – Incremental Volume
- 4.4 Emerging Submarket Opportunity Deep Dive (Subject to Applicability)
- 4.5 Emerging Market Opportunity Scorecards
- 4.5.1 United States
- 4.5.2 Europe
- 4.5.3 Asia
- 4.5.4 Middle East & Africa
Note: Emerging Market Opportunity Scorecards will be included based on relevance and strategic importance. Regions listed are indicative and may vary depending on data availability and market dynamics.
Chapter 5. Confectionery Ingredients Import-Export Analysis & Trade Flows
- 5.1 Global Trade Overview
- 5.1.1 Global Export Value by Country (2024)
- 5.1.2 Global Export Volume by Country (2024)
- 5.1.3 Global Import Value by Country (2024)
- 5.1.4 Global Import Volume by Country (2024)
- 5.1.5 Net Trade Balance by Country (2024)
- 5.2 Export Analysis – Segment
- 5.2.1 Type 1 (HS Code)
- 5.2.2 Type 2 (HS Code)
- 5.2.3 Type 3 (HS Code)
- 5.2.4 Type 4 (HS Code)
- 5.2.5 Type 5 (HS Code)
- 5.3 Import Analysis – Segment
- 5.3.1 Type 1 (HS Code)
- 5.3.2 Type 2 (HS Code)
- 5.3.3 Type 3 (HS Code)
- 5.3.4 Type 4 (HS Code)
- 5.3.5 Type 5 (HS Code)
- 5.4 Average Unit Trade Prices
- 5.4.1 Average Export Price – Segment & Country
- 5.4.2 Average Import Price – Segment & Source Country
- 5.4.3 Price Trends (2024)
- 5.5 Key Trade Route Analysis
- 5.5.1 Trade Route 1
- 5.5.2 Trade Route 2
- 5.5.3 Trade Route 3
- 5.5.4 Trade Route 4
- 5.5.5 Trade Route 5
- 5.6 Trade Policy Impact Assessment
- 5.6.1 US Anti-Dumping & Section 301 Tariffs
- 5.6.2 EU Customs Union Impact
- 5.6.3 Major Free Trade Agreements
- 5.6.4 USMCA Rules of Origin
Note: Trade policy analysis will be included only where relevant to the Confectionery Ingredients market.
Chapter 6. Competitive Landscape & Company Benchmarking
- 6.1 Confectionery Ingredients Market Concentration & Structure
- 6.1.1 Herfindahl-Hirschman Index (HHI) – vs. 2024
- 6.1.2 Tier 1, Tier 2 & Tier 3 Market Structure
- 6.1.3 Global, Regional & Local Player Dynamics
- 6.2 Confectionery Ingredients Market Share Analysis – 2024
- 6.2.1 Global Revenue Share by Company
- 6.2.2 Global Volume Share by Company
- 6.2.3 Regional Revenue Share
- 6.2.4 Market Share Evolution ( vs. 2024)
- 6.2.5 OEM Segment Share by Company
- 6.2.6 Replacement Segment Share by Company
- 6.3 Production/Delivery Capacity & Facility Analysis
- 6.3.1 Global Installed Capacity
- 6.3.2 Capacity Utilization Rates
- 6.3.3 Production/Output Volume
- 6.3.4 Facility Locations & Capacity Map
- 6.3.5 Planned Capacity Additions
- 6.4 Confectionery Ingredients Competitive Benchmarking Matrix
- 6.4.1 Revenue, Volume, CAGR & Profitability Comparison
- 6.4.2 Channel Revenue Mix
- 6.4.3 Geographic Revenue Exposure
- 6.4.4 R&D Intensity
- 6.4.5 Sustainability Maturity
- 6.5 Strategic Developments in Confectionery Ingredients (Last 24 Months)
- 6.5.1 Mergers, Acquisitions & Divestments
- 6.5.2 New Confectionery Ingredients Launches
- 6.5.3 Facility Expansions
- 6.5.4 Strategic Alliances, Joint Ventures & Partnerships
- 6.5.5 Distribution Expansion & Market Entry
- 6.5.6 Sustainability & ESG Initiatives
- 6.6 Competitive Strategy Mapping
- 6.6.1 Leader, Challenger, Follower & Niche Classification
- 6.6.2 Pricing Strategy Comparison
- 6.6.3 Channel Strategy Matrix
Note: Strategic developments are included based on their materiality and the availability of reliable information.
Chapter 7. Global Confectionery Ingredients Market – By Distribution Channel
- 7.1 Segment Overview
- 7.1.1 Volume & Revenue Split by Channel (2024 & 2032)
- 7.1.2 Channel Mix Evolution (2024-2032)
Chapter 8. Regional Market Analysis – Global Overview
- 8.1 Global Regional Overview
- 8.1.1 Regional Volume Share
- 8.1.2 Regional Revenue Share
- 8.1.3 Regional Volume by Region
- 8.1.4 Regional Revenue by Region
- 8.1.5 Regional Forecast Through 2032
- 8.2 Cross-Regional Segment Analysis
- 8.2.1 By Distribution Channel
- 8.2.2 By Brand/Price Tier
Chapter 9. North America Confectionery Ingredients Market
- 9.1 United States
- 9.2 Canada
- 9.3 Mexico
Chapter 10. Europe Confectionery Ingredients Market
- 10.1 Germany
- 10.2 France
- 10.3 Italy
- 10.4 United Kingdom
- 10.5 Spain
- 10.6 Poland
- 10.7 Russia
- 10.8 Netherlands
- 10.9 Belgium
- 10.10 Sweden
- 10.11 Denmark
- 10.12 Norway
- 10.13 Rest of Europe
Chapter 11. Asia Pacific Confectionery Ingredients Market
- 11.1 China
- 11.2 India
- 11.3 Japan
- 11.4 South Korea
- 11.5 Thailand
- 11.6 Indonesia
- 11.7 Vietnam
- 11.8 Malaysia
- 11.9 Australia
- 11.10 Rest of Asia Pacific
Chapter 12. Latin America Confectionery Ingredients Market
- 12.1 Brazil
- 12.2 Argentina
- 12.3 Colombia
- 12.4 Chile
- 12.5 Rest of Latin America
Chapter 13. Middle East Confectionery Ingredients Market
- 13.1 Saudi Arabia
- 13.2 United Arab Emirates
- 13.3 Turkey
- 13.4 Israel
- 13.5 Iran
- 13.6 Rest of the Middle East
Chapter 14. Africa Confectionery Ingredients Market
- 14.1 South Africa
- 14.2 Egypt
- 14.3 Nigeria
- 14.4 Morocco
- 14.5 Rest of Africa
Chapter 15. Confectionery Ingredients Company Profiles
- 15.1 [Company 01]
- 15.1.1 Company Overview
- 15.1.2 Key Management Personnel
- 15.1.3 Products & Services Portfolio
- 15.1.4 Financial Performance
- 15.1.5 Key Market Focus & Geographic Presence
- 15.1.6 Recent Developments & Strategic Initiatives
Note: The company profile list is preliminary and may change based on research findings, market developments, data availability, and client requirements.
Chapter 16. Appendices
- Appendix A – List of Abbreviations & Acronyms
- Appendix B – Industry Classification Code Reference – Full Series
- Appendix C – Production & Capacity Data Tables
- Appendix D – End-Use & Demand Base Tables
- Appendix E – Consumption & Replacement Rate Assumptions
- Appendix F – ASP Reference Tables
- Appendix G – Manufacturing & Facility Database
- Appendix H – Import-Export Data Tables
- Appendix I – Regulatory Summary Tables
- Appendix J – Primary Research Participant List (Anonymized)
- Appendix K – Primary Research Questionnaire Framework
- Appendix L – Data Sources & Bibliography
- Appendix M – Market Size Divergence & Source Comparison
Chapter 17. Research Methodology
- 17.1 Research Framework & Philosophy
- 17.2 Secondary Research – Sources, Hierarchy & Data Extraction
- 17.3 Data Modeling – Bottom-Up & Top-Down Market Sizing
- 17.4 Primary Research – Stakeholder Framework, LOI & Sample Sizes
- 17.5 Forecast Methodology – Regression, Scenario & Sensitivity Analysis
- 17.6 Quality Control – Four-Layer Validation Framework
- 17.7 Limitations & Standard Assumptions
- 17.8 Disclaimer
