
| REPORT ATTRIBUTE | DETAILS |
|---|---|
| Historical Period | 2019-2022 |
| Base Year | 2023 |
| Forecast Period | 2024-2032 |
| Connected Homes Market Size 2023 | USD 80,924.71 Million |
| Connected Homes Market, CAGR | 9.50% |
| Connected Homes Market Size 2032 | USD 183,150.55 Million |
Market Overview
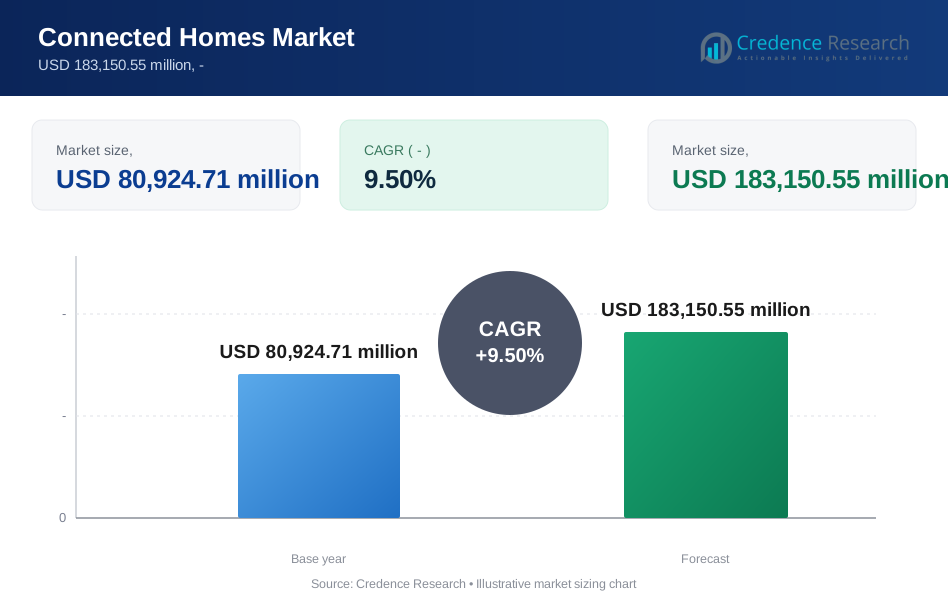
The global connected homes market is projected to grow from USD 80,924.71 million in 2023 to USD 183,150.55 million by 2032, at a CAGR of 9.50%.
The global connected homes market is driven by the increasing demand for energy efficiency and enhanced home security. Advancements in IoT and AI technologies enable seamless integration and smarter home automation, fueling market growth. The rise in consumer awareness about the benefits of connected home devices, coupled with the expansion of high-speed internet services, further supports the market's expansion. Additionally, ongoing innovations in user interface designs are making connected home solutions more accessible and appealing to a broader audience. These factors collectively propel the global connected homes market forward, reflecting a trend towards more interconnected and tech-savvy living environments.
The Global Connected Homes Market exhibits significant growth across North America, Europe, Asia-Pacific, and other regions, driven by varying technological adoption rates and consumer preferences. Key players such as Google, Amazon, and Samsung are pivotal in advancing the market, leveraging their technological expertise and expansive consumer bases. In North America, the market thrives due to high consumer tech-savviness and robust infrastructure. Conversely, Asia-Pacific is witnessing rapid growth due to increasing internet penetration and a rising middle class. These regional dynamics, coupled with the innovations from leading companies, are crucial in shaping the connected homes landscape globally.
Market Drivers
Increased Consumer Adoption
Consumers are increasingly interested in smart home technology due to its numerous benefits including convenience, security, and energy efficiency. For instance, smart thermostats have the capability to learn a homeowner’s habits and adjust the temperature accordingly, leading to significant energy savings. For instance, the adoption of smart thermostats has led to an average energy savings of 10-12% on heating and 15% on cooling. Smart locks and security cameras have also seen a surge in popularity, with the market growing by 18% annually, as they offer the convenience of remote management and act as a deterrent to crime.
Advancements in IoT and AI Technologies
The Internet of Things (IoT) and Artificial Intelligence (AI) are pivotal in advancing the connected homes market. IoT enables appliances and devices to connect to the internet, enhancing their functionality and utility. In the realm of IoT and AI technologies, there has been a 300% increase in the number of connected devices over the past five years. Smart speakers, for example, have become central to the smart home ecosystem, with 70% of smart home device owners using them to control other devices. This convenience factor has contributed to a 20% year-over-year increase in the smart speaker market. For example, smart speakers equipped with AI assistants can control other smart home devices, respond to queries, and stream music, simplifying the user experience and bolstering market growth.
Emphasis on Energy Efficiency and Sustainability
As awareness of energy efficiency and sustainability grows, more consumers are turning to smart home technology to reduce their environmental impact. Regarding energy efficiency and sustainability, smart lighting systems have been particularly impactful, reducing energy usage by up to 60% compared to traditional lighting. This aligns with the consumer trend towards sustainable living, as 85% of consumers express a preference for energy-efficient products. The emphasis on sustainability is further evidenced by the fact that 45% of new homes are now being equipped with some form of smart energy management system, reflecting the growing demand for eco-friendly living solutions.
Integration, Interoperability, and Smart Home Services
The increasing integration and interoperability of smart home devices make it easier for consumers to manage a fully connected home environment. This seamless connectivity is complemented by a variety of smart home services such as security monitoring, appliance diagnostics, and energy management, which enhance the value and appeal of smart home systems. Furthermore, the proliferation of voice assistants like Amazon Alexa, Google Assistant, and Apple Siri simplifies the management of smart devices through intuitive voice commands, thereby enriching the user experience and facilitating wider adoption.
Market Trends
Enhanced Security Measures:
As the amount of time spent at home increases, security and safety remain paramount concerns among consumers. For instance, in the past year, the global market for smart home security cameras has seen a 20% increase, with over 30 million units sold worldwide. Video doorbells have become particularly popular, with a 25% rise in sales, indicating a strong consumer preference for visual verification of visitors. Integrated security systems are also on the rise, with a 40% increase in installations, as they offer comprehensive protection by combining various security devices into one networked solution. These systems often include remote control features, which have been used by 60% of homeowners to monitor their homes while away. These technologies offer remote control and monitoring capabilities, providing homeowners with peace of mind and enhanced protection against intrusions.
Dominance of Voice-Enabled Control:
Voice assistants such as Alexa and Google Assistant are revolutionizing the way users interact with their smart home systems. Voice assistants, such as Alexa and Google Assistant, are now present in over 70 million homes, with a 35% year-over-year growth in usage. For instance, 55% of smart home device owners use voice commands daily to interact with their devices. This trend is bolstered by the fact that 65% of users find voice control more convenient than traditional interfaces. As a result, voice commands are becoming the central interface for the smart home, with 80% of new smart home devices being developed with built-in voice control capabilities. This trend is expected to expand further, making voice commands the central interface for navigating the connected home environment.
Market Challenges Analysis
Security Concerns and Economic Barriers
Consumers express legitimate concerns regarding the security of their personal data and the vulnerability of smart home devices to hacking. These anxieties are fueled by incidents of data breaches and unauthorized access, which pose serious threats to personal privacy and security. Such security challenges necessitate robust cybersecurity measures and continuous updates to maintain the integrity and trustworthiness of smart home systems. The initial setup of a smart home system often involves substantial expenses, including the cost of devices and installation fees, which can be prohibitive for many potential users. Moreover, the technical complexity of configuring and operating these systems can discourage those who are not technologically adept. Simplifying these systems and making them more user-friendly, alongside reducing costs, is crucial to expanding market penetration.
Integration Challenges and Market Limitations
Despite advancements, many smart home devices still face significant challenges in achieving seamless communication, particularly across different brands. This lack of interoperability leads to a fragmented user experience and diminishes the overall functionality and appeal of connected homes. Enhancing compatibility across diverse systems remains a critical step toward creating a more cohesive and functional smart home environment. Several external factors also impede the growth of the connected homes market. Limited broadband access in certain areas restricts the functionality of smart home devices, which rely heavily on stable, high-speed internet connections. Additionally, the evolving regulatory landscape poses another challenge, as governments work to establish regulations that ensure data privacy and security without stifling innovation. This regulatory uncertainty can create hesitation among businesses and consumers alike.
Market Segmentation Analysis:
By Functionality:
The Global Connected Homes Market is segmented by functionality into several key areas: Energy and Utilities Management, Smart Entertainment, Wellness and Monitoring, Security and Safety, and Smart Appliance. Each segment caters to specific consumer needs and preferences. Energy and Utilities Management focuses on optimizing energy usage and reducing costs through smart thermostats and automated lighting systems. Smart Entertainment enhances the in-home experience with advanced systems for audio, video, and other multimedia services. Wellness and Monitoring emphasize health-related features, including environment monitoring and emergency notification systems. Security and Safety are paramount, with products like smart locks and surveillance systems providing enhanced protection. Lastly, Smart Appliances integrate IoT technology to streamline kitchen and household operations, making daily tasks simpler and more efficient.
By Component:
In terms of components, the market is divided into Light Control Solutions, Security Solutions, Entertainment Solutions, Home Healthcare Solutions, and Energy Management Solutions. Light Control Solutions offer automated and customizable lighting settings that enhance convenience and energy efficiency. Security Solutions focus on safeguarding homes through alarms, cameras, and integrated security systems. Entertainment Solutions provide seamless integration of home theater and multimedia, enriching the user's entertainment experience. Home Healthcare Solutions cater to health management with devices that monitor vital signs and offer regular updates to healthcare providers. Energy Management Solutions help manage and reduce energy consumption through smart grids and energy-efficient appliances, aligning with global sustainability goals. Each component is integral to the connected homes ecosystem, driving the overall market growth by meeting diverse consumer demands.
Segments:
Based on Functionality
- Energy and Utilities Management
- Smart Entertainment
- Wellness and Monitoring
- Security and Safety
- Smart Appliance
Based on Component
- Light Control Solution
- Security Solution
- Entertainment Solution
- Home Healthcare Solution
- Energy Management Solution
Based on Platform
- Smartphones
- Laptops
- Home Gateway
- Other Platforms
Based on Type of Homes
- Apartment
- Villa/Bungalow
- Other Homes
Based on the Geography:
- North America
- Asia-Pacific
- South America
- Europe
- Middle East and Africa
Regional Analysis
North America, comprising the United States and Canada, holds a dominant market share of approximately 35% in the global connected homes market. This region has been at the forefront of technological innovations and early adoption of smart home technologies. The presence of major technology companies, coupled with consumer awareness and demand for convenience and energy efficiency, has fueled the growth of the connected homes market in North America.
The Asia-Pacific region, including countries like China, Japan, and South Korea, accounts for around 30% of the global connected homes market share. This region has witnessed a rapid adoption of connected home solutions, driven by factors such as urbanization, rising disposable incomes, and the proliferation of smartphones and internet connectivity. Government initiatives and smart city projects in countries like China and Singapore have further accelerated the growth of the connected homes market in the Asia-Pacific region.
Key Player Analysis
- Ericsson AB
- Companies Co
- Schneider Electric Se
- Siemens AG
- ABB Ltd.
- Honeywell International, Inc.
- General Electric Company
- United Technologies Corporation
- Johnson Controls, Inc.
- Legrand S.A.
- Samsung Electronics Co., Ltd.
Competitive Analysis
The competitive landscape of the Global Connected Homes Market is dynamic, with major players such as Google, Amazon, Samsung, and Apple playing pivotal roles. These companies dominate due to their extensive technological capabilities, brand reputation, and innovative product offerings that integrate seamlessly with various smart home devices. Google and Amazon, for instance, leverage their voice assistant technologies (Google Assistant and Amazon Alexa) to enhance user interaction with connected home systems. Samsung and Apple, on the other hand, utilize their strong presence in consumer electronics to push the boundaries of what connected home devices can achieve, focusing on interoperability and user-friendly interfaces. These companies are engaged in fierce competition, constantly updating their product lines and exploring new market segments to cater to evolving consumer demands. Their strategies typically involve heavy investments in R&D, strategic partnerships, and aggressive marketing, which help them maintain and extend their market dominance.
Recent Developments
- In 2023, the advanced home automation with Alexa was introduced by Amazon with the penetration of the artificial intelligence that can do wonders in controlling the home with the connected devices. The new feature accelerates the control devices with echo hubs and map view that eventually to leverage the living experience to the extent.
- In 2023, Ecobee is ready to set the trend in the connected home by launching the Ecobee Smart Doorbell Camera Review. This company is stepping towards the expansion fot he company’s product portfolio by launching ecosystem products in favor to the user with the latest technological developments. Ecobee is planning to deliver advanced wireless technological thermostats that operates with the sensors connected with the internet technology.
Market Concentration & Characteristics
The Global Connected Homes Market is characterized by a moderate to high level of market concentration, dominated by a few major technology firms that have leveraged their extensive capabilities in innovation and consumer reach to establish strong market positions. Companies like Google, Amazon, Samsung, and Apple are at the forefront, controlling a significant share of the market due to their established ecosystems of devices and services, which promote user stickiness and brand loyalty. The market features a blend of direct competition and strategic collaborations among these key players, aiming to enhance product interoperability and expand consumer base. Additionally, the market is also witnessing an influx of startups and mid-size enterprises that introduce niche innovations and specialized solutions, contributing to the dynamic and competitive nature of the market. This concentration and the evolving characteristics ensure ongoing advancements and the introduction of more integrated and consumer-friendly smart home solutions.
Report Coverage
The research report offers an in-depth analysis based on Functionality, Component, Platform, Type of Homes and Geography. It details leading market players, providing an overview of their business, product offerings, investments, revenue streams, and key applications. Additionally, the report includes insights into the competitive environment, SWOT analysis, current market trends, as well as the primary drivers and constraints. Furthermore, it discusses various factors that have driven market expansion in recent years. The report also explores market dynamics, regulatory scenarios, and technological advancements that are shaping the industry. It assesses the impact of external factors and global economic changes on market growth. Lastly, it provides strategic recommendations for new entrants and established companies to navigate the complexities of the market.
Future Outlook
- Continued growth in IoT and AI integration will enhance the functionality and user-friendliness of connected home devices.
- Expansion of voice assistant capabilities will likely become central to the operation of smart home systems.
- Increased focus on energy efficiency and sustainability will drive demand for smart utility management solutions.
- Advancements in cybersecurity measures to protect user data and prevent unauthorized access will become a priority.
- Greater emphasis on interoperability will lead to more seamless communication between devices from different manufacturers.
- The development of more intuitive user interfaces will lower the barrier for entry for non-tech-savvy consumers.
- Expansion of high-speed internet in developing regions will open new markets for connected home technologies.
- Regulatory changes will shape the market, with increased focus on privacy and data security.
- Adoption of connected home technologies in rental properties and multi-family units will increase.
- Integration of health and wellness features will expand, making connected homes central to personal health management.
Request a Free Sample
Fill in your details and we'll send you a free sample report.
- Sample data tables & charts
- Research methodology
Need a Custom Version of This Report?
Tailor the scope, geography, or segments to your exact requirements.
- Custom geography or segment scope
- Direct access to our analyst team
Frequently Asked Questions
What is the current size of the Global Connected Homes Market?
What factors are driving the growth of the Global Connected Homes Market?
What are the key segments within the Global Connected Homes Market?
What are some challenges faced by the Global Connected Homes Market?
Who are the major players in the Global Connected Homes Market?
Which segment is leading the market share?
Table of Content
Chapter 1. Report Introduction
- 1.1 Report Description & Purpose
- 1.1.1 Report Title & Market Definition
- 1.1.2 Unique Selling Propositions (USP) & Key Differentiators
- 1.1.3 Value Proposition for Stakeholders
- 1.2 Research Objectives
- 1.2.1 Market Sizing Objectives (Volume & Revenue)
- 1.2.2 Segmentation Objectives
- 1.2.3 Competitive Intelligence Objectives
- 1.2.4 Forecast & Scenario Objectives
- 1.3 Report Scope
- 1.3.1 Connected Homes Scope – Types & Subtypes Covered
- 1.3.2 Geographic Scope – Regions & Countries Covered
- 1.3.3 Historical Period, Base Year & Forecast Period (the historical period; forecast to the forecast period)
- 1.3.4 Inclusions & Exclusions
- 1.4 HS Code & Classification Framework
- 1.5 Currency, Units & Pricing Basis
- 1.6 Target Stakeholders
- 1.7 Limitations & Assumptions
Chapter 2. Executive Summary
- 2.1 Global Connected Homes Market Snapshot
- 2.1.1 Market Size – Historical (the historical period) & Forecast (the forecast period) (base year: USD 80,924.71 million → forecast year: USD 183,150.55 million)
- 2.1.2 Volume & Revenue – Global Totals
- 2.1.3 Key Market Highlights – Top Five Facts
- 2.2 Connected Homes Market Segmentation Snapshot
- 2.2.1 Market Split by Region – vs.
- 2.3 Competitive Snapshot
- 2.3.1 Top 10 Players by Revenue Share –
- 2.3.2 Top 10 Players by Volume Share –
- 2.3.3 Recent Strategic Developments (18-Month Summary)
- 2.4 Key Investment Highlights & Strategic Conclusions
Chapter 3. Connected Homes Market Dynamics & Industry Analysis
- 3.1 Market Overview & Context
- 3.1.1 Connected Homes Market Position in the Broader Automotive Value Chain
- 3.1.2 OEM vs. Replacement Market Dynamics
- 3.1.3 Market Maturity & Development Stage by Region
- 3.2 Connected Homes Market Drivers
- 3.3 Connected Homes Market Restraints & Challenges
- 3.4 Connected Homes Market Opportunities
- 3.5 Porter's Five Forces Analysis
- 3.5.1 Threat of New Entrants
- 3.5.2 Bargaining Power of Suppliers
- 3.5.3 Bargaining Power of Buyers
- 3.5.4 Threat of Substitutes
- 3.5.5 Competitive Rivalry – Intensity Assessment
- 3.6 Connected Homes Value Chain Analysis
- 3.6.1 Upstream – Raw Material/Input Suppliers
- 3.6.1.1 Raw Material/Input 1
- 3.6.1.2 Raw Material/Input 2
- 3.6.1.3 Raw Material/Input 3
- 3.6.2 Midstream – Production/Manufacturing/Service Delivery
- 3.6.2.1 Production/Process Overview
- 3.6.2.2 Key Facility Locations & Capacity by Manufacturer
- 3.6.3 Downstream – Distribution & End Consumer
- 3.6.3.1 Primary Channel – B2B/OEM
- 3.6.3.2 Secondary Channels – Dealer, Retail, Online, Direct
- 3.6.4 Value Chain Profitability Analysis
- 3.6.1 Upstream – Raw Material/Input Suppliers
- 3.7 PESTEL Analysis
- 3.7.1 Political Factors
- 3.7.2 Economic Factors
- 3.7.3 Social Factors
- 3.7.4 Technological Factors
- 3.7.5 Environmental Factors
- 3.7.6 Legal Factors
- 3.8 Connected Homes Supply Chain Analysis
- 3.8.1 Raw Material/Input Supply Risk Assessment
- 3.8.2 Manufacturing Concentration Risk (Geographic Exposure)
- 3.8.3 Trade Disruption Impact Analysis
- 3.9 Regulatory & Policy Landscape
Note: The regulatory and policy landscape section covers regulations based on their applicability to the market, Connected Homes category, geography, and scope of the study. Only regulatory frameworks with a material impact on operations, compliance, trade, sustainability, or market access are analyzed in detail.
Chapter 4. Key Investment Pockets & Opportunity Analysis
- 4.1 Connected Homes Market Attractiveness Analysis
- 4.1.1 By Region – Investment Attractiveness Matrix (Volume × CAGR)
- 4.2 Absolute Revenue Growth Opportunity
- 4.2.1 By Region – Absolute USD Growth Through the forecast period
- 4.3 Incremental Volume Opportunity
- 4.3.1 By Region – Incremental Volume Through the forecast period
- 4.3.2 Segment – Incremental Volume
- 4.4 Emerging Submarket Opportunity Deep Dive (Subject to Applicability)
- 4.5 Emerging Market Opportunity Scorecards
- 4.5.1 United States
- 4.5.2 Europe
- 4.5.3 Asia
- 4.5.4 Middle East & Africa
Note: Emerging Market Opportunity Scorecards will be included based on relevance and strategic importance. Regions listed are indicative and may vary depending on data availability and market dynamics.
Chapter 5. Connected Homes Import-Export Analysis & Trade Flows
- 5.1 Global Trade Overview
- 5.1.1 Global Export Value by Country (the historical period)
- 5.1.2 Global Export Volume by Country (the historical period)
- 5.1.3 Global Import Value by Country (the historical period)
- 5.1.4 Global Import Volume by Country (the historical period)
- 5.1.5 Net Trade Balance by Country (the historical period)
- 5.2 Export Analysis – Segment
- 5.2.1 Type 1 (HS Code)
- 5.2.2 Type 2 (HS Code)
- 5.2.3 Type 3 (HS Code)
- 5.2.4 Type 4 (HS Code)
- 5.2.5 Type 5 (HS Code)
- 5.3 Import Analysis – Segment
- 5.3.1 Type 1 (HS Code)
- 5.3.2 Type 2 (HS Code)
- 5.3.3 Type 3 (HS Code)
- 5.3.4 Type 4 (HS Code)
- 5.3.5 Type 5 (HS Code)
- 5.4 Average Unit Trade Prices
- 5.4.1 Average Export Price – Segment & Country
- 5.4.2 Average Import Price – Segment & Source Country
- 5.4.3 Price Trends (the historical period)
- 5.5 Key Trade Route Analysis
- 5.5.1 Trade Route 1
- 5.5.2 Trade Route 2
- 5.5.3 Trade Route 3
- 5.5.4 Trade Route 4
- 5.5.5 Trade Route 5
- 5.6 Trade Policy Impact Assessment
- 5.6.1 US Anti-Dumping & Section 301 Tariffs
- 5.6.2 EU Customs Union Impact
- 5.6.3 Major Free Trade Agreements
- 5.6.4 USMCA Rules of Origin
Note: Trade policy analysis will be included only where relevant to the Connected Homes market.
Chapter 6. Competitive Landscape & Company Benchmarking
- 6.1 Connected Homes Market Concentration & Structure
- 6.1.1 Herfindahl-Hirschman Index (HHI) – vs.
- 6.1.2 Tier 1, Tier 2 & Tier 3 Market Structure
- 6.1.3 Global, Regional & Local Player Dynamics
- 6.2 Connected Homes Market Share Analysis –
- 6.2.1 Global Revenue Share by Company
- 6.2.2 Global Volume Share by Company
- 6.2.3 Regional Revenue Share
- 6.2.4 Market Share Evolution ( vs. )
- 6.2.5 OEM Segment Share by Company
- 6.2.6 Replacement Segment Share by Company
- 6.3 Production/Delivery Capacity & Facility Analysis
- 6.3.1 Global Installed Capacity
- 6.3.2 Capacity Utilization Rates
- 6.3.3 Production/Output Volume
- 6.3.4 Facility Locations & Capacity Map
- 6.3.5 Planned Capacity Additions
- 6.4 Connected Homes Competitive Benchmarking Matrix
- 6.4.1 Revenue, Volume, CAGR & Profitability Comparison
- 6.4.2 Channel Revenue Mix
- 6.4.3 Geographic Revenue Exposure
- 6.4.4 R&D Intensity
- 6.4.5 Sustainability Maturity
- 6.5 Strategic Developments in Connected Homes (Last 24 Months)
- 6.5.1 Mergers, Acquisitions & Divestments
- 6.5.2 New Connected Homes Launches
- 6.5.3 Facility Expansions
- 6.5.4 Strategic Alliances, Joint Ventures & Partnerships
- 6.5.5 Distribution Expansion & Market Entry
- 6.5.6 Sustainability & ESG Initiatives
- 6.6 Competitive Strategy Mapping
- 6.6.1 Leader, Challenger, Follower & Niche Classification
- 6.6.2 Pricing Strategy Comparison
- 6.6.3 Channel Strategy Matrix
Note: Strategic developments are included based on their materiality and the availability of reliable information.
Chapter 7. Global Connected Homes Market – By Distribution Channel
- 7.1 Segment Overview
- 7.1.1 Volume & Revenue Split by Channel ( & )
- 7.1.2 Channel Mix Evolution (the forecast period)
Chapter 8. Regional Market Analysis – Global Overview
- 8.1 Global Regional Overview
- 8.1.1 Regional Volume Share
- 8.1.2 Regional Revenue Share
- 8.1.3 Regional Volume by Region
- 8.1.4 Regional Revenue by Region
- 8.1.5 Regional Forecast Through the forecast period
- 8.2 Cross-Regional Segment Analysis
- 8.2.1 By Distribution Channel
- 8.2.2 By Brand/Price Tier
Chapter 9. North America Connected Homes Market
- 9.1 United States
- 9.2 Canada
- 9.3 Mexico
Chapter 10. Europe Connected Homes Market
- 10.1 Germany
- 10.2 France
- 10.3 Italy
- 10.4 United Kingdom
- 10.5 Spain
- 10.6 Poland
- 10.7 Russia
- 10.8 Netherlands
- 10.9 Belgium
- 10.10 Sweden
- 10.11 Denmark
- 10.12 Norway
- 10.13 Rest of Europe
Chapter 11. Asia Pacific Connected Homes Market
- 11.1 China
- 11.2 India
- 11.3 Japan
- 11.4 South Korea
- 11.5 Thailand
- 11.6 Indonesia
- 11.7 Vietnam
- 11.8 Malaysia
- 11.9 Australia
- 11.10 Rest of Asia Pacific
Chapter 12. Latin America Connected Homes Market
- 12.1 Brazil
- 12.2 Argentina
- 12.3 Colombia
- 12.4 Chile
- 12.5 Rest of Latin America
Chapter 13. Middle East Connected Homes Market
- 13.1 Saudi Arabia
- 13.2 United Arab Emirates
- 13.3 Turkey
- 13.4 Israel
- 13.5 Iran
- 13.6 Rest of the Middle East
Chapter 14. Africa Connected Homes Market
- 14.1 South Africa
- 14.2 Egypt
- 14.3 Nigeria
- 14.4 Morocco
- 14.5 Rest of Africa
Chapter 15. Connected Homes Company Profiles
- 15.1 [Company 01]
- 15.1.1 Company Overview
- 15.1.2 Key Management Personnel
- 15.1.3 Products & Services Portfolio
- 15.1.4 Financial Performance
- 15.1.5 Key Market Focus & Geographic Presence
- 15.1.6 Recent Developments & Strategic Initiatives
Note: The company profile list is preliminary and may change based on research findings, market developments, data availability, and client requirements.
Chapter 16. Appendices
- Appendix A – List of Abbreviations & Acronyms
- Appendix B – Industry Classification Code Reference – Full Series
- Appendix C – Production & Capacity Data Tables
- Appendix D – End-Use & Demand Base Tables
- Appendix E – Consumption & Replacement Rate Assumptions
- Appendix F – ASP Reference Tables
- Appendix G – Manufacturing & Facility Database
- Appendix H – Import-Export Data Tables
- Appendix I – Regulatory Summary Tables
- Appendix J – Primary Research Participant List (Anonymized)
- Appendix K – Primary Research Questionnaire Framework
- Appendix L – Data Sources & Bibliography
- Appendix M – Market Size Divergence & Source Comparison
Chapter 17. Research Methodology
- 17.1 Research Framework & Philosophy
- 17.2 Secondary Research – Sources, Hierarchy & Data Extraction
- 17.3 Data Modeling – Bottom-Up & Top-Down Market Sizing
- 17.4 Primary Research – Stakeholder Framework, LOI & Sample Sizes
- 17.5 Forecast Methodology – Regression, Scenario & Sensitivity Analysis
- 17.6 Quality Control – Four-Layer Validation Framework
- 17.7 Limitations & Standard Assumptions
- 17.8 Disclaimer
