
| REPORT ATTRIBUTE | DETAILS |
|---|---|
| Historical Period | 2019-2022 |
| Base Year | 2023 |
| Forecast Period | 2024-2032 |
| Cost Reduction Services Market Size 2024 | USD 106.4 million |
| Cost Reduction Services Market, CAGR | 10.6% |
| Cost Reduction Services Market Size 2032 | USD 238.22 million |
Market Overview:
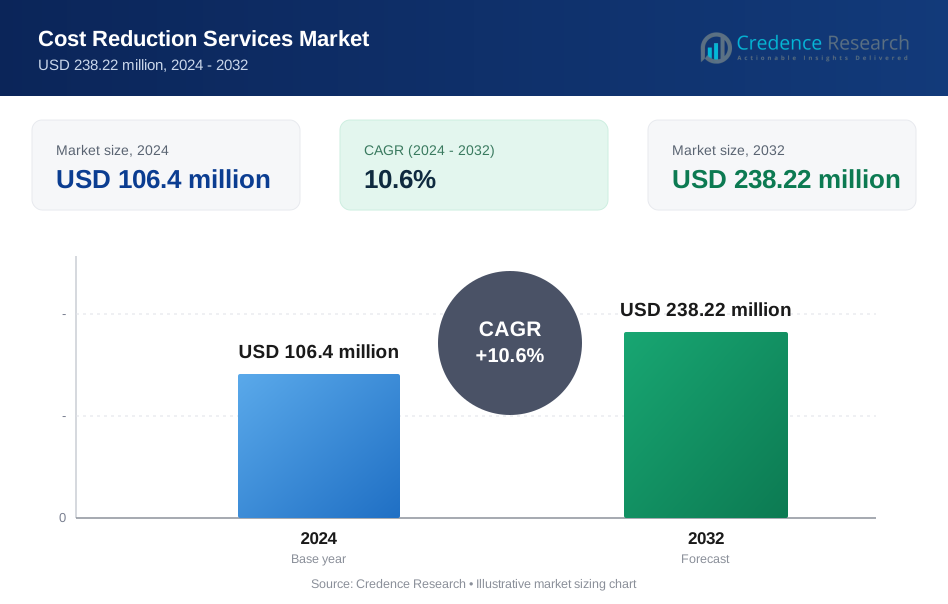
The Cost Reduction Services Market is projected to grow from USD 106.4 million in 2024 to an estimated USD 238.22 million by 2032, with a compound annual growth rate (CAGR) of 10.6% from 2024 to 2032.
Several factors are driving the growth of the cost reduction services market. Rising operational costs, competitive pressures, and the need for improved profitability are prompting companies to seek external expertise in cost optimization. Cost reduction services help businesses identify inefficiencies, reduce waste, and implement strategic cost-cutting measures without compromising on quality or customer satisfaction. The increasing complexity of supply chains, fluctuating raw material costs, and the need for regulatory compliance also contribute to the growing demand for these services. Furthermore, digital transformation and the integration of advanced technologies, such as automation and artificial intelligence, are enhancing the ability of service providers to deliver customized and effective cost management solutions. As organizations across sectors, including manufacturing, healthcare, retail, and IT, focus on sustainable growth, cost reduction services have become an integral part of long-term business strategies.
North America holds a significant share of the global cost reduction services market, driven by the presence of large corporations and a mature business environment that emphasizes operational efficiency. The U.S. leads the region with high adoption of cost reduction strategies, particularly in the manufacturing, healthcare, and technology sectors. Europe follows closely, with industries across the region increasingly turning to cost reduction services to navigate economic challenges and regulatory pressures. The Asia Pacific region is expected to witness the highest growth during the forecast period, fueled by rapid industrialization, rising operational costs, and a growing focus on improving productivity in emerging economies like China and India. In Latin America and the Middle East & Africa, improving economic conditions and expanding industries are also contributing to the rising demand for cost reduction services, though at a more moderate pace compared to other regions.
Market Drivers:
Rising Operational Costs and Profit Margin Pressures:
One of the primary drivers of the cost reduction services market is the rising operational costs that businesses across industries face. With increasing expenses related to labor, raw materials, and logistics, companies are under constant pressure to maintain profitability. For instance, companies like Kramer have substantially reduced operational costs by capitalizing on a stabilized supply chain and improved operational efficiency. According to a survey, more than half of companies have cut up to 10 percent of overall costs, nearly one-third have reduced costs by 11 percent to 20 percent, and 9 percent of executives report cutbacks of 20 percent or more. Cost reduction services provide organizations with the expertise to identify and eliminate inefficiencies, optimize processes, and reduce unnecessary expenses. In sectors like manufacturing, healthcare, and retail, where operational costs are a significant portion of overall spending, businesses are seeking external support to streamline operations and improve cost management. These services help businesses sustain profit margins while remaining competitive in the market
Increased Adoption of Digital Transformation and Automation:
The growing trend of digital transformation is another major driver in the cost reduction services market. Companies are increasingly integrating advanced technologies, such as automation, artificial intelligence (AI), and data analytics, into their operations to improve efficiency and reduce costs. Cost reduction services are evolving to incorporate these technologies, allowing service providers to offer more comprehensive and technology-driven solutions. Automation, in particular, has gained prominence as businesses seek to automate repetitive tasks, reduce manual labor, and improve overall productivity. With the rise of Industry 4.0, businesses are recognizing the potential of digital tools to optimize workflows and achieve significant cost savings, driving the demand for cost reduction services.
Globalization and Complex Supply Chains:
The globalization of businesses and the complexity of modern supply chains are also key factors contributing to the growth of the cost reduction services market. As companies expand their operations across borders, managing costs in multiple regions becomes increasingly challenging. Factors such as currency fluctuations, trade tariffs, and varying regulatory standards add layers of complexity to cost management. Cost reduction services provide businesses with the expertise to navigate these complexities by identifying areas where cost efficiencies can be gained across global operations. Additionally, the need for agile and resilient supply chains, particularly in the face of global disruptions like the COVID-19 pandemic, has prompted businesses to seek cost reduction strategies to remain competitive.
Regulatory Compliance and Sustainability Initiatives:
Another important driver for the cost reduction services market is the growing emphasis on regulatory compliance and sustainability. Governments and regulatory bodies worldwide are imposing stricter environmental and operational standards, requiring businesses to adopt sustainable practices and reduce their carbon footprint. For instance, the Corporate Sustainability Reporting Directive (CSRD) has broadened its scope to all large companies and listed small and medium-sized enterprises (SMEs), impacting around 50,000 companies. Cost reduction services help businesses comply with these regulations by identifying areas where sustainable practices can lead to cost savings. Whether it’s through energy efficiency improvements, waste reduction, or optimized resource management, cost reduction services enable companies to meet regulatory requirements while simultaneously reducing operational expenses. As sustainability continues to be a priority for businesses, particularly in industries like manufacturing and energy, the demand for cost reduction services that align with these goals is expected to grow further.
Market Trends:
Growing Integration of Artificial Intelligence and Data Analytics:
One of the most significant trends in the cost reduction services market is the growing integration of artificial intelligence (AI) and data analytics. As businesses increasingly adopt digital transformation strategies, the use of AI and analytics tools has become crucial in identifying cost-saving opportunities. These technologies allow cost reduction service providers to analyze large volumes of data, uncover inefficiencies, and recommend actionable strategies for reducing expenses. AI-driven solutions can automate routine tasks, optimize workflows, and predict potential cost drivers, enabling businesses to make informed decisions in real-time. The ability to use data to forecast trends and identify cost risks is becoming an integral part of cost management strategies, especially in complex industries like manufacturing, logistics, and healthcare.
Increased Focus on Outsourcing and Specialized Expertise:
Another emerging trend in the cost reduction services market is the increased focus on outsourcing. Many companies are turning to external service providers to access specialized expertise that may not be available in-house. Outsourcing allows businesses to leverage industry knowledge, technology, and best practices from cost reduction experts to achieve significant savings. This trend is particularly prominent in sectors like IT, healthcare, and finance, where regulatory requirements and technological complexity demand specialized knowledge. By partnering with cost reduction service providers, businesses can benefit from tailored strategies that address their unique operational challenges while freeing up internal resources to focus on core business activities. The rise in outsourcing reflects a broader trend of companies seeking to optimize operations through external collaboration.
Sustainability and Energy Efficiency Initiatives:
Sustainability is becoming a key driver of cost reduction efforts, as businesses increasingly prioritize energy efficiency and environmentally friendly practices. The shift towards greener operations is driven not only by regulatory requirements but also by growing consumer demand for sustainable products and services. Cost reduction services are evolving to help companies achieve their sustainability goals while simultaneously reducing operational costs. For instance, companies like Royal Philips, IKEA, Unilever, and ZF are working to reduce emissions in their supply chains. A report by the U.S. Department of Energy found that energy efficiency programs in large industrial companies can reduce total industrial energy consumption by $2 million to $10 million annually. These efforts not only help businesses save on energy costs but also enhance their reputation as environmentally responsible companies. As sustainability becomes a strategic priority across industries, the role of cost reduction services in driving energy efficiency and resource optimization will continue to grow.
Adoption of Cloud-Based Solutions and Remote Services:
The adoption of cloud-based solutions and remote services is another significant trend in the cost reduction services market. With the growing reliance on digital tools and remote working environments, businesses are increasingly adopting cloud technologies to manage operations, streamline processes, and reduce infrastructure costs. Cloud-based solutions offer scalability, flexibility, and real-time access to data, allowing companies to efficiently manage their cost reduction initiatives from anywhere. For example, Capital One runs its mobile app on AWS, and GE Oil & Gas is migrating most of its computing and storage capacity to the public cloud. According to G2, enterprises have saved between $500,000 and $2 million annually from cloud adoption. Moreover, remote services have gained prominence in the wake of the COVID-19 pandemic, as businesses have had to adapt to decentralized operations. Cost reduction service providers are leveraging cloud-based platforms to offer remote consultations, audits, and strategy implementations, enabling companies to continue optimizing their costs even in a distributed work environment. This trend is expected to drive the demand for cost reduction services that offer digital solutions and remote capabilities.
Market Restraints and Challenges:
High Implementation Costs and Resistance to Change:
One of the key restraints in the cost reduction services market is the high initial implementation cost, particularly for small and medium-sized enterprises (SMEs). Implementing cost reduction strategies often requires investments in new technologies, process overhauls, and external consultancy fees. These costs can be prohibitive for businesses with limited budgets, causing hesitation in adopting comprehensive cost management programs. Moreover, the long-term benefits of cost reduction services are not always immediately visible, making it difficult for companies to justify the upfront expenses. Additionally, resistance to change within organizations can be a significant barrier. Employees and management may be reluctant to alter established processes or adopt new technologies, which can slow down or prevent the effective implementation of cost reduction initiatives.
Limited Internal Expertise and Data Integration Challenges:
Another challenge in the cost reduction services market is the limited internal expertise and the difficulty of integrating new cost-saving measures with existing business processes. Many companies lack the in-house expertise needed to assess and implement complex cost reduction strategies effectively. This often leads to a heavy reliance on external service providers, which, while beneficial, can create dependency and limit the organization’s ability to sustain cost savings in the long term. Furthermore, integrating cost reduction measures, particularly those involving advanced technologies like AI and data analytics, requires seamless integration with existing systems. In many cases, legacy systems are not easily adaptable to new technologies, creating technical hurdles that complicate the process.
Balancing Short-Term Gains with Long-Term Sustainability:
A major challenge in the cost reduction services market is balancing the desire for short-term financial gains with the need for long-term sustainability. While many businesses focus on cutting costs quickly to improve profit margins, these measures can sometimes result in unintended consequences, such as reduced product quality or employee dissatisfaction. Cost reduction strategies that focus solely on immediate savings, without considering the long-term impact on business operations, can lead to inefficiencies or even increased costs in the future. Service providers must address this challenge by offering solutions that balance immediate cost savings with sustainable, long-term improvements to operational efficiency.
Market Segmentation Analysis:
By Service type, the market includes strategic sourcing and procurement optimization, process efficiency and optimization, technology and IT cost optimization, energy and resource management, and outsourcing and vendor management. Among these, strategic sourcing and procurement optimization is widely adopted as companies focus on optimizing their supply chains and reducing operational costs.
By Industry vertical, the market serves sectors such as healthcare, manufacturing, retail and consumer goods, financial services, information technology, energy and utilities, and government and public sector. The healthcare and manufacturing sectors represent significant demand due to the need for cost efficiency in supply chains, energy use, and resource allocation.
By Enterprise size, both small and medium-sized enterprises (SMEs) and large enterprises seek cost reduction services. Large enterprises typically have more complex operational structures requiring customized solutions, while SMEs look for more scalable and affordable cost optimization services.
By Deployment model, the market offers both on-premises and cloud-based solutions. Cloud-based solutions are becoming more popular due to their flexibility, scalability, and lower upfront costs, making them attractive for SMEs.
By End user, the market serves both the private and public sectors. The private sector drives most of the demand, while the public sector is increasingly turning to cost reduction services to manage resources efficiently and streamline operations.
Segmentation:
By Service Type
- Strategic Sourcing and Procurement Optimization
- Process Efficiency and Optimization
- Technology and IT Cost Optimization
- Energy and Resource Management
- Outsourcing and Vendor Management
By Industry Vertical
- Healthcare
- Manufacturing
- Retail and Consumer Goods
- Financial Services
- Information Technology
- Energy and Utilities
- Government and Public Sector
By Enterprise Size
- Small and Medium-sized Enterprises (SMEs)
- Large Enterprises
By Deployment Model
- On-Premises
- Cloud-based
By End User
- Private Sector
- Public Sector
- North America
- U.S.
- Canada
- Mexico
- Europe
- Germany
- France
- U.K.
- Italy
- Spain
- Rest of Europe
- Asia Pacific
- China
- Japan
- India
- South Korea
- South-east Asia
- Rest of Asia Pacific
- Latin America
- Brazil
- Argentina
- Rest of Latin America
- Middle East & Africa
- GCC Countries
- South Africa
- Rest of the Middle East and Africa
Regional Analysis:
North America
North America holds a dominant share in the global cost reduction services market, accounting for approximately 35% of the market in 2023. The high adoption rate of advanced cost management strategies in industries such as manufacturing, healthcare, and technology is a major growth driver in the region. The presence of numerous large enterprises, especially in the U.S. and Canada, has accelerated demand for strategic cost reduction solutions, particularly in areas like procurement optimization and IT cost management. Additionally, North American companies are increasingly outsourcing non-core business activities to reduce operational costs, further driving the market. Regulatory pressures, combined with rising operational costs, have made cost reduction a priority across many sectors, ensuring continued demand for these services in the region.
Europe
Europe represents around 30% of the global cost reduction services market. The region’s mature business environment, coupled with stringent regulatory requirements, has increased the need for efficient cost management. Key industries such as energy, manufacturing, and financial services are the primary adopters of cost reduction services, particularly in countries like Germany, the UK, and France. European companies are focusing on energy and resource management to meet sustainability goals while reducing costs, a trend that is driving the growth of this service segment. Furthermore, the region’s highly competitive market landscape has compelled companies to seek external expertise in process efficiency and optimization to remain competitive. Outsourcing and vendor management services are also gaining traction as companies look for ways to streamline operations and reduce expenditures.
Asia Pacific
The Asia Pacific region is expected to witness the highest growth in the cost reduction services market, with a projected market share of 25% by 2030. Rapid industrialization, rising labor costs, and growing operational complexities in countries like China, India, and Japan are driving demand for cost optimization services. Companies in the region are increasingly adopting technology and IT cost optimization services to streamline processes and improve profitability. Additionally, as global supply chains become more complex, Asia Pacific companies are focusing on strategic sourcing and procurement optimization to remain competitive. The growing awareness of sustainability and energy efficiency is also contributing to the rise in demand for energy and resource management services in the region.
Latin America and Middle East & Africa
Latin America and the Middle East & Africa together account for around 10% of the global cost reduction services market. While these regions are still developing in terms of market maturity, the demand for cost optimization services is growing as companies seek to navigate economic challenges and improve efficiency. In Latin America, industries such as retail, manufacturing, and energy are driving demand for process optimization and resource management services. Meanwhile, in the Middle East & Africa, the focus on infrastructure development and increasing operational efficiency in sectors like energy and public services is fueling the growth of cost reduction services. As businesses in these regions continue to expand, the market is expected to see steady growth.
Key Player Analysis:
- T. Kearney
- Accenture
- Alvarez & Marsal
- Ayming
- Bain & Company
- Boston Consulting Group (BCG)
- Deloitte Consulting LLP
- Ernst & Young (EY)
- Expense Reduction Analysts
- GEP
- KPMG
- McKinsey & Company
- Oliver Wyman
- PricewaterhouseCoopers (PwC)
- Protiviti
Competitive Analysis:
The cost reduction services market is highly competitive, with several key players offering specialized solutions across various industries. Major companies such as Accenture, Deloitte, Ernst & Young, and KPMG dominate the market due to their extensive global presence and expertise in strategic consulting, procurement optimization, and process efficiency. These firms leverage advanced technologies, such as artificial intelligence and data analytics, to provide customized cost-saving strategies tailored to client needs. Additionally, niche players and regional firms are gaining traction by focusing on specific service segments, such as energy and resource management or IT cost optimization, which allows them to cater to industry-specific challenges. The market’s competitive landscape is further intensified by the rise of technology-driven startups offering cloud-based cost management solutions, appealing to small and medium-sized enterprises (SMEs). Strategic partnerships, mergers, and acquisitions are common as companies seek to expand their service offerings and market reach in an increasingly competitive environment.
Recent Developments:
- In 2022, Accenture, an Irish-American professional services company based in Dublin and specializing in information technology services and consulting, launched its "cost reduction as a service" offering. This service provides organizations with a comprehensive suite of cost reduction solutions, including process improvement, procurement, and outsourcing strategies.
- Similarly, IBM (International Business Machines Corporation), an American multinational technology company headquartered in Armonk and nicknamed Big Blue, introduced its "cost reduction accelerator" offering in 2022. This solution enables organizations to quickly and efficiently identify and implement cost reduction opportunities, enhancing overall efficiency.
- In the same year, Capgemini SE, a French multinational IT services and consulting company headquartered in Paris, launched its "cost reduction excellence" offering. This service takes a holistic approach to cost reduction, covering all aspects of an organization, from strategic planning to operational execution, ensuring sustainable savings and improved business performance.
Market Concentration & Characteristics:
The cost reduction services market is moderately concentrated, with a few global consulting giants like Accenture, Deloitte, and KPMG commanding a significant market share. These established players benefit from their broad service portfolios, extensive client networks, and advanced technological capabilities, which position them as leaders in delivering comprehensive cost management solutions across multiple industries. While these major firms dominate, the market also features a growing number of niche players and specialized providers focusing on specific areas such as procurement, IT cost optimization, and energy management. These smaller firms often cater to industry-specific needs or small and medium-sized enterprises (SMEs), offering tailored, agile solutions. The market is characterized by a high level of innovation, with service providers increasingly integrating advanced technologies like artificial intelligence (AI), automation, and data analytics to enhance their offerings. As companies prioritize cost efficiency, the demand for both broad and specialized cost reduction services is expected to grow.
Report Coverage:
The research report offers an in-depth analysis based on By Service Type, By Industry Vertical, By Enterprise Size, By Deployment Model and By End User. It details leading market players, providing an overview of their business, product offerings, investments, revenue streams, and key applications. Additionally, the report includes insights into the competitive environment, SWOT analysis, current market trends, as well as the primary drivers and constraints. Furthermore, it discusses various factors that have driven market expansion in recent years. The report also explores market dynamics, regulatory scenarios, and technological advancements that are shaping the industry. It assesses the impact of external factors and global economic changes on market growth. Lastly, it provides strategic recommendations for new entrants and established companies to navigate the complexities of the market.
Future Outlook:
- The cost reduction services market is expected to see strong growth as companies continue to prioritize operational efficiency in the face of economic uncertainty.
- Increased adoption of digital technologies such as AI, automation, and data analytics will drive demand for tech-enabled cost reduction solutions.
- Strategic sourcing and procurement optimization will remain crucial as businesses focus on optimizing supply chains amid global disruptions.
- The rise in energy costs and sustainability initiatives will propel growth in energy and resource management services.
- Small and medium-sized enterprises (SMEs) will increasingly seek cost reduction services as cloud-based and scalable solutions become more accessible.
- The Asia Pacific region will experience the fastest market growth, driven by industrial expansion and rising operational costs.
- Outsourcing of non-core functions will continue to expand as businesses look for specialized expertise in cost optimization.
- Sustainability and regulatory compliance will become central to cost reduction strategies, particularly in Europe and North America.
- The healthcare, manufacturing, and IT sectors will lead demand for process efficiency and IT cost optimization services.
- Mergers and acquisitions in the sector will rise as firms aim to broaden their service portfolios and enhance technological capabilities.
Request a Free Sample
Fill in your details and we'll send you a free sample report.
- Sample data tables & charts
- Research methodology
Need a Custom Version of This Report?
Tailor the scope, geography, or segments to your exact requirements.
- Custom geography or segment scope
- Direct access to our analyst team
Frequently Asked Questions
What is the projected market growth for cost reduction services by 2032?
What factors are driving the growth of the cost reduction services market?
Which regions dominate the cost reduction services market?
What challenges does the cost reduction services market face?
Table of Content
Chapter 1. Report Introduction
- 1.1 Report Description & Purpose
- 1.1.1 Report Title & Market Definition
- 1.1.2 Unique Selling Propositions (USP) & Key Differentiators
- 1.1.3 Value Proposition for Stakeholders
- 1.2 Research Objectives
- 1.2.1 Market Sizing Objectives (Volume & Revenue) (Volume Where Applicable)
- 1.2.2 Segmentation Objectives
- 1.2.3 Competitive Intelligence Objectives
- 1.2.4 Forecast & Scenario Objectives
- 1.3 Report Scope
- 1.3.1 Cost Reduction Services Scope – Segments & Subsegments Covered
- 1.3.2 Geographic Scope – Regions & Countries Covered
- 1.3.3 Historical Period, Base Year & Forecast Period (2024; forecast to 2032)
- 1.3.4 Inclusions & Exclusions
- 1.4 Industry Classification & Applicable Codes
- 1.5 Currency, Measurement Units & Valuation Basis
- 1.6 Target Stakeholders
- 1.7 Limitations & Assumptions
Chapter 2. Executive Summary
- 2.1 Global Cost Reduction Services Market Snapshot
- 2.1.1 Market Size – Historical (2024) & Forecast (2024-2032) (2024: USD 106.4 million → 2032: USD 238.22 million)
- 2.1.2 Volume & Revenue – Global Totals (Volume Where Applicable)
- 2.1.3 Key Market Highlights – Top Five Facts
- 2.2 Cost Reduction Services Market Segmentation Snapshot
- 2.2.1 Market Split by Region – 2024 vs. 2032
- 2.3 Competitive Snapshot
- 2.3.1 Top 10 Players by Revenue Share – 2024
- 2.3.2 Top 10 Players by Volume Share – 2024 (Volume Where Applicable)
- 2.3.3 Recent Strategic Developments (18-Month Summary)
- 2.4 Key Investment Highlights & Strategic Conclusions
Chapter 3. Cost Reduction Services Market Dynamics & Industry Analysis
- 3.1 Market Overview & Context
- 3.1.1 Cost Reduction Services Market Position in the Broader Industry Value Chain
- 3.1.2 Demand Structure & Purchasing Dynamics
- 3.1.3 Market Maturity & Development Stage by Region
- 3.2 Cost Reduction Services Market Drivers
- 3.3 Cost Reduction Services Market Restraints & Challenges
- 3.4 Cost Reduction Services Market Opportunities
- 3.5 Porter's Five Forces Analysis
- 3.5.1 Threat of New Entrants
- 3.5.2 Bargaining Power of Suppliers
- 3.5.3 Bargaining Power of Buyers
- 3.5.4 Threat of Substitutes
- 3.5.5 Competitive Rivalry – Intensity Assessment
- 3.6 Cost Reduction Services Value Chain Analysis
- 3.6.1 Upstream – Key Inputs, Resources & Suppliers
- 3.6.1.1 Key Input/Resource 1
- 3.6.1.2 Key Input/Resource 2
- 3.6.1.3 Key Input/Resource 3
- 3.6.2 Midstream – Core Operations & Value Creation
- 3.6.2.1 Operating Model & Process Overview
- 3.6.2.2 Key Operating Locations & Capabilities by Company
- 3.6.3 Downstream – Market Channels & End Users
- 3.6.3.1 Direct Sales & Customer Engagement Channels
- 3.6.3.2 Indirect Sales, Intermediaries & Partner Channels
- 3.6.4 Value Chain Profitability Analysis
- 3.6.1 Upstream – Key Inputs, Resources & Suppliers
- 3.7 PESTEL Analysis
- 3.7.1 Political Factors
- 3.7.2 Economic Factors
- 3.7.3 Social Factors
- 3.7.4 Technological Factors
- 3.7.5 Environmental Factors
- 3.7.6 Legal Factors
- 3.8 Cost Reduction Services Supply Chain Analysis
- 3.8.1 Critical Input & Resource Availability Risk Assessment
- 3.8.2 Supplier & Operational Concentration Risk (Geographic Exposure)
- 3.8.3 Supply & Service Disruption Impact Analysis
- 3.9 Regulatory & Policy Landscape
Note: The regulatory and policy landscape section covers regulations based on their applicability to the market, Cost Reduction Services category, geography, and scope of the study. Only regulatory frameworks with a material impact on operations, compliance, trade, sustainability, or market access are analyzed in detail.
Chapter 4. Key Investment Pockets & Opportunity Analysis
- 4.1 Cost Reduction Services Market Attractiveness Analysis
- 4.1.1 By Region – Investment Attractiveness Matrix (Market Size × CAGR)
- 4.2 Absolute Revenue Growth Opportunity
- 4.2.1 By Region – Absolute Revenue Growth Through 2032
- 4.3 Incremental Demand Opportunity
- 4.3.1 By Region – Incremental Demand Through 2032
- 4.3.2 Segment – Incremental Demand
- 4.4 Emerging Submarket Opportunity Deep Dive (Subject to Applicability)
- 4.5 Priority Market Opportunity Scorecards
- 4.5.1 United States
- 4.5.2 Europe
- 4.5.3 Asia
- 4.5.4 Middle East & Africa
Note: Priority market opportunity scorecards reflect the geographic scope and strategic relevance of the study. Listed markets are indicative and may be adapted to the industry.
Chapter 5. Cost Reduction Services Cross-Border Trade & Market Access Analysis
- 5.1 International Trade & Cross-Border Activity Overview
- 5.1.1 Global Export Value by Country (2024)
- 5.1.2 Global Export Volume by Country (2024) (Volume Where Applicable)
- 5.1.3 Global Import Value by Country (2024)
- 5.1.4 Global Import Volume by Country (2024) (Volume Where Applicable)
- 5.1.5 Net Trade Balance by Country (2024)
- 5.2 Export Analysis – Segment
- 5.2.1 Category 1 (Applicable Classification Code)
- 5.2.2 Category 2 (Applicable Classification Code)
- 5.2.3 Category 3 (Applicable Classification Code)
- 5.2.4 Category 4 (Applicable Classification Code)
- 5.2.5 Category 5 (Applicable Classification Code)
- 5.3 Import Analysis – Segment
- 5.3.1 Category 1 (Applicable Classification Code)
- 5.3.2 Category 2 (Applicable Classification Code)
- 5.3.3 Category 3 (Applicable Classification Code)
- 5.3.4 Category 4 (Applicable Classification Code)
- 5.3.5 Category 5 (Applicable Classification Code)
- 5.4 Cross-Border Pricing & Transaction Benchmarks
- 5.4.1 Export Pricing – Segment & Country
- 5.4.2 Import Pricing – Segment & Source Country
- 5.4.3 Price Trends (2024)
- 5.5 Key Cross-Border Trade & Delivery Routes
- 5.5.1 Cross-Border Trade/Delivery Route 1
- 5.5.2 Cross-Border Trade/Delivery Route 2
- 5.5.3 Cross-Border Trade/Delivery Route 3
- 5.5.4 Cross-Border Trade/Delivery Route 4
- 5.5.5 Cross-Border Trade/Delivery Route 5
- 5.6 Trade Policy & Market Access Impact Assessment
- 5.6.1 Tariff & Non-Tariff Barriers
- 5.6.2 Regional Trade & Economic Integration Frameworks
- 5.6.3 Bilateral & Multilateral Trade Agreements
- 5.6.4 Cross-Border Operating, Licensing & Localization Requirements
Note: This chapter applies where cross-border trade or delivery is relevant to Cost Reduction Services. Goods, services, and digital offerings are assessed using applicable classifications and transaction measures. Import-export volumes, trade balances, and route analyses are included only where meaningful to the market.
Chapter 6. Competitive Landscape & Company Benchmarking
- 6.1 Cost Reduction Services Market Concentration & Structure
- 6.1.1 Herfindahl-Hirschman Index (HHI) – vs. 2024
- 6.1.2 Leading, Mid-Sized & Emerging Player Structure
- 6.1.3 Global, Regional & Local Player Dynamics
- 6.2 Cost Reduction Services Market Share Analysis – 2024
- 6.2.1 Global Revenue Share by Company
- 6.2.2 Global Volume Share by Company (Volume Where Applicable)
- 6.2.3 Regional Revenue Share
- 6.2.4 Market Share Evolution ( vs. 2024)
- 6.2.5 Company Market Share by Key Segment
- 6.2.6 Company Market Share by Customer Group
- 6.3 Operating Scale, Capacity & Infrastructure Analysis
- 6.3.1 Global Operating Scale & Supply Capacity
- 6.3.2 Resource Utilization & Operating Efficiency
- 6.3.3 Output, Service Delivery & Activity Metrics
- 6.3.4 Operating Footprint & Infrastructure Map
- 6.3.5 Planned Operational & Capacity Expansion
- 6.4 Cost Reduction Services Competitive Benchmarking Matrix
- 6.4.1 Revenue, Growth, Profitability & Operating Metric Comparison
- 6.4.2 Channel Revenue Mix
- 6.4.3 Geographic Revenue Exposure
- 6.4.4 R&D Intensity
- 6.4.5 Sustainability Maturity
- 6.5 Strategic Developments in Cost Reduction Services (Last 24 Months)
- 6.5.1 Mergers, Acquisitions & Divestments
- 6.5.2 New Products, Services & Solutions in Cost Reduction Services
- 6.5.3 Operational & Infrastructure Expansions
- 6.5.4 Strategic Alliances, Joint Ventures & Partnerships
- 6.5.5 Distribution Expansion & Market Entry
- 6.5.6 Sustainability & ESG Initiatives
- 6.6 Competitive Strategy Mapping
- 6.6.1 Leader, Challenger, Follower & Niche Classification
- 6.6.2 Pricing Strategy Comparison
- 6.6.3 Channel Strategy Matrix
Note: Strategic developments are included based on their materiality and the availability of reliable information.
Chapter 7. Global Cost Reduction Services Market – By Sales & Delivery Channel
- 7.1 Segment Overview
- 7.1.1 Volume & Revenue Split by Channel (2024 & 2032) (Volume Where Applicable)
- 7.1.2 Channel Mix Evolution (2024-2032)
Chapter 8. Regional Market Analysis – Global Overview
- 8.1 Global Regional Overview
- 8.1.1 Regional Volume Share (Volume Where Applicable)
- 8.1.2 Regional Revenue Share
- 8.1.3 Regional Volume by Region (Volume Where Applicable)
- 8.1.4 Regional Revenue by Region
- 8.1.5 Regional Forecast Through 2032
- 8.2 Cross-Regional Segment Analysis
- 8.2.1 By Sales & Delivery Channel
- 8.2.2 By Competitive Positioning & Price Tier
Chapter 9. North America Cost Reduction Services Market
- 9.1 United States
- 9.2 Canada
- 9.3 Mexico
Chapter 10. Europe Cost Reduction Services Market
- 10.1 Germany
- 10.2 France
- 10.3 Italy
- 10.4 United Kingdom
- 10.5 Spain
- 10.6 Poland
- 10.7 Russia
- 10.8 Netherlands
- 10.9 Belgium
- 10.10 Sweden
- 10.11 Denmark
- 10.12 Norway
- 10.13 Rest of Europe
Chapter 11. Asia Pacific Cost Reduction Services Market
- 11.1 China
- 11.2 India
- 11.3 Japan
- 11.4 South Korea
- 11.5 Thailand
- 11.6 Indonesia
- 11.7 Vietnam
- 11.8 Malaysia
- 11.9 Australia
- 11.10 Rest of Asia Pacific
Chapter 12. Latin America Cost Reduction Services Market
- 12.1 Brazil
- 12.2 Argentina
- 12.3 Colombia
- 12.4 Chile
- 12.5 Rest of Latin America
Chapter 13. Middle East Cost Reduction Services Market
- 13.1 Saudi Arabia
- 13.2 United Arab Emirates
- 13.3 Turkey
- 13.4 Israel
- 13.5 Iran
- 13.6 Rest of the Middle East
Chapter 14. Africa Cost Reduction Services Market
- 14.1 South Africa
- 14.2 Egypt
- 14.3 Nigeria
- 14.4 Morocco
- 14.5 Rest of Africa
Chapter 15. Cost Reduction Services Company Profiles
- 15.1 [Company 01]
- 15.1.1 Company Overview
- 15.1.2 Key Management Personnel
- 15.1.3 Products & Services Portfolio
- 15.1.4 Financial Performance
- 15.1.5 Key Market Focus & Geographic Presence
- 15.1.6 Recent Developments & Strategic Initiatives
Note: The company profile list is preliminary and may change based on research findings, market developments, data availability, and client requirements.
Chapter 16. Appendices
- Appendix A – List of Abbreviations & Acronyms
- Appendix B – Industry Classification Code Reference – Full Series
- Appendix C – Supply, Output & Operating Capacity Data Tables
- Appendix D – End-Use & Demand Base Tables
- Appendix E – Demand, Adoption & Usage Assumptions
- Appendix F – Pricing & Revenue Metric Reference Tables
- Appendix G – Company Operations & Infrastructure Database
- Appendix H – Cross-Border Trade & Activity Data Tables (Where Applicable)
- Appendix I – Regulatory Summary Tables
- Appendix J – Primary Research Participant List (Anonymized)
- Appendix K – Primary Research Questionnaire Framework
- Appendix L – Data Sources & Bibliography
- Appendix M – Market Size Divergence & Source Comparison
Chapter 17. Research Methodology
- 17.1 Research Framework & Philosophy
- 17.2 Secondary Research – Sources, Hierarchy & Data Extraction
- 17.3 Data Modeling – Bottom-Up & Top-Down Market Sizing
- 17.4 Primary Research – Stakeholder Framework, LOI & Sample Sizes
- 17.5 Forecast Methodology – Regression, Scenario & Sensitivity Analysis
- 17.6 Quality Control – Four-Layer Validation Framework
- 17.7 Limitations & Standard Assumptions
- 17.8 Disclaimer
