
Market Overview
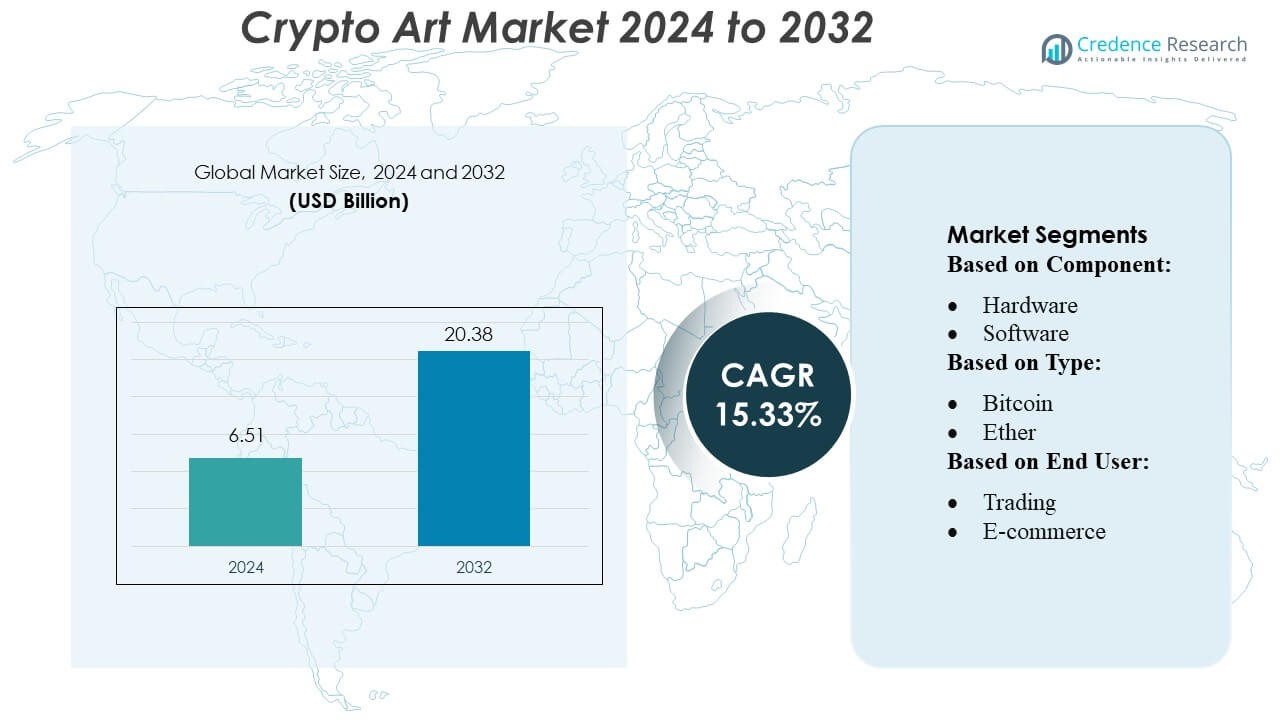
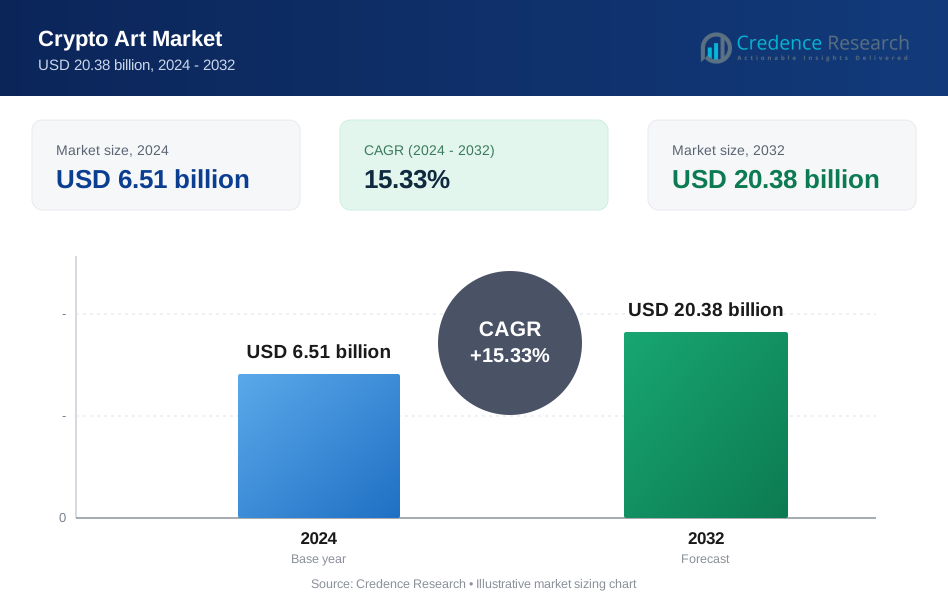
Crypto Art Market size was valued USD 6.51 billion in 2024 and is anticipated to reach USD 20.38 billion by 2032, at a CAGR of 15.33% during the forecast period.
| REPORT ATTRIBUTE | DETAILS |
|---|---|
| Historical Period | 2020-2023 |
| Base Year | 2024 |
| Forecast Period | 2025-2032 |
| Crypto Art Market Size 2024 | USD 6.51 Billion |
| Crypto Art Market, CAGR | 15.33% |
| Crypto Art Market Size 2032 | USD 20.38 Billion |
The Crypto Art Market centers on a handful of high-profile NFT platforms, including OpenSea, Rarible, SuperRare, Foundation, and Nifty Gateway, which drive most of the trading volume and artist activity. These platforms continuously innovate by enhancing smart contract functionality, improving royalty enforcement, and enabling cross-chain minting. They also offer curated, community-driven gallery experiences, attracting both emerging digital artists and established creators. North America leads this market with a commanding 42 % share, thanks to its advanced blockchain infrastructure, strong investor base, and deep Web3 ecosystem.
Market Insights
- The Crypto Art Market was valued at USD 6.51 billion in 2024 and is projected to reach USD 20.38 billion by 2032, expanding at a CAGR of 15.33%, supported by growing adoption of blockchain-based digital ownership.
- Market growth is driven by rising creator participation, expanding NFT utilities, improved smart-contract automation, and strong activity across major platforms that collectively generate the majority share of global crypto art transactions.
- Key trends include rapid integration of AI-generated art, increasing metaverse exhibitions, and expanding cross-chain minting that enhances accessibility and boosts overall marketplace liquidity.
- Competitive intensity remains high as leading NFT platforms innovate around royalties, curation models, and security, while restraints include market volatility, regulatory uncertainty, and concerns around intellectual property protection.
- Regionally, North America leads with 42% share, followed by Europe and Asia-Pacific; platform-based NFT segments dominate the market with the largest contribution to global crypto art sales.
Market Segmentation Analysis:
By Component
In the crypto art market, the software segment holds the largest market share, driven by the high adoption of digital wallets, NFT marketplaces, and blockchain-based creative tools. Software dominates because artists and collectors rely heavily on platforms for minting, trading, and storing digital artworks, while hardware plays a supporting role mainly through secure devices like hardware wallets. The rapid integration of smart-contract automation and user-friendly marketplace interfaces continues to strengthen software’s lead as the primary enabler of crypto-art creation and transactions.
- For instance, BASF filed 1,159 patents, and 44.5% of them were focused on sustainability, demonstrating how its software-augmented R&D pipeline is delivering cutting-edge innovations.
By Type
Among crypto types used in the crypto art ecosystem, Ether (ETH) holds the dominant market share due to its central role in powering NFT transactions on the Ethereum blockchain. ETH leads because most NFT marketplaces, smart-contract systems, and digital art minting protocols operate natively on Ethereum. While other cryptocurrencies participate in broader digital payment ecosystems, they remain secondary in the art segment, as ETH’s liquidity, strong developer community, and established token standards sustain its position as the preferred currency in crypto-art trading.
- For instance, No-Burn’s Technical Data Sheet specifies that at a wet film thickness of 5 mils, it achieves a flame spread (FS) of 20 and smoke development (SD) of 85, per ASTM E84 / UL 723 testing.
By End-User
Within end-user applications, the trading segment accounts for the largest share of activity in the crypto art market, driven by high volumes on NFT marketplaces and frequent resale of digital artworks. Trading dominates because collectors actively engage in short- and long-term speculation, encouraged by marketplace auction formats and rapid price movements. Although e-commerce, peer-to-peer payments, and remittance uses are expanding gradually, they contribute smaller portions compared to trading’s strong influence on liquidity, valuation cycles, and market engagement in the crypto-art ecosystem.
Key Growth Drivers
Rising Adoption of Digital Ownership Through NFTs
The rapid adoption of blockchain-based non-fungible tokens (NFTs) continues to fuel demand for crypto art by providing verifiable ownership, rarity, and provenance. Creators benefit from transparent royalty structures, while buyers gain secure asset authentication. This shift enhances trust and expands participation from both digital artists and traditional collectors seeking diversification. Increased integration of NFT marketplaces with mainstream platforms and wallets further boosts accessibility, encouraging a broader demographic to invest in digital artworks and driving sustained market expansion.
- For instance, Axalta’s SEC filings highlight its innovation infrastructure: it employs roughly 1,300 scientists, engineers, and technical experts and holds around 750 active patents.
Expanding Creator Economy and Monetization Models
Crypto art offers new monetization avenues for creators through direct-to-consumer sales, fractional ownership, and programmable royalties. Artists gain global visibility without relying on intermediaries, reducing entry barriers and maximizing revenue potential. Smart contracts automate transactions and ensure secondary-market royalty payouts, strengthening long-term earning opportunities. As more designers, animators, and independent creators adopt blockchain-based distribution, the market experiences rising artwork supply and diversified formats, fostering consistent ecosystem growth driven by creator empowerment and evolving revenue models.
- For instance, Jotun’s SeaQuantum X200 antifouling coating achieved a verified average speed-loss of just 1.0% over a dock-to-dock period, per DNV testing, setting a new benchmark for hull performance.
Institutional Interest and Digital Asset Investment Growth
Growing institutional participation in digital assets significantly accelerates crypto art market development. Galleries, auction houses, and investment firms increasingly explore tokenized art as part of broader digital asset strategies. These entities support higher-value transactions, elevate market credibility, and attract affluent collectors. Additionally, integration with Web3 infrastructure, metaverse experiences, and virtual exhibitions broadens visibility. As institutions experiment with curation, storage solutions, and digital authentication, their involvement strengthens regulatory confidence and enhances the legitimacy of crypto art as an emerging asset class.
Key Trends & Opportunities
Expansion of Metaverse-Integrated Art Experiences
The rise of immersive metaverse environments presents a major opportunity for showcasing, trading, and experiencing crypto art in virtual spaces. Artists and collectors increasingly use 3D galleries, interactive exhibitions, and avatar-based events to enhance engagement. This shift supports new art forms such as generative, dynamic, and AI-driven works that evolve based on user interaction. Brands and cultural institutions also collaborate in metaverse venues, creating cross-industry opportunities. As virtual worlds scale, their demand for digital art assets expands, reinforcing long-term market potential.
- For instance, Hempel introduced HEET Dynamic, a software tool for intumescent-coating estimation on steel structural sections. According to Hempel, HEET Dynamic performs calculations up to 10× faster than traditional methods - all while delivering 100% estimation accuracy.
Growth of Generative and AI-Powered Art Formats
Advancements in AI and algorithmic creativity are reshaping digital art creation and attracting new collectors interested in data-driven aesthetics. Generative art platforms allow artists to produce unique, code-based works that emphasize randomness and computational design. This trend drives innovation and appeals to audiences seeking complex, evolving digital expressions. NFTs enable verification and scarcity for algorithmic outputs, stimulating higher valuation potential. As AI tools become mainstream, more creators experiment with hybrid art forms, generating opportunities for marketplace differentiation and expanded buyer appeal.
- For instance, Sherwin-Williams employs over 2,000 R&D personnel globally, with more than 2,100 active patents maintained across its operations.
Emergence of Fractionalized and Community-Owned Art
Fractional ownership models continue gaining traction, allowing collectors to co-own high-value digital artworks at lower entry costs. This structure expands market participation, supports liquidity, and democratizes access to premium pieces. Decentralized autonomous organizations (DAOs) use token-based governance to collectively acquire, curate, and manage crypto art portfolios, fostering engaged communities. The approach enhances both price discovery and cultural relevance. As regulatory clarity improves, fractionalized models present significant growth potential by merging financial accessibility with collaborative digital ownership.
Key Challenges
Market Volatility and Speculative Price Fluctuations
The crypto art market faces ongoing challenges due to high volatility in digital asset pricing and speculative trading dynamics. Fluctuations in cryptocurrency values influence artwork valuations, often creating uncertainty for both artists and investors. Rapid price surges followed by sharp corrections can discourage long-term participation and complicate financial planning for creators relying on NFT income. These volatility risks hinder institutional confidence and demand structured mechanisms to stabilize pricing, reduce speculative activity, and enhance market transparency.
Regulatory Uncertainty and Intellectual Property Risks
Unclear regulatory frameworks around digital assets, copyright enforcement, and NFT transactions pose major obstacles to crypto art adoption. Artists frequently encounter unauthorized minting or plagiarism, and cross-border laws complicate dispute resolution. Inconsistent tax policies further challenge collectors and creators navigating the legal landscape. Without standardized guidelines for digital ownership, provenance, and royalty compliance, stakeholders face operational and legal risks. Strengthening intellectual property protections, marketplace verification tools, and regulatory clarity remains essential for securing sustainable market growth.
Regional Analysis
North America
North America holds the largest share of the crypto art market, accounting for around 40–45%. The region benefits from strong blockchain adoption, high digital art awareness, and the presence of major NFT marketplaces. The United States leads growth with active participation from creators, collectors, and tech investors. Frequent collaborations between digital artists, brands, and galleries also support market expansion. With advanced infrastructure and increasing institutional interest, North America continues to attract high-value crypto art transactions and remains the most influential region in shaping global market trends.
Europe
Europe represents around 20–30% of the global crypto art market. The region’s deep art culture, combined with growing acceptance of digital ownership, drives steady adoption. Countries such as the United Kingdom, Germany, and France play major roles due to strong creative communities and supportive digital policies. Museums and galleries are gradually integrating NFT exhibitions, expanding visibility for artists. Europe’s balanced mix of traditional and digital art practices strengthens market stability. While regulatory changes continue to evolve, the region remains a significant contributor to global crypto art activity.
Asia-Pacific
Asia-Pacific holds around 26–30% of the crypto art market and continues to grow rapidly. The region benefits from a large tech-savvy population, strong gaming and digital culture, and rising interest in Web3 innovation. Countries such as Japan, South Korea, China, and India are becoming major hubs for digital creators and collectors. Increasing involvement in metaverse projects and generative art formats supports further growth. As blockchain adoption spreads across the region, Asia-Pacific is expected to drive a substantial share of future market expansion in crypto art.
Latin America
Latin America accounts for about 5–7% of the crypto art market. Growth is supported by rising digital engagement, mobile-first users, and increasing participation from young creators. Brazil, Mexico, and Argentina are emerging as key contributors as more artists adopt NFTs to reach global buyers. However, challenges such as limited infrastructure and regulatory uncertainty slow broader adoption. Despite this, the region shows strong potential, with expanding digital communities and growing interest in blockchain-based creative expression.
Middle East & Africa
The Middle East & Africa region holds around 5–12% of the crypto art market. Growth is driven by increasing blockchain investment in the UAE, Saudi Arabia, and select African countries. Digital art exhibitions and Web3 innovation hubs are emerging, attracting creators and collectors. Wealthy buyers in the Gulf region also contribute to higher-value NFT purchases. However, adoption remains uneven due to infrastructure gaps and varying regulations. As digital ecosystems strengthen, the region is expected to play a larger role in the global crypto art landscape.
Market Segmentations:
By Component:
- Hardware
- Software
By Type:
- Bitcoin
- Ether
By End User:
- Trading
- E-commerce
By Geography
- North America
- U.S.
- Canada
- Mexico
- Europe
- Germany
- France
- U.K.
- Italy
- Spain
- Rest of Europe
- Asia Pacific
- China
- Japan
- India
- South Korea
- South-east Asia
- Rest of Asia Pacific
- Latin America
- Brazil
- Argentina
- Rest of Latin America
- Middle East & Africa
- GCC Countries
- South Africa
- Rest of the Middle East and Africa
Competitive Landscape
The competitive landscape of the Crypto Art Market features diverse activity, although companies such as Contego International Inc., BASF SE, No-Burn Inc., Henkel AG & Company KGaA, Axalta Coating Systems, Jotun, RPM International Inc., Hempel A/S, PPG Industries Inc., and The Sherwin-Williams Company. The Crypto Art Market continues to evolve as digital-native platforms, blockchain developers, and emerging NFT marketplaces expand their capabilities to attract both artists and collectors. Competition is driven primarily by innovation in smart contract design, enhanced royalty mechanisms, and improved authentication features that strengthen trust and transparency in digital ownership. Leading platforms focus on strengthening user experience through better curation tools, personalized discovery engines, and cross-chain interoperability, allowing creators to reach broader audiences. Meanwhile, the rise of metaverse environments and AI-generated art introduces new competitive dimensions, encouraging marketplaces to support immersive exhibitions and dynamic digital formats. As regulatory clarity improves and institutional interest increases, competition intensifies around security, scalability, and community engagement. Overall, the market remains dynamic, with differentiation closely tied to technological advancement, creator empowerment, and platform reliability.
Key Player Analysis
- Contego International Inc.
- BASF SE
- No-Burn Inc.
- Henkel AG & Company, KGaA
- Axalta Coating Systems
- Jotun
- RPM International, Inc.
- Hempel A/S
- PPG Industries, Inc.
- The Sherwin-Williams Company
Recent Developments
- In June 2025, JSW Paints announced its agreement to acquire a majority stake in Akzo Nobel India, a deal that involves a mix of equity and debt financing, supported by lenders like Deutsche Bank and MUFG.
- In April 2025, Jotun and Thoresen Shipping Singapore Pte. Ltd. partnered to implement Jotun's Hull Skating Solutions (HSS) on the Thor Brave bulk carrier. This commercial agreement involves Jotun's proactive hull cleaning and antifouling technology, which aims to keep the vessel's hull clean and reduce fuel costs and CO2 emissions.
- In January 2025, Axalta Coating Systems and Dürr Systems AG announced a strategic partnership to commercialize digital paint solutions for automotive OEMs by integrating Axalta’s NextJet™ precision paint application technology with Dürr’s advanced robotics systems.
- In March 2024, Sherwin-Williams Repacor SW-1000 is an innovative, 100% solids, VOC-free polyaspartic repair coating designed to simplify maintenance and repair of steel structures by providing a high-performance, single-coat solution.
Report Coverage
The research report offers an in-depth analysis based on Component, Type, End-User and Geography. It details leading market players, providing an overview of their business, product offerings, investments, revenue streams, and key applications. Additionally, the report includes insights into the competitive environment, SWOT analysis, current market trends, as well as the primary drivers and constraints. Furthermore, it discusses various factors that have driven market expansion in recent years. The report also explores market dynamics, regulatory scenarios, and technological advancements that are shaping the industry. It assesses the impact of external factors and global economic changes on market growth. Lastly, it provides strategic recommendations for new entrants and established companies to navigate the complexities of the market.
Future Outlook
- The market will continue to grow as more artists adopt blockchain to secure ownership and monetize digital works.
- NFT platforms will enhance authentication, storage, and royalty systems to support long-term creator earnings.
- Cross-chain interoperability will expand, allowing artworks to move easily between different blockchain networks.
- Metaverse integration will increase demand for immersive and interactive digital art experiences.
- AI-generated and generative art will gain greater prominence among collectors and creators.
- Fractional ownership models will attract new buyers by lowering entry barriers for high-value digital pieces.
- Institutions and galleries will expand their involvement through curated NFT exhibitions and digital art fundraising models.
- Regulatory clarity will improve, strengthening market transparency and investor confidence.
- Community-driven platforms and DAOs will play a larger role in curating and funding digital art projects.
- Enhanced security solutions will help reduce fraud, unauthorized minting, and misuse of artist content.
Request a Free Sample
Fill in your details and we'll send you a free sample report.
- Sample data tables & charts
- Research methodology
Need a Custom Version of This Report?
Tailor the scope, geography, or segments to your exact requirements.
- Custom geography or segment scope
- Direct access to our analyst team
Frequently Asked Questions
What is the current market size for the Crypto Art Market, and what is its projected size in 2032?
At what Compound Annual Growth Rate is the Crypto Art Market projected to grow between 2025 and 2032?
Which Crypto Art Market segment held the largest share in 2024?
What are the primary factors fueling the growth of the Crypto Art Market?
Who are the leading companies in the Crypto Art Market?
Which region commanded the largest share of the Crypto Art Market in 2024?
Table of Content
Chapter 1. Report Introduction
- 1.1 Report Description & Purpose
- 1.1.1 Report Title & Market Definition
- 1.1.2 Unique Selling Propositions (USP) & Key Differentiators
- 1.1.3 Value Proposition for Stakeholders
- 1.2 Research Objectives
- 1.2.1 Market Sizing Objectives (Volume & Revenue) (Volume Where Applicable)
- 1.2.2 Segmentation Objectives
- 1.2.3 Competitive Intelligence Objectives
- 1.2.4 Forecast & Scenario Objectives
- 1.3 Report Scope
- 1.3.1 Crypto Art Scope – Segments & Subsegments Covered
- 1.3.2 Geographic Scope – Regions & Countries Covered
- 1.3.3 Historical Period, Base Year & Forecast Period (2024; forecast to 2032)
- 1.3.4 Inclusions & Exclusions
- 1.4 Industry Classification & Applicable Codes
- 1.5 Currency, Measurement Units & Valuation Basis
- 1.6 Target Stakeholders
- 1.7 Limitations & Assumptions
Chapter 2. Executive Summary
- 2.1 Global Crypto Art Market Snapshot
- 2.1.1 Market Size – Historical (2024) & Forecast (2024-2032) (2024: USD 6.51 billion → 2032: USD 20.38 billion)
- 2.1.2 Volume & Revenue – Global Totals (Volume Where Applicable)
- 2.1.3 Key Market Highlights – Top Five Facts
- 2.2 Crypto Art Market Segmentation Snapshot
- 2.2.1 Market Split by Region – 2024 vs. 2032
- 2.3 Competitive Snapshot
- 2.3.1 Top 10 Players by Revenue Share – 2024
- 2.3.2 Top 10 Players by Volume Share – 2024 (Volume Where Applicable)
- 2.3.3 Recent Strategic Developments (18-Month Summary)
- 2.4 Key Investment Highlights & Strategic Conclusions
Chapter 3. Crypto Art Market Dynamics & Industry Analysis
- 3.1 Market Overview & Context
- 3.1.1 Crypto Art Market Position in the Broader Industry Value Chain
- 3.1.2 Demand Structure & Purchasing Dynamics
- 3.1.3 Market Maturity & Development Stage by Region
- 3.2 Crypto Art Market Drivers
- 3.3 Crypto Art Market Restraints & Challenges
- 3.4 Crypto Art Market Opportunities
- 3.5 Porter's Five Forces Analysis
- 3.5.1 Threat of New Entrants
- 3.5.2 Bargaining Power of Suppliers
- 3.5.3 Bargaining Power of Buyers
- 3.5.4 Threat of Substitutes
- 3.5.5 Competitive Rivalry – Intensity Assessment
- 3.6 Crypto Art Value Chain Analysis
- 3.6.1 Upstream – Key Inputs, Resources & Suppliers
- 3.6.1.1 Key Input/Resource 1
- 3.6.1.2 Key Input/Resource 2
- 3.6.1.3 Key Input/Resource 3
- 3.6.2 Midstream – Core Operations & Value Creation
- 3.6.2.1 Operating Model & Process Overview
- 3.6.2.2 Key Operating Locations & Capabilities by Company
- 3.6.3 Downstream – Market Channels & End Users
- 3.6.3.1 Direct Sales & Customer Engagement Channels
- 3.6.3.2 Indirect Sales, Intermediaries & Partner Channels
- 3.6.4 Value Chain Profitability Analysis
- 3.6.1 Upstream – Key Inputs, Resources & Suppliers
- 3.7 PESTEL Analysis
- 3.7.1 Political Factors
- 3.7.2 Economic Factors
- 3.7.3 Social Factors
- 3.7.4 Technological Factors
- 3.7.5 Environmental Factors
- 3.7.6 Legal Factors
- 3.8 Crypto Art Supply Chain Analysis
- 3.8.1 Critical Input & Resource Availability Risk Assessment
- 3.8.2 Supplier & Operational Concentration Risk (Geographic Exposure)
- 3.8.3 Supply & Service Disruption Impact Analysis
- 3.9 Regulatory & Policy Landscape
Note: The regulatory and policy landscape section covers regulations based on their applicability to the market, Crypto Art category, geography, and scope of the study. Only regulatory frameworks with a material impact on operations, compliance, trade, sustainability, or market access are analyzed in detail.
Chapter 4. Key Investment Pockets & Opportunity Analysis
- 4.1 Crypto Art Market Attractiveness Analysis
- 4.1.1 By Region – Investment Attractiveness Matrix (Market Size × CAGR)
- 4.2 Absolute Revenue Growth Opportunity
- 4.2.1 By Region – Absolute Revenue Growth Through 2032
- 4.3 Incremental Demand Opportunity
- 4.3.1 By Region – Incremental Demand Through 2032
- 4.3.2 Segment – Incremental Demand
- 4.4 Emerging Submarket Opportunity Deep Dive (Subject to Applicability)
- 4.5 Priority Market Opportunity Scorecards
- 4.5.1 United States
- 4.5.2 Europe
- 4.5.3 Asia
- 4.5.4 Middle East & Africa
Note: Priority market opportunity scorecards reflect the geographic scope and strategic relevance of the study. Listed markets are indicative and may be adapted to the industry.
Chapter 5. Crypto Art Cross-Border Trade & Market Access Analysis
- 5.1 International Trade & Cross-Border Activity Overview
- 5.1.1 Global Export Value by Country (2024)
- 5.1.2 Global Export Volume by Country (2024) (Volume Where Applicable)
- 5.1.3 Global Import Value by Country (2024)
- 5.1.4 Global Import Volume by Country (2024) (Volume Where Applicable)
- 5.1.5 Net Trade Balance by Country (2024)
- 5.2 Export Analysis – Segment
- 5.2.1 Category 1 (Applicable Classification Code)
- 5.2.2 Category 2 (Applicable Classification Code)
- 5.2.3 Category 3 (Applicable Classification Code)
- 5.2.4 Category 4 (Applicable Classification Code)
- 5.2.5 Category 5 (Applicable Classification Code)
- 5.3 Import Analysis – Segment
- 5.3.1 Category 1 (Applicable Classification Code)
- 5.3.2 Category 2 (Applicable Classification Code)
- 5.3.3 Category 3 (Applicable Classification Code)
- 5.3.4 Category 4 (Applicable Classification Code)
- 5.3.5 Category 5 (Applicable Classification Code)
- 5.4 Cross-Border Pricing & Transaction Benchmarks
- 5.4.1 Export Pricing – Segment & Country
- 5.4.2 Import Pricing – Segment & Source Country
- 5.4.3 Price Trends (2024)
- 5.5 Key Cross-Border Trade & Delivery Routes
- 5.5.1 Cross-Border Trade/Delivery Route 1
- 5.5.2 Cross-Border Trade/Delivery Route 2
- 5.5.3 Cross-Border Trade/Delivery Route 3
- 5.5.4 Cross-Border Trade/Delivery Route 4
- 5.5.5 Cross-Border Trade/Delivery Route 5
- 5.6 Trade Policy & Market Access Impact Assessment
- 5.6.1 Tariff & Non-Tariff Barriers
- 5.6.2 Regional Trade & Economic Integration Frameworks
- 5.6.3 Bilateral & Multilateral Trade Agreements
- 5.6.4 Cross-Border Operating, Licensing & Localization Requirements
Note: This chapter applies where cross-border trade or delivery is relevant to Crypto Art. Goods, services, and digital offerings are assessed using applicable classifications and transaction measures. Import-export volumes, trade balances, and route analyses are included only where meaningful to the market.
Chapter 6. Competitive Landscape & Company Benchmarking
- 6.1 Crypto Art Market Concentration & Structure
- 6.1.1 Herfindahl-Hirschman Index (HHI) – the historical period vs. 2024
- 6.1.2 Leading, Mid-Sized & Emerging Player Structure
- 6.1.3 Global, Regional & Local Player Dynamics
- 6.2 Crypto Art Market Share Analysis – 2024
- 6.2.1 Global Revenue Share by Company
- 6.2.2 Global Volume Share by Company (Volume Where Applicable)
- 6.2.3 Regional Revenue Share
- 6.2.4 Market Share Evolution (the historical period vs. 2024)
- 6.2.5 Company Market Share by Key Segment
- 6.2.6 Company Market Share by Customer Group
- 6.3 Operating Scale, Capacity & Infrastructure Analysis
- 6.3.1 Global Operating Scale & Supply Capacity
- 6.3.2 Resource Utilization & Operating Efficiency
- 6.3.3 Output, Service Delivery & Activity Metrics
- 6.3.4 Operating Footprint & Infrastructure Map
- 6.3.5 Planned Operational & Capacity Expansion
- 6.4 Crypto Art Competitive Benchmarking Matrix
- 6.4.1 Revenue, Growth, Profitability & Operating Metric Comparison
- 6.4.2 Channel Revenue Mix
- 6.4.3 Geographic Revenue Exposure
- 6.4.4 R&D Intensity
- 6.4.5 Sustainability Maturity
- 6.5 Strategic Developments in Crypto Art (Last 24 Months)
- 6.5.1 Mergers, Acquisitions & Divestments
- 6.5.2 New Products, Services & Solutions in Crypto Art
- 6.5.3 Operational & Infrastructure Expansions
- 6.5.4 Strategic Alliances, Joint Ventures & Partnerships
- 6.5.5 Distribution Expansion & Market Entry
- 6.5.6 Sustainability & ESG Initiatives
- 6.6 Competitive Strategy Mapping
- 6.6.1 Leader, Challenger, Follower & Niche Classification
- 6.6.2 Pricing Strategy Comparison
- 6.6.3 Channel Strategy Matrix
Note: Strategic developments are included based on their materiality and the availability of reliable information.
Chapter 7. Global Crypto Art Market – By Sales & Delivery Channel
- 7.1 Segment Overview
- 7.1.1 Volume & Revenue Split by Channel (2024 & 2032) (Volume Where Applicable)
- 7.1.2 Channel Mix Evolution (2024-2032)
Chapter 8. Regional Market Analysis – Global Overview
- 8.1 Global Regional Overview
- 8.1.1 Regional Volume Share (Volume Where Applicable)
- 8.1.2 Regional Revenue Share
- 8.1.3 Regional Volume by Region (Volume Where Applicable)
- 8.1.4 Regional Revenue by Region
- 8.1.5 Regional Forecast Through 2032
- 8.2 Cross-Regional Segment Analysis
- 8.2.1 By Sales & Delivery Channel
- 8.2.2 By Competitive Positioning & Price Tier
Chapter 9. North America Crypto Art Market
- 9.1 United States
- 9.2 Canada
- 9.3 Mexico
Chapter 10. Europe Crypto Art Market
- 10.1 Germany
- 10.2 France
- 10.3 Italy
- 10.4 United Kingdom
- 10.5 Spain
- 10.6 Poland
- 10.7 Russia
- 10.8 Netherlands
- 10.9 Belgium
- 10.10 Sweden
- 10.11 Denmark
- 10.12 Norway
- 10.13 Rest of Europe
Chapter 11. Asia Pacific Crypto Art Market
- 11.1 China
- 11.2 India
- 11.3 Japan
- 11.4 South Korea
- 11.5 Thailand
- 11.6 Indonesia
- 11.7 Vietnam
- 11.8 Malaysia
- 11.9 Australia
- 11.10 Rest of Asia Pacific
Chapter 12. Latin America Crypto Art Market
- 12.1 Brazil
- 12.2 Argentina
- 12.3 Colombia
- 12.4 Chile
- 12.5 Rest of Latin America
Chapter 13. Middle East Crypto Art Market
- 13.1 Saudi Arabia
- 13.2 United Arab Emirates
- 13.3 Turkey
- 13.4 Israel
- 13.5 Iran
- 13.6 Rest of the Middle East
Chapter 14. Africa Crypto Art Market
- 14.1 South Africa
- 14.2 Egypt
- 14.3 Nigeria
- 14.4 Morocco
- 14.5 Rest of Africa
Chapter 15. Crypto Art Company Profiles
- 15.1 [Company 01]
- 15.1.1 Company Overview
- 15.1.2 Key Management Personnel
- 15.1.3 Products & Services Portfolio
- 15.1.4 Financial Performance
- 15.1.5 Key Market Focus & Geographic Presence
- 15.1.6 Recent Developments & Strategic Initiatives
Note: The company profile list is preliminary and may change based on research findings, market developments, data availability, and client requirements.
Chapter 16. Appendices
- Appendix A – List of Abbreviations & Acronyms
- Appendix B – Industry Classification Code Reference – Full Series
- Appendix C – Supply, Output & Operating Capacity Data Tables
- Appendix D – End-Use & Demand Base Tables
- Appendix E – Demand, Adoption & Usage Assumptions
- Appendix F – Pricing & Revenue Metric Reference Tables
- Appendix G – Company Operations & Infrastructure Database
- Appendix H – Cross-Border Trade & Activity Data Tables (Where Applicable)
- Appendix I – Regulatory Summary Tables
- Appendix J – Primary Research Participant List (Anonymized)
- Appendix K – Primary Research Questionnaire Framework
- Appendix L – Data Sources & Bibliography
- Appendix M – Market Size Divergence & Source Comparison
Chapter 17. Research Methodology
- 17.1 Research Framework & Philosophy
- 17.2 Secondary Research – Sources, Hierarchy & Data Extraction
- 17.3 Data Modeling – Bottom-Up & Top-Down Market Sizing
- 17.4 Primary Research – Stakeholder Framework, LOI & Sample Sizes
- 17.5 Forecast Methodology – Regression, Scenario & Sensitivity Analysis
- 17.6 Quality Control – Four-Layer Validation Framework
- 17.7 Limitations & Standard Assumptions
- 17.8 Disclaimer
