Market Overview:
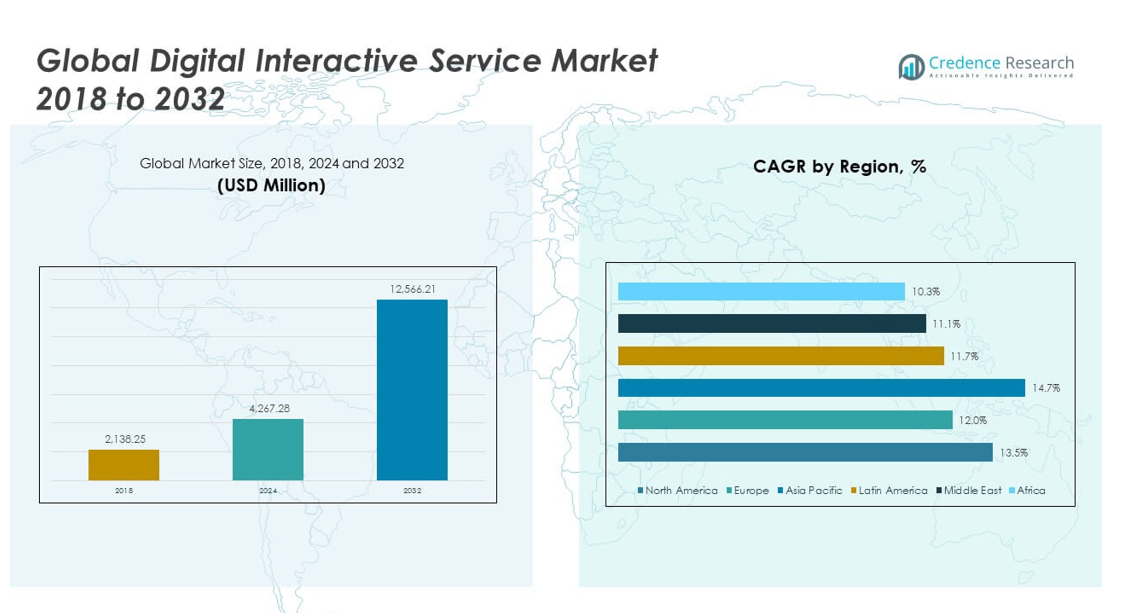
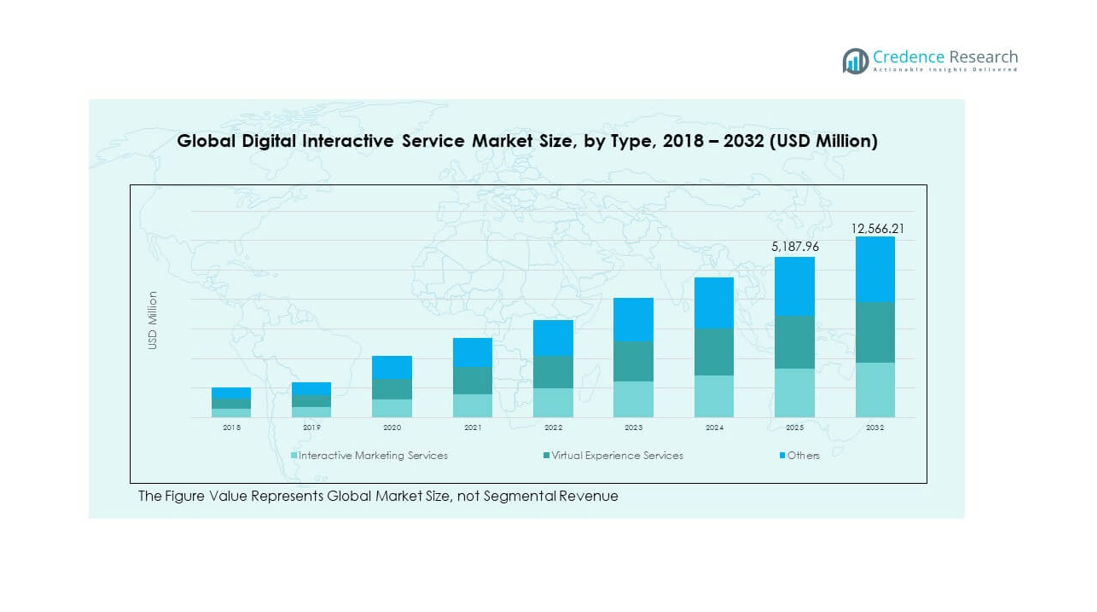
The Global Digital Interactive Service Market size was valued at USD 2,138.25 million in 2018 to USD 4,267.28 million in 2024 and is anticipated to reach USD 12,566.21 million by 2032, at a CAGR of 13.47% during the forecast period.
| REPORT ATTRIBUTE |
DETAILS |
| Historical Period |
2020-2023 |
| Base Year |
2024 |
| Forecast Period |
2025-2032 |
| Digital Interactive Service Market Size 2024 |
USD 4,267.28 million |
| Digital Interactive Service Market, CAGR |
13.47% |
| Digital Interactive Service Market Size 2032 |
USD 12,566.21 million |
The market is driven by the rising demand for personalized and engaging customer experiences across sectors such as retail, healthcare, and education. Growing integration of AI, AR/VR, and cloud technologies supports dynamic service delivery. Businesses are adopting digital interactive solutions to enhance real-time engagement, streamline operations, and improve decision-making. Increasing internet penetration and mobile device usage further accelerate market adoption, creating opportunities for providers to expand solutions in both developed and emerging markets.
North America leads the market, supported by advanced digital infrastructure and high adoption of interactive technologies in enterprises. Europe follows with strong government support for digital transformation and growing demand for immersive services. Asia-Pacific is emerging rapidly due to urbanization, expanding internet connectivity, and rising investments in smart solutions. Countries such as China and India are key growth hubs, while regions like Latin America and the Middle East show gradual adoption driven by digitalization initiatives.
Market Insights:
- he Global Digital Interactive Service Market size was USD 2,138.25 million in 2018, USD 4,267.28 million in 2024, and is projected to reach USD 12,566.21 million by 2032, registering a CAGR of 13.47%.
- North America led with 43% share in 2024, driven by advanced infrastructure and leadership of global players, followed by Asia Pacific with 31% supported by urbanization and smartphone penetration, and Europe with 17% supported by strong digital transformation initiatives.
- Asia Pacific is the fastest-growing region with a CAGR of 14.7%, fueled by large consumer bases, expanding 5G infrastructure, and rising demand for immersive services in education and entertainment.
- Interactive marketing services dominated the type segment in 2024 with around 52% share, supported by strong adoption in retail, advertising, and corporate communication.
- Virtual experience services accounted for nearly 33% share, driven by rising demand for AR and VR-enabled platforms in training, healthcare, and entertainment.
Access crucial information at unmatched prices!
Request your sample report today & start making informed decisions powered by Credence Research Inc.!
Download Sample
Market Drivers:
Rising Demand For Personalized Customer Experiences Across Multiple Sectors:
The Global Digital Interactive Service Market benefits from the growing demand for tailored digital engagement across industries like retail, education, and healthcare. Consumers expect interactive platforms that adapt to their preferences in real time. Organizations implement digital tools that enhance customer journeys through AI-based personalization, immersive interfaces, and targeted communication. These solutions increase satisfaction, strengthen loyalty, and boost conversion rates. Businesses recognize the value of personalization for differentiation in competitive landscapes. It supports enhanced data-driven insights that allow continuous service improvement. Interactive platforms help reduce churn rates while improving lifetime value. This demand creates consistent momentum for market growth.
- For instance, Amazon’s AI-powered recommendation engine significantly boosts sales and customer engagement by delivering real-time, highly relevant product suggestions. For decades, the company has leveraged machine learning and AI to personalize the shopping journey.
Integration Of Advanced Technologies Such As AI, AR, And Cloud Systems:
Adoption of artificial intelligence, augmented reality, and cloud computing drives innovation in digital interactive services. These technologies allow companies to build scalable, secure, and flexible platforms. AI enables predictive analytics, voice recognition, and personalized recommendations that elevate user experiences. AR provides immersive engagement, while cloud services improve accessibility and reduce infrastructure costs. Businesses adopt hybrid models to expand reach across devices and geographies. It strengthens operational efficiency and supports remote accessibility for employees and customers. Enhanced compatibility with IoT ecosystems also boosts adoption. This integration drives a continuous cycle of product improvement and new applications.
- For instance, IKEA’s AR Place app uses augmented reality to enable customers to visualize furniture accurately within their real space, successfully helping to reduce product return rates by a reported 20–22%. This has been linked to increased purchase confidence.
Growth In Internet Penetration And Mobile Device Usage Worldwide:
Expanding internet access and smartphone adoption are major drivers for interactive digital services. Global users demand accessible, on-the-go platforms that deliver seamless connectivity. Service providers focus on mobile-first strategies that ensure easy access and improved interfaces. It creates opportunities for businesses to reach diverse audiences with localized solutions. High mobile engagement fosters increased demand for real-time support and self-service platforms. Companies across sectors leverage apps, chatbots, and mobile portals to enhance engagement. Strong demand from younger demographics drives faster adoption cycles. The expansion of digital ecosystems worldwide reinforces market growth across developed and emerging economies.
Focus On Enhancing Operational Efficiency And Business Agility:
Enterprises deploy digital interactive services to streamline workflows and improve decision-making. Platforms integrate data analytics, automation, and feedback systems to enhance productivity. It helps organizations manage customer inquiries, employee training, and partner collaboration more effectively. Businesses leverage interactive dashboards for real-time insights that support strategic planning. The Global Digital Interactive Service Market gains from firms prioritizing cost savings and agility. Demand rises for solutions that reduce manual processes and increase automation. Companies integrate interactive systems with CRM and ERP platforms to optimize performance. This operational focus ensures greater resilience and adaptability in competitive industries.
Market Trends:
Growing Use Of Immersive Technologies To Enhance Consumer Engagement:
The Global Digital Interactive Service Market is shaped by the rising use of immersive tools such as VR, AR, and mixed reality. These technologies redefine how consumers interact with digital platforms. Companies deploy immersive features in education, entertainment, and training to improve retention and participation. Retailers create virtual try-on solutions, while healthcare uses simulations for better patient engagement. It enhances brand connection by offering memorable, interactive experiences. Demand for immersive solutions expands with affordable devices and user familiarity. Enterprises align strategies with experiential marketing to gain competitive edges. This trend continues to dominate engagement-driven markets worldwide.
- For example, Apple’s Vision Pro mixed reality headset features 23 million pixels in ultra-high-resolution micro-OLED displays, enabling seamless spatial computing that revolutionizes user interaction by combining eye, hand, and voice control in an intuitive interface.
Expansion Of Gamification To Drive Participation And Loyalty Programs:
Gamification is increasingly used to motivate users and sustain engagement. Businesses integrate gaming elements into apps, learning systems, and loyalty programs. It supports higher retention by creating rewarding digital journeys for consumers. The Global Digital Interactive Service Market witness’s strong adoption of gamification in e-learning and corporate training. Retail and hospitality sectors also benefit from interactive reward structures. It motivates employees and customers with progress tracking, challenges, and personalized rewards. Gamified systems encourage repeat usage and long-term involvement. This growing trend supports measurable engagement outcomes across industries.
- For instance, Starbucks Rewards gamification program incentivizes purchases through a star-based points system, significantly increasing repeat visits and enabling customers to redeem rewards like free drinks, creating a personalized and interactive loyalty experience.
Adoption Of Voice-Based And Conversational Interfaces For Real-Time Support:
Voice recognition and conversational AI tools transform the way users interact with platforms. Enterprises invest in chatbots, smart speakers, and voice-enabled assistants to improve accessibility. It strengthens customer support through immediate, personalized responses. The Global Digital Interactive Service Market grows with increasing demand for natural language interfaces. Healthcare uses conversational AI for patient triage, while retail leverages voice for customer inquiries. It allows users to engage without navigating complex menus. Businesses benefit from reduced operational costs and higher customer satisfaction. Adoption accelerates as language processing becomes more accurate and adaptable.
Rising Preference For Hybrid And Omnichannel Platforms For Consistency:
Consumers demand consistent service across physical, digital, and mobile touchpoints. Omnichannel strategies integrate chat, apps, kiosks, and web platforms to deliver seamless engagement. It supports greater accessibility and strengthens brand consistency across regions. The Global Digital Interactive Service Market expands as enterprises prioritize hybrid solutions. Retailers, banks, and educational institutions rely on unified digital platforms. This trend ensures customer expectations are met regardless of the communication channel. Businesses integrate analytics to monitor engagement and identify service gaps. Hybrid platforms become critical for sustainable growth in competitive industries.
Market Challenges Analysis:
High Implementation Costs And Complex Integration With Legacy Systems:
The Global Digital Interactive Service Market faces challenges linked to the high cost of advanced platforms. Enterprises, especially SMEs, struggle to allocate budgets for AI, AR, and cloud-based systems. Integration with outdated legacy infrastructure often slows adoption. It increases deployment timelines and requires specialized expertise. Vendors must address customization demands while ensuring compatibility with existing systems. High costs deter businesses in emerging economies, limiting adoption. Enterprises also face risks from system downtime during upgrades. Addressing these issues is essential for wider adoption and smoother integration.
Data Privacy Concerns And Growing Regulatory Compliance Requirements:
Data privacy remains a critical challenge for digital interactive services. Platforms collect vast amounts of user information to personalize experiences. It raises risks of misuse, cyberattacks, and data leaks. The Global Digital Interactive Service Market must address strict regulations such as GDPR and CCPA. Compliance increases costs and complexity for enterprises. Growing consumer awareness amplifies concerns over how personal data is stored and used. Failure to secure data undermines trust and slows adoption. Stronger cybersecurity measures and transparent policies are vital for overcoming this challenge.
Market Opportunities:
Expansion Into Emerging Economies With Rising Digital Infrastructure Investments:
Emerging economies present significant opportunities for providers of interactive digital solutions. Countries across Asia-Pacific, Latin America, and Africa are investing in broadband and mobile networks. The Global Digital Interactive Service Market benefits from these improvements as more people connect to digital ecosystems. Enterprises enter these regions with affordable, scalable platforms tailored to local needs. It creates opportunities for service providers to tap into underserved markets. Governments also support digital transformation initiatives, boosting long-term demand.
Innovation In Niche Applications Such As Healthcare And Education Services:
Healthcare and education sectors offer strong growth potential for digital interactive services. Providers create solutions for patient engagement, telehealth, remote learning, and immersive training. The Global Digital Interactive Service Market gains traction from these niche applications. It helps institutions improve accessibility and outcomes for diverse populations. Growing acceptance of virtual classrooms and remote diagnostics supports expansion. Vendors innovating in these areas can establish long-term partnerships with institutions. This trend provides a strategic path for market differentiation and sustainable growth.
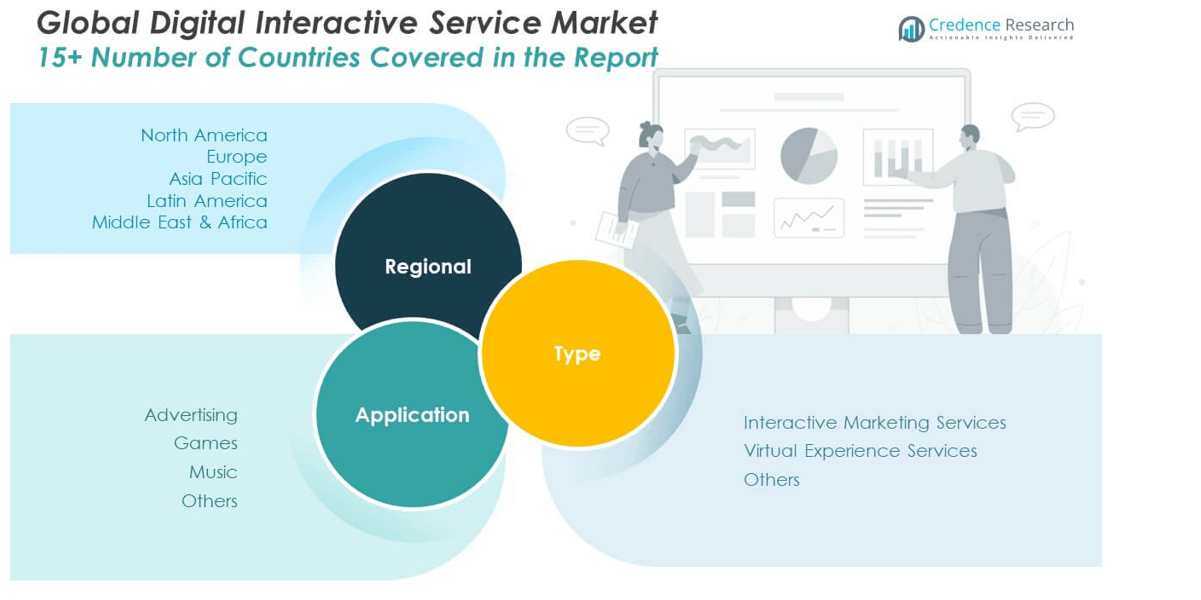
Market Segmentation Analysis:
By Type
Interactive marketing services hold the dominant share in the Global Digital Interactive Service Market, driven by strong adoption across retail, advertising, and corporate communication. Organizations leverage these services to enhance brand engagement and deliver personalized campaigns. Virtual experience services are expanding rapidly, supported by demand for immersive technologies in training, education, and entertainment. It benefits from the growing use of AR and VR to create dynamic user experiences. The “others” category, including niche digital tools, contributes steadily with targeted adoption in specialized industries.
- For instance, Murad skincare uses interactive quizzes on their website to gather customer preferences, offering personalized product recommendations that increase engagement and conversion by directly addressing individual skin care needs.
By Application
Games represent the leading application segment, supported by high user engagement, mobile adoption, and demand for interactive entertainment. It benefits from the integration of real-time graphics, multiplayer platforms, and gamification models. Music follows as a strong contributor, with streaming platforms and interactive concerts reshaping digital engagement. The food and beverages sector is emerging, driven by the adoption of interactive menus, kiosks, and personalized ordering solutions. The “others” category, including education and healthcare, is gaining traction, supported by interactive learning modules and patient engagement platforms. Together, these segments highlight the diverse scope of digital interactive services across industries.
- For example, Buona Beef’s adoption of Samsung self-service kiosks has led to 15% of all orders being placed through kiosks, with some locations seeing orders via this digital channel, improving ordering efficiency and customer control.
Segmentation:
By Type
- Interactive Marketing Services
- Virtual Experience Services
- Others
By Application
- Food & Beverages
- Games
- Music
- Others
By Region
- North America
- Europe
- UK
- France
- Germany
- Italy
- Spain
- Russia
- Rest of Europe
- Asia Pacific
- China
- Japan
- South Korea
- India
- Australia
- Southeast Asia
- Rest of Asia Pacific
- Latin America
- Brazil
- Argentina
- Rest of Latin America
- Middle East
- GCC Countries
- Israel
- Turkey
- Rest of Middle East
- Africa
- South Africa
- Egypt
- Rest of Africa
Regional Analysis:
North America
The North America Global Digital Interactive Service Market size was valued at USD 934.41 million in 2018 to USD 1,845.45 million in 2024 and is anticipated to reach USD 5,449.53 million by 2032, at a CAGR of 13.5% during the forecast period. North America holds the largest regional share, contributing around 43% of the Global Digital Interactive Service Market in 2024. It benefits from advanced digital infrastructure, high internet penetration, and rapid adoption of interactive solutions by enterprises. Strong demand from sectors such as retail, healthcare, and entertainment drives growth. It is further supported by high investment in AI, AR, and cloud technologies. The presence of leading players such as Microsoft and Google strengthens regional leadership. The U.S. dominates within North America due to its early adoption and significant R&D spending. Canada and Mexico are expanding with increased digitalization and government-backed initiatives. This region sets the pace for innovation and global adoption trends.
Europe
The Europe Global Digital Interactive Service Market size was valued at USD 379.20 million in 2018 to USD 713.12 million in 2024 and is anticipated to reach USD 1,898.91 million by 2032, at a CAGR of 12.0% during the forecast period. Europe accounts for about 17% of the market share in 2024, supported by strong digital transformation programs across major economies. Countries like the UK, Germany, and France lead adoption with investments in interactive platforms for retail, automotive, and education. It benefits from EU-backed digital strategies that encourage innovation and secure data use. Growth is fueled by rising use of immersive technologies in training and entertainment. Europe’s regulatory focus on data protection encourages trust and adoption of secure services. The region emphasizes sustainability, which aligns with interactive platforms supporting energy-efficient solutions. Southern and Eastern European countries are emerging markets with untapped potential. Europe remains a stable growth hub with balanced adoption across industries.
Asia Pacific
The Asia Pacific Global Digital Interactive Service Market size was valued at USD 628.91 million in 2018 to USD 1,323.96 million in 2024 and is anticipated to reach USD 4,246.10 million by 2032, at a CAGR of 14.7% during the forecast period. Asia Pacific represents around 31% of the Global Digital Interactive Service Market in 2024, making it the second-largest region. Strong growth is driven by rapid urbanization, rising smartphone penetration, and government-led digital programs. Countries like China, India, and Japan lead with large consumer bases and heavy investments in digital ecosystems. It benefits from growing demand for immersive platforms in education, gaming, and e-commerce. Enterprises across the region adopt hybrid solutions to manage scale and reach. Increasing investments in 5G infrastructure further boost adoption of interactive services. Southeast Asia shows significant momentum as SMEs embrace digital transformation. Asia Pacific is the fastest-growing region with strong long-term opportunities.
Latin America
The Latin America Global Digital Interactive Service Market size was valued at USD 101.24 million in 2018 to USD 199.53 million in 2024 and is anticipated to reach USD 520.21 million by 2032, at a CAGR of 11.7% during the forecast period. Latin America contributes nearly 5% of the Global Digital Interactive Service Market in 2024. Growth is supported by expanding internet penetration and rising adoption of mobile-first platforms. Brazil and Mexico dominate, while Argentina is emerging as a promising market. It benefits from increasing demand for digital platforms in retail, banking, and entertainment. Government initiatives aimed at digital transformation support the region’s momentum. Challenges remain in infrastructure and affordability, but market growth continues steadily. SMEs drive demand with interactive tools that enhance customer engagement. Latin America represents a developing but promising growth opportunity.
Middle East
The Middle East Global Digital Interactive Service Market size was valued at USD 60.37 million in 2018 to USD 110.22 million in 2024 and is anticipated to reach USD 274.30 million by 2032, at a CAGR of 11.1% during the forecast period. The Middle East holds about 3% of the Global Digital Interactive Service Market share in 2024. Growth is driven by investments in smart cities, retail modernization, and government-backed digital programs. GCC countries lead adoption with strong purchasing power and focus on innovation. It benefits from increasing use of interactive kiosks, virtual platforms, and AI-based services. Israel and Turkey also contribute with technology-led ecosystems. The region faces challenges in scaling adoption outside urban hubs. Strong focus on tourism and entertainment fuels demand for immersive experiences. The Middle East remains an emerging region with niche opportunities.
Africa
The Africa Global Digital Interactive Service Market size was valued at USD 34.12 million in 2018 to USD 75.01 million in 2024 and is anticipated to reach USD 177.17 million by 2032, at a CAGR of 10.3% during the forecast period. Africa represents about 2% of the Global Digital Interactive Service Market share in 2024. Growth is driven by rising mobile adoption, improving connectivity, and expanding digital literacy. South Africa and Egypt lead the region with structured digital transformation strategies. It benefits from government initiatives to expand internet infrastructure and digital services. Affordability and infrastructure challenges remain barriers to widespread adoption. Demand grows for interactive learning and healthcare platforms to address local needs. SMEs and startups play an important role in innovation across key markets. Africa represents a high-potential frontier market with long-term growth prospects.
Shape Your Report to Specific Countries or Regions & Enjoy 30% Off!
Key Player Analysis:
- Samsung Electronics
- LG Electronics
- Microsoft Corporation
- Google LLC
- Sharp Corporation
- BenQ Corporation
- Elo Touch Solutions
- NEC Display Solutions
- ViewSonic Corporation
- SMART Technologies
Competitive Analysis:
The Global Digital Interactive Service Market is highly competitive, with major players investing in advanced technologies such as AI, AR/VR, and cloud solutions. It is characterized by the presence of global leaders like Samsung Electronics, LG Electronics, Microsoft, and Google, which leverage strong portfolios to secure market dominance. Smaller firms and startups contribute by offering niche and customizable solutions across applications. Companies differentiate through product innovation, partnerships, and integration with immersive platforms. Intense competition pushes continuous enhancements in user engagement, real-time personalization, and seamless cross-channel experiences. Strategic mergers, acquisitions, and regional expansions strengthen market positioning. The market’s dynamic nature ensures innovation-driven competition, with a strong focus on scaling digital ecosystems.
Recent Developments:
- In January 2025, Samsung Electronics unveiled Samsung Vision AI at CES First Look, introducing AI-powered screens for personalized and adaptive experiences across its Neo QLED, OLED, and QLED TV lines.
- In January 2025, LG Electronics revealed its vision for AI-powered customer experiences branded as “Affectionate Intelligence” during the LG World Premiere event at CES 2025. This AI approach aims to deliver highly personalized and empathetic interactions across home, mobility, and commercial spaces.
- Microsoft continued its investment in cloud and AI infrastructure, reporting strong cloud and AI adoption in Q2 FY 2025, with significant revenue growth driven by AI services on Azure. The company reaffirmed an $80 billion AI-focused capital expenditure target for FY 2025, solidifying its commitment to AI leadership, though no recent acquisitions in digital interactive services were noted.
- BenQ Corporation launched the InstaShow WDC15 in July 2025, a new 4K UHD wireless presentation system designed to enable quick and driver-free screen sharing for collaborative meetings in interactive digital displays.
- Elo Touch Solutions signed a definitive agreement to be acquired by Zebra Technologies for $1.3 billion in 2025. This acquisition aims to expand their market reach in retail and touch application solutions, expected to close within 2025.
Report Coverage:
The research report offers an in-depth analysis based on Type and Application. It details leading market players, providing an overview of their business, product offerings, investments, revenue streams, and key applications. Additionally, the report includes insights into the competitive environment, SWOT analysis, current market trends, as well as the primary drivers and constraints. Furthermore, it discusses various factors that have driven market expansion in recent years. The report also explores market dynamics, regulatory scenarios, and technological advancements that are shaping the industry. It assesses the impact of external factors and global economic changes on market growth. Lastly, it provides strategic recommendations for new entrants and established companies to navigate the complexities of the market.
Future Outlook:
- Growing adoption of immersive technologies will reshape user engagement models.
- Cloud-based platforms will gain prominence across enterprises and consumer services.
- AI-driven personalization will expand in retail, education, and healthcare.
- Hybrid and omnichannel experiences will become a standard expectation.
- SMEs will drive adoption with cost-effective and scalable platforms.
- Investments in 5G infrastructure will accelerate interactive service deployment.
- Data privacy and security will remain a key focus for vendors.
- Emerging markets will offer strong opportunities through expanding digital ecosystems.
- Partnerships and mergers will define competitive positioning globally.
- Innovation in niche applications will diversify growth avenues across industries.


