Market Overview
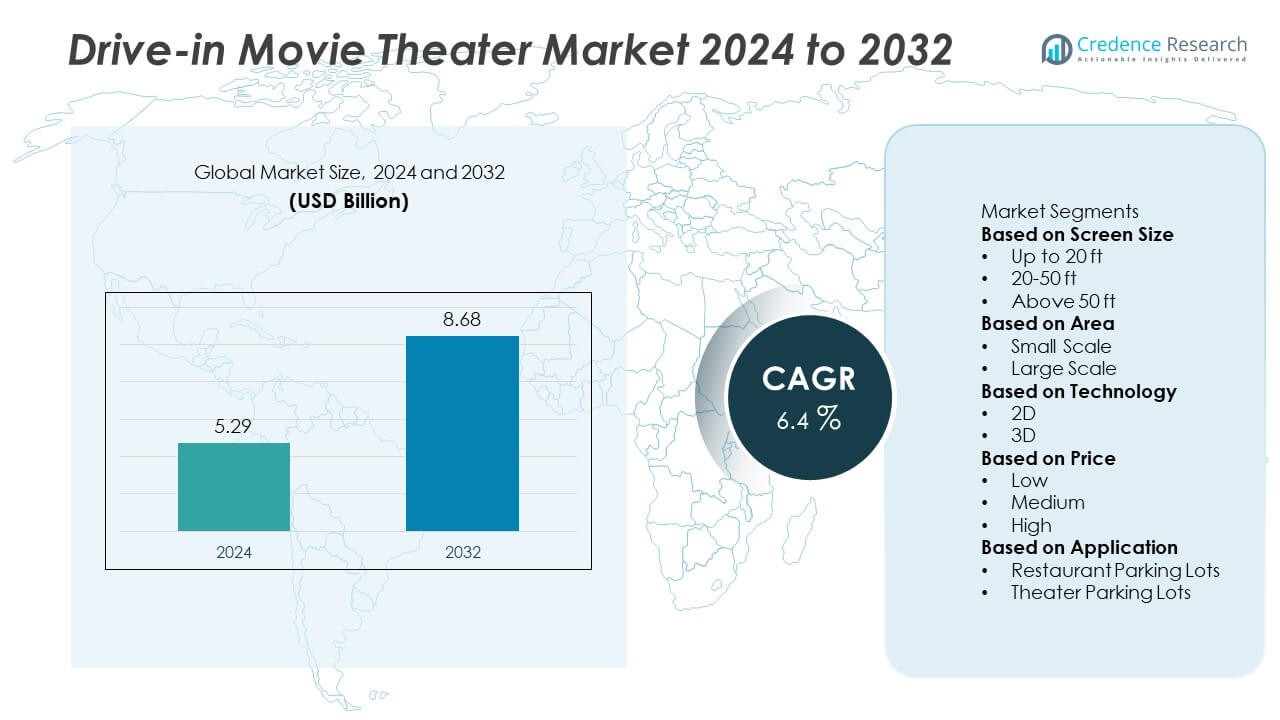
The Drive-in Movie Theater market was valued at USD 5.29 billion in 2024 and is projected to reach USD 8.68 billion by 2032, growing at a CAGR of 6.4% during the forecast period.
| REPORT ATTRIBUTE |
DETAILS |
| Historical Period |
2020-2023 |
| Base Year |
2024 |
| Forecast Period |
2025-2032 |
| Drive-in Movie Theater Market Size 2024 |
USD 5.29 Billion |
| Drive-in Movie Theater Market, CAGR |
6.4% |
| Drive-in Movie Theater Market Size 2032 |
USD 8.68 Billion |
The drive-in movie theater market is led by major players such as Galaxy Drive-In, Shankweiler’s Drive-In, Capri Drive-In, Coyote Drive-In and Canteen, Mesa Drive-In, Malco Theatres, Hull’s Drive-In, South Bay Drive-In, Delsea Drive-In, and Field of Dreams Drive-In. These companies dominate through strategic locations, upgraded projection technologies, and diversified entertainment offerings. They focus on enhancing customer experiences through digital ticketing, themed screenings, and family-oriented events. North America led the market with a 38% share in 2024, driven by a strong cultural presence and established infrastructure. Europe followed with a 27% share, supported by outdoor leisure trends, while Asia Pacific accounted for a 25% share, emerging as the fastest-growing region due to rising disposable incomes and expanding urban entertainment demand.
Access crucial information at unmatched prices!
Request your sample report today & start making informed decisions powered by Credence Research Inc.!
Download Sample
Market Insights
- The global drive-in movie theater market was valued at USD 5.29 billion in 2024 and is projected to reach USD 8.68 billion by 2032, growing at a CAGR of 6.4% during the forecast period.
- Market growth is driven by increasing consumer demand for outdoor entertainment, family-oriented leisure activities, and the resurgence of nostalgic cinema experiences.
- Key trends include the adoption of digital projection systems, contactless ticketing, and the use of drive-in venues for concerts, sports screenings, and community events.
- The market is competitive, with leading operators such as Galaxy Drive-In, Shankweiler’s Drive-In, Coyote Drive-In and Canteen, and Malco Theatres focusing on modernization, diversified event offerings, and customer engagement.
- North America led with a 38% share, followed by Europe at 27% and Asia Pacific at 25%, while the large-scale segment dominated with a 64% share, driven by high-capacity venues and expanded entertainment formats.
Market Segmentation Analysis:
By Area
The large-scale segment dominated the drive-in movie theater market with a 64% share in 2024, driven by its ability to accommodate more vehicles and generate higher revenue through ticket sales and food concessions. Large-scale theaters often feature advanced projection systems, multiple screens, and enhanced sound quality, offering a premium viewing experience. Their popularity is further supported by growing consumer preference for group entertainment and social events. The expansion of outdoor entertainment venues and investment in modern infrastructure continue to strengthen this segment’s leadership in the global market.
- For instance, Coyote Drive-In in Fort Worth operates four digital screens, utilizing digital projection to deliver a bright image. Movies are shown as double features, and patrons can tune into the soundtrack via their car radios.
By Technology
The 2D segment held a 71% share in 2024, leading the drive-in movie theater market due to its cost-effectiveness and widespread compatibility with existing projection systems. 2D screenings remain the preferred choice for most operators, as they offer reliable picture quality with lower maintenance requirements. The affordability of 2D equipment enables theater owners to reach a larger audience, especially in small and mid-sized markets. However, the 3D segment is steadily growing as technological advancements enhance immersive viewing experiences and attract younger audiences seeking enhanced visual entertainment.
- For instance, Malco Theatres has partnered with Cinionic for its transition to laser-based projection systems across various locations. This technology enhances the viewing experience with improved brightness and contrast, and simplifies operations for the cinema.
By Price
The medium-price segment accounted for a 53% share in 2024, emerging as the leading category in the drive-in movie theater market. It appeals to a broad consumer base by offering balanced affordability and quality entertainment. Medium-priced drive-ins typically include amenities such as FM sound transmission, food service, and digital projection. Their popularity is driven by middle-income consumers seeking cost-effective outdoor leisure experiences. The low-price segment attracts budget-conscious customers, while high-priced venues are gaining traction through luxury features like VIP parking zones, premium seating, and gourmet concessions.
Key Growth Drivers
Rising Popularity of Outdoor Entertainment Experiences
The growing demand for outdoor social entertainment is a key driver of the drive-in movie theater market. Consumers increasingly prefer open-air venues that offer safe and nostalgic experiences. Drive-in theaters provide a comfortable environment for families and groups, combining leisure with privacy. Operators are improving facilities through better lighting, projection, and sound systems. The use of large outdoor spaces for live events, themed nights, and special screenings also attracts wider audiences, strengthening market growth across both urban and suburban regions.
- For instance, Field of Dreams Drive-In in Ohio upgraded its facility with a Christie CP4325-RGB pure laser projector, delivering up to 25,000 lumens brightness and extended illumination life exceeding 30,000 hours.
Expansion of Digital Projection and Audio Technologies
Technological advancement is transforming the drive-in movie theater experience. The adoption of high-definition digital projectors and FM-based audio systems enhances viewing and sound quality. These systems reduce maintenance costs and allow flexible content delivery. Operators benefit from improved operational efficiency and audience engagement through clear visuals and synchronized sound. The shift toward modern projection solutions supports a wider range of entertainment, including live streaming and gaming events, helping drive-ins remain competitive in the evolving entertainment landscape.
- For instance, the South Bay Drive-In in San Diego utilizes FM radio transmission for in-car audio synchronization, allowing guests to tune in from their own vehicles. This traditional drive-in model primarily focuses on showing movies
Growth in Family and Community-Oriented Entertainment
The rising preference for family-friendly leisure options supports consistent market expansion. Drive-in theaters appeal to families seeking affordable and inclusive entertainment in relaxed environments. Local governments and private investors are hosting community movie nights and events to promote social interaction. Operators introduce family discounts, kid-friendly content, and safe parking arrangements to attract repeat customers. This focus on creating community-based entertainment experiences has strengthened the position of drive-in theaters as sustainable alternatives to traditional indoor cinemas.
Key Trends & Opportunities
Integration of Multi-Event and Hybrid Experiences
Drive-in theaters are evolving into multifunctional entertainment venues hosting concerts, comedy shows, and cultural events. This diversification increases revenue and extends operating seasons. Hybrid experiences combining in-person attendance with live streaming enhance reach and audience engagement. Operators are also collaborating with event organizers and streaming platforms to expand programming variety. These innovations cater to diverse demographics, transforming drive-ins into flexible spaces that adapt to modern entertainment preferences and expand beyond traditional movie screenings.
- For instance, Hull’s Drive-In, located in Lexington, Virginia, shows current, family-friendly movies on weekends between March and October and is a non-profit drive-in with a 319-space capacity.
Adoption of Contactless and Smart Ticketing Systems
Digital transformation is reshaping operations across the drive-in movie theater market. Contactless ticketing, mobile payments, and app-based food delivery systems improve customer convenience and reduce physical interactions. Smart ticketing platforms help manage crowd flow and enable targeted promotions using customer data analytics. These technologies enhance the overall experience while supporting operational efficiency. As digital adoption grows, drive-ins benefit from streamlined processes and increased audience satisfaction, positioning them competitively within the broader entertainment industry.
- For instance, Galaxy Drive-In in Ennis, Texas utilizes a point-of-sale (POS) system from Veezi, which enables online ticketing for movies. The cinema accepts contactless payments, and a Google review from August 2024 suggested that purchasing tickets online and arriving early is the best practice.
Key Challenges
High Maintenance and Operational Costs
Operating a drive-in theater involves significant expenses for screen maintenance, lighting, projection, and parking management. Seasonal weather effects increase upkeep requirements and impact profit margins. Transitioning to digital projectors and LED systems demands substantial capital investment. Moreover, land costs for large outdoor areas are rising, especially in urban zones. Smaller operators face challenges in balancing maintenance costs with revenue generation. Addressing these operational inefficiencies is essential for ensuring long-term sustainability and profitability.
Limited Seasonal and Weather-Dependent Operations
Drive-in theaters remain highly dependent on favorable weather conditions for consistent operation. Extreme cold, heavy rain, or heat can reduce attendance and lead to temporary closures. This limits annual revenue potential, particularly in regions with shorter warm seasons. Operators are mitigating this challenge by introducing covered or partially enclosed screening setups and portable screens. However, these solutions require additional investment. Managing seasonal disruptions remains a key concern for maintaining profitability and steady audience engagement throughout the year.
Regional Analysis
North America
North America held a 38% share of the drive-in movie theater market in 2024, making it the leading region globally. The United States dominates due to a strong cultural affinity for drive-in entertainment and a large number of established venues. Rising demand for family-oriented outdoor experiences and investments in digital projection systems further support market expansion. Operators are integrating food services, themed events, and live performances to attract broader audiences. Continuous innovation and local government support for community recreation sustain North America’s leadership in the global drive-in movie theater industry.
Europe
Europe accounted for a 27% share of the drive-in movie theater market in 2024, driven by the rising trend of outdoor leisure and cultural events. Countries such as the United Kingdom, Germany, and France have seen rapid expansion of seasonal drive-in venues supported by technological upgrades and partnerships with local municipalities. Consumers increasingly favor eco-friendly and contactless entertainment experiences. Investments in mobile and pop-up drive-in setups are expanding access across suburban and rural areas. The region’s strong focus on experiential entertainment continues to strengthen the appeal of drive-in theaters.
Asia Pacific
Asia Pacific captured a 25% share of the drive-in movie theater market in 2024, emerging as the fastest-growing regional segment. Increasing urbanization, a rising middle-class population, and growing interest in social outdoor activities are fueling demand. Countries such as China, Japan, South Korea, and India are witnessing a surge in drive-in venues integrated within shopping complexes and recreational hubs. Technological advancements in digital projection and sound systems enhance viewer experiences. Government initiatives promoting tourism and leisure are further driving investments, positioning Asia Pacific as a key growth engine for the market.
Latin America
Latin America accounted for a 6% share of the drive-in movie theater market in 2024, supported by expanding middle-income populations and increasing interest in outdoor entertainment. Brazil, Mexico, and Argentina are the primary contributors, hosting seasonal events and mobile drive-in experiences. The affordability of medium-scale venues and lower operational costs attract independent operators. While infrastructure and weather challenges persist, urban development projects and cultural festivals are supporting moderate market growth. Collaborations between private investors and municipalities continue to enhance regional accessibility and viewing experiences.
Middle East & Africa
The Middle East & Africa region held a 4% share of the drive-in movie theater market in 2024, reflecting gradual but steady adoption. Countries such as the UAE, Saudi Arabia, and South Africa are investing in entertainment diversification and outdoor leisure infrastructure. The rise in tourism and premium lifestyle experiences is supporting drive-in expansion, especially within urban areas. Operators focus on luxury formats with advanced audio-visual systems and exclusive amenities. Although limited venue availability and climatic conditions pose challenges, strategic developments in mixed-use entertainment hubs are boosting future market potential.
Market Segmentations:
By Screen Size
- Up to 20 ft
- 20-50 ft
- Above 50 ft
By Area
By Technology
By Price
By Application
- Restaurant Parking Lots
- Theater Parking Lots
By Geography
- North America
- Europe
- Germany
- France
- U.K.
- Italy
- Spain
- Rest of Europe
- Asia Pacific
- China
- Japan
- India
- South Korea
- South-east Asia
- Rest of Asia Pacific
- Latin America
- Brazil
- Argentina
- Rest of Latin America
- Middle East & Africa
- GCC Countries
- South Africa
- Rest of the Middle East and Africa
Competitive Landscape
The drive-in movie theater market is moderately fragmented, featuring key players such as Galaxy Drive-In, Shankweiler’s Drive-In, Capri Drive-In, Coyote Drive-In and Canteen, Mesa Drive-In, Malco Theatres, Hull’s Drive-In, South Bay Drive-In, Delsea Drive-In, and Field of Dreams Drive-In. These operators compete through location accessibility, event variety, and enhanced viewer experiences. Leading venues focus on integrating digital projection, FM audio systems, and app-based ticketing to improve efficiency and audience engagement. Many are diversifying revenue streams by hosting live concerts, community events, and seasonal festivals. Partnerships with local food vendors and streaming platforms help attract new customers. Investments in comfort amenities, themed screenings, and family-focused experiences further strengthen brand loyalty. Continuous innovation, modernization, and community engagement remain critical strategies driving competitiveness across this evolving entertainment sector.
Shape Your Report to Specific Countries or Regions & Enjoy 30% Off!
Key Player Analysis
- Galaxy Drive-In
- Shankweiler’s Drive-In
- Capri Drive-In
- Coyote Drive-In and Canteen
- Mesa Drive-In
- Malco Theatres
- Hull’s Drive-In
- South Bay Drive-In
- Delsea Drive-In
- Field of Dreams Drive-In
Recent Developments
- In May 2025, Malco Theatres sold its Malco Summer Drive‑In in Memphis for 2.3 million USD, with the new owners restricted from operating a movie theatre without Malco’s consent for 20 years.
- In 2024, Delsea Drive‑In Movie Theatre in Vineland, New Jersey reopened its 2024 season and reinforced its status as the state’s only operating drive-in venue.
- In 2024, Capri Drive‑In Theatre near Coldwater, Michigan gained recognition on the National Register of Historic Places, becoming the first drive-in in Michigan with that status.
Report Coverage
The research report offers an in-depth analysis based on Screen Size, Area, Technology, Price, Application and Geography. It details leading market players, providing an overview of their business, product offerings, investments, revenue streams, and key applications. Additionally, the report includes insights into the competitive environment, SWOT analysis, current market trends, as well as the primary drivers and constraints. Furthermore, it discusses various factors that have driven market expansion in recent years. The report also explores market dynamics, regulatory scenarios, and technological advancements that are shaping the industry. It assesses the impact of external factors and global economic changes on market growth. Lastly, it provides strategic recommendations for new entrants and established companies to navigate the complexities of the market.
Future Outlook
- Demand for drive-in movie theaters will rise as outdoor entertainment continues to gain popularity.
- Digital projection and advanced audio systems will enhance the overall viewing experience.
- Operators will expand event offerings to include concerts, live shows, and cultural festivals.
- Family-oriented and community-driven entertainment formats will attract wider audiences.
- Smart ticketing and mobile payment systems will improve convenience and efficiency.
- Large-scale venues will maintain dominance due to higher capacity and profitability.
- North America will remain the leading region with strong infrastructure and consumer demand.
- Asia Pacific will experience rapid growth driven by urbanization and rising disposable incomes.
- Partnerships with food vendors and local businesses will enhance customer engagement.
- Sustainability initiatives and eco-friendly operations will become key focus areas for future expansion.


