Market Overview
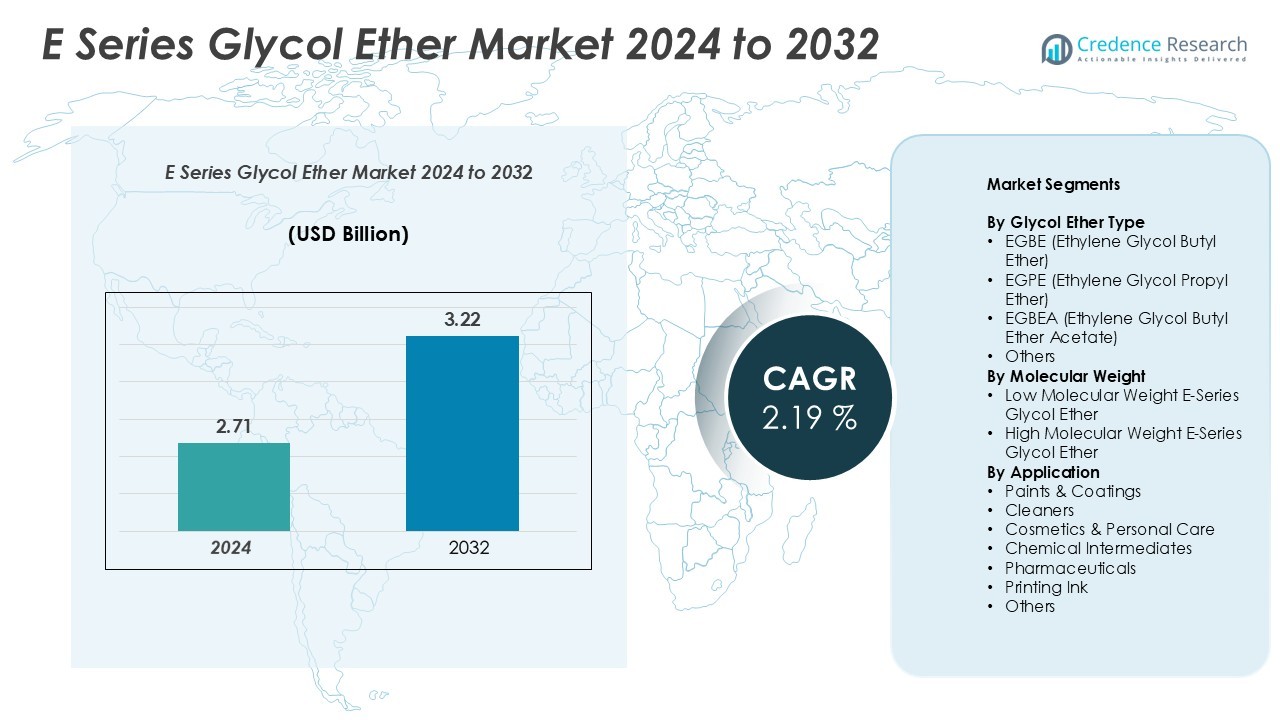
E Series Glycol Ether market size was valued USD 2.71 billion in 2024 and is anticipated to reach USD 3.22 billion by 2032, at a CAGR of 2.19% during the forecast period.
| REPORT ATTRIBUTE |
DETAILS |
| Historical Period |
2020-2023 |
| Base Year |
2024 |
| Forecast Period |
2025-2032 |
| E Series Glycol Ether Market Size 2024 |
USD 2.71 Billion |
| E Series Glycol Ether Market, CAGR |
2.19% |
| E Series Glycol Ether Market Size 2032 |
USD 3.22 Billion |
Leading suppliers include Dow, BASF, LyondellBasell, Eastman, Evonik, LG Chem, Solvay, INEOS, Huntsman, Daicel, Tosoh, and Mitsubishi Chemical Holdings. Players compete on integrated feedstocks, narrow-cut purity, and low-VOC performance, supported by global plants and technical service. Regionally, Asia Pacific dominates with a 41.3% market share, driven by construction, electronics, and packaging expansion. North America follows with 24.7%, supported by industrial hygiene and coatings reformulations, while Europe holds 21.8% due to strict environmental regulations and mature adoption of waterborne systems. Latin America and the Middle East & Africa each account for 6.1%, where infrastructure growth and rising consumer industries create emerging opportunities for glycol ether adoption.
Access crucial information at unmatched prices!
Request your sample report today & start making informed decisions powered by Credence Research Inc.!
Download Sample
Market Insights
- The E Series Glycol Ether market was valued at USD 2.71 billion in 2024 and is projected to reach USD 3.22 billion by 2032, growing at a CAGR of 2.19%. Asia Pacific leads with a 41.3% share, followed by North America at 24.7%, and Europe at 21.8%.
- Increasing demand for waterborne and low-VOC formulations drives the market. Regulations promoting sustainable coatings and cleaners support glycol ether adoption in paints, inks, and industrial hygiene products.
- Emerging trends include bio-based solvents, safer-label formulations, and expansion in high-solids and UV printing systems. Companies invest in greener chemistries and digital printing compatibility to meet evolving standards.
- The market is competitive, with Dow, BASF, Eastman, and LyondellBasell focusing on feedstock integration, purity grades, and low-VOC performance. Product innovation and regional tolling facilities enhance their reach and reliability.
- Feedstock volatility and stricter regulations pose restraints, but regional diversification strengthens supply chains. Asia Pacific dominates production and consumption, supported by strong construction and manufacturing growth.
Market Segmentation Analysis:
By Glycol Ether Type
EGBE leads this segment with a 32.6% share. Strong solvency drives use in waterborne coatings. Low odor and good coupling aid compliance with VOC targets. EGPE gains traction in inks and precision cleaners. Faster evaporation supports quick-dry lines. EGBEA serves premium coatings needing superior flow. Film formation benefits high-gloss finishes. “Others” cover specialty acetates for niche blends. Replacement of higher-toxicity solvents supports demand. Regulations and architectural repaint cycles reinforce EGBE’s lead.
- For instance, BASF Butylglycol (EGBE) boils at 173.5 °C and flashes at 67 °C.
By Molecular Weight
Low-molecular-weight grades dominate with a 54.8% share. These grades cut viscosity efficiently. Faster evaporation improves tack-free times. Strong wetting enhances pigment dispersion. Formulators prefer reliable coalescence in acrylic systems. High-molecular-weight grades suit slower-dry applications. Extended open time helps high-solids coatings. Balanced blends tailor flow and leveling. Emissions rules favor lower exposure profiles. Waterborne penetration sustains low-MW leadership across cleaners and paints.
- For instance, Eastman EEH solvent shows an evaporation rate of 0.003 and boils at 226 °C.
By Application
Paints and coatings hold the largest share at 26.7%. Coalescence support improves film formation. Flow and leveling upgrades raise finish quality. Cleaners remain a fast-growing use. Industrial hygiene and household care lift usage. Cosmetics and personal care need stable fragrance solubilization. Chemical intermediates and pharmaceuticals add steady demand. Printing inks benefit from controlled evaporation. Construction, automotive, and maintenance activity fuel consumption. VOC compliance keeps shifting systems toward E-series solvents.
Key Growth Drivers
Shift to Waterborne and Low-VOC Formulations
Regulations push manufacturers toward low-VOC systems. Waterborne coatings need effective coalescents and coupling solvents. E-series glycol ethers deliver strong solvency in aqueous systems. Formulators gain film formation without high emissions. EGBE supports flow, leveling, and open time. Compliance drives reformulation across paints and inks. Building and automotive refinish lines adopt waterborne lines widely. Hygiene products also favor low-odor solvents. Brands seek safer labels and greener chemistries. Procurement prefers globally available, consistent grades. E-series options meet cost and performance targets. This alignment sustains repeat demand from large users. Market growth follows ongoing VOC tightening worldwide.
- For instance, BASF butyl glycol acetate (EGBEA) lists a high-boiling solvent class with SDS-verified parameters.
Expansion in Cleaning and Industrial Hygiene
Cleaning demand rose across homes and industry. Facilities management requires fast, effective degreasing. E-series glycol ethers dissolve oils, resins, and inks. Low odor improves worker acceptance in enclosed spaces. Fast evaporation reduces residue and downtime. Precision cleaning benefits from controlled evaporation profiles. Electronics assembly needs consistent solvency for delicate parts. Food plants need aids compatible with sanitizers. Institutional buyers prefer multi-surface formulations. Retail brands push concentrated, water-miscible cleaners. E-series molecules enable stable, clear products. Logistics networks support broad regional availability. Hygiene budgets remain priorities for risk management. This spending supports steady solvent consumption.
- For instance, LyondellBasell DPNB has a boiling point of approximately 229 °C and a viscosity of 4.8 cP at 25 °C.
Emerging Market Manufacturing and Construction
Urbanization accelerates construction across Asia, Africa, and LATAM. Coatings volume expands with housing and infrastructure. E-series glycol ethers support waterborne architectural coatings. Contractors value faster return-to-service times. Better film formation reduces callbacks and defects. Local blender capacity continues to scale. Regional packaging and printing require compatible solvents. Industrial parks bring new maintenance demand. Appliance and furniture production need durable finishes. Import substitution policies favor local sourcing. Multinationals add regional tolling for resilience. E-series grades offer reliable global specifications. This footprint secures supply for large tenders. Construction pipelines extend multi-year solvent needs.
Key Trends & Opportunities
Bio-Based and Safer-Label Formulations
Sustainability programs now guide solvent choices. Buyers request bio-content disclosures from suppliers. Producers explore bio-routes for key intermediates. Safer-label certifications improve retail acceptance. Low odor and reduced hazard classes matter. E-series families can integrate bio-feedstocks gradually. Blenders market greener SKUs with verified claims. Corporate ESG targets prefer audited supply chains. Governments fund green chemistry pilots. Early movers win specification lock-ins. Premium pricing offsets development costs. Partnerships align resin, additive, and solvent upgrades. Clear lifecycle data unlocks institutional contracts. This pathway opens high-margin segments.
- For instance, Eastman Omnia is listed on the U.S. Environmental Protection Agency’s (EPA) Safer Chemical Ingredients List (SCIL). It is identified as a safe, high-performance solvent used in cleaning products.
High-Solids, UV, and Digital Printing Systems
Print and packaging migrate to faster curing lines. Digital presses need stable viscosity control. E-series glycol ethers aid pigment dispersion. Controlled evaporation supports nozzle reliability. Low residue helps printhead health. UV and EB systems still need co-solvents. Color consistency improves with balanced solvency. Flexible packaging requires adhesion optimization. Food packaging needs low odor profiles. Regulatory screens drive careful selection. Suppliers tailor narrow-cut grades for printrooms. Service bundles include on-site optimization. These advances unlock premium print applications. Volumes rise with e-commerce packaging growth.
- For instance, LyondellBasell’s data for DPnP (dipropylene glycol n-propyl ether) shows a viscosity of 4.4 mPa·s (cP) at 25°C and a vapor pressure of 0.05 mmHg (or 0.05 torr) at 20°C.
Pharmaceutical and Personal Care Grades
Pharma pipelines seek reliable solvent excipients. E-series grades offer defined purity options. Low odor benefits topical formulations. Fragrance solubilization needs consistent polarity. Emulsion stability improves with proper coupling. Compliance requires pharmacopeial documentation. Suppliers provide batch traceability and audits. Personal care brands need clarity and feel. Rinse-off products value faster evaporation. Global brands demand identical specs worldwide. Regional tolling shortens lead times. Technical support speeds reformulation cycles. These features attract regulated buyers. Premium grades command defensible margins.
Key Challenges
Regulatory Scrutiny and Substance Restrictions
Authorities review glycol ether toxicology. Some ethylene-series molecules face stricter limits. REACH and state rules tighten exposures. Workplace controls increase operating costs. Labels with hazard statements hinder adoption. Customers seek safer alternatives quickly. P-series solvents compete in reformulations. Coalescent technologies also challenge demand. Suppliers must offer compliant substitutes. Toxicological data packages require investment. Portfolio pruning may reduce choices. Education helps customers manage risk. Regulatory uncertainty complicates forecasting. This pressure can slow segment growth.
Feedstock Volatility and Margin Compression
Feedstocks track ethylene oxide and alcohol markets. Outages disrupt propylene oxide economics indirectly. Freight spikes raise delivered costs. Currency shifts affect import viability. Buyers negotiate shorter pricing windows. Inventories become harder to manage. Blenders switch between similar solvents. Competing coalescents pressure pricing tiers. Producers face higher working capital needs. Contract indexation lags real costs. Margins tighten during rapid spikes. Hedging tools only partly offset risk. Diversified sourcing improves resilience. Still, volatility challenges long-term planning.
Regional Analysis
Asia Pacific:
Asia Pacific leads with a 41.3% share. Strong construction activity lifts coatings demand. Electronics manufacturing supports precision cleaners and inks. China expands waterborne coatings capacity rapidly. India scales architectural repaint cycles nationwide. Southeast Asia adds regional blending hubs. EGBE adoption rises with VOC curbs. Local sourcing reduces supply risk. Packaging growth boosts printing ink usage. Multinationals expand tolling to serve faster. Distributors widen grade availability across tiers.
North America:
North America holds a 24.7% share. Waterborne technologies dominate reformulations. Automotive refinish favors fast-dry glycol ethers. Facility hygiene budgets remain elevated. Food plants require low-odor cleaning aids. Digital printing supports controlled evaporation needs. Resin upgrades align with solvent coupling. ESG goals steer safer-label choices. Supply chains use multi-plant redundancy. Specialty grades secure premium contracts. End users value technical service programs.
Europe:
Europe accounts for a 21.8% share. REACH compliance shapes solvent selection. Waterborne coatings adoption is mature. Industrial maintenance sustains steady volumes. Packaging print remains a key outlet. Fragrance solubilization supports personal care lines. Producers promote bio-content roadmaps. Energy costs influence plant economics. Distributors optimize narrow-cut portfolios. OEM specifications lock in E-series grades. Circularity goals favor low-VOC systems.
Latin America:
Latin America captures a 6.1% share. Construction pipelines drive architectural coatings. Local ink converters support packaging growth. Industrial cleaners expand with new logistics hubs. Import substitution policies aid regional blending. EGBE leads waterborne transitions in paint. Retail hygiene products gain shelf space. Currency swings affect sourcing strategies. Suppliers add smaller pack sizes. Technical training accelerates reformulation. Distributors deepen inventory coverage.
Middle East & Africa:
Middle East and Africa hold a 6.1% share. Infrastructure projects lift coatings use. Industrial parks raise cleaner demand. Packaging and labels support printing inks. Low-odor profiles suit indoor applications. VOC frameworks advance in key markets. Regional tolling reduces lead times. Multinationals partner with local blenders. Pharma and personal care add niche demand. Distributors build solvent safety programs. Supply diversification improves resilience.
Market Segmentations:
By Glycol Ether Type
- EGBE (Ethylene Glycol Butyl Ether)
- EGPE (Ethylene Glycol Propyl Ether)
- EGBEA (Ethylene Glycol Butyl Ether Acetate)
- Others
By Molecular Weight
- Low Molecular Weight E-Series Glycol Ether
- High Molecular Weight E-Series Glycol Ether
By Application
- Paints & Coatings
- Cleaners
- Cosmetics & Personal Care
- Chemical Intermediates
- Pharmaceuticals
- Printing Ink
- Others
By Geography
- North America
- Europe
- Germany
- France
- U.K.
- Italy
- Spain
- Rest of Europe
- Asia Pacific
- China
- Japan
- India
- South Korea
- South-east Asia
- Rest of Asia Pacific
- Latin America
- Brazil
- Argentina
- Rest of Latin America
- Middle East & Africa
- GCC Countries
- South Africa
- Rest of the Middle East and Africa
Competitive Landscape
Competition centers on performance, regulatory compliance, and assured supply. Dow, BASF, and LyondellBasell leverage integrated feedstocks and global plants. Eastman and Evonik prioritize specialty cuts and strong application support. LG Chem, Solvay, and INEOS strengthen regional reach through partnerships. Huntsman, Daicel, and Tosoh focus on niche grades and high purity. Producers invest in low-VOC compatibility for waterborne systems. Bio-based routes and safer-label lines create premium differentiation. Technical service teams co-develop recipes with major coatings and cleaner brands. Preferred status follows audited quality systems and REACH readiness. Pricing balances feedstock swings using indexation and shorter contracts. Local tolling reduces lead times and imports risk in growth markets. M&A targets backward integration, specialty portfolios, and channel expansion. Vendors also expand digital tools for demand planning and support.
Shape Your Report to Specific Countries or Regions & Enjoy 30% Off!
Key Player Analysis
- Huntsman
- Tosoh
- Eastman Chemical Company
- Evonik
- LG Chem
- INEOS
- Daicel
- LyondellBasell
- Solvay
- BASF
- Dow Chemical Company
- Mitsubishi Chemical Holdings
Recent Developments
- In September 2023, LyondellBasell introduced its +LC (Low Carbon) solutions, a new line of chemicals made from recycled and renewable feedstocks. These are aimed at helping businesses create more sustainable products and achieve emissions reduction targets.
- In September 2022, INEOS expanded its P-Series Glycol Ether portfolio to address the increasing demand in key downstream markets and has successfully completed its first sales.
Report Coverage
The research report offers an in-depth analysis based on Glycol Ether Type, Molecular Weight, Application, and Geography. It details leading market players, providing an overview of their business, product offerings, investments, revenue streams, and key applications. Additionally, the report includes insights into the competitive environment, SWOT analysis, current market trends, as well as the primary drivers and constraints. Furthermore, it discusses various factors that have driven market expansion in recent years. The report also explores market dynamics, regulatory scenarios, and technological advancements that are shaping the industry. It assesses the impact of external factors and global economic changes on market growth. Lastly, it provides strategic recommendations for new entrants and established companies to navigate the complexities of the market.
Future Outlook
- Demand will rise for low-VOC solvents across paints, coatings, and cleaning industries.
- Bio-based glycol ethers will gain preference as brands align with sustainability goals.
- Digital and UV printing applications will expand due to improved solvent compatibility.
- Regulatory compliance will continue to shape product formulations and labeling strategies.
- Manufacturers will enhance feedstock integration to stabilize production and margins.
- Asia Pacific will maintain its leadership supported by construction and manufacturing expansion.
- Europe will focus on REACH-compliant, low-toxicity formulations with circular economy goals.
- North America will drive innovation in high-purity and multi-functional glycol ether grades.
- Companies will invest in greener synthesis routes and renewable chemical pathways.
- Partnerships between resin, coating, and solvent producers will boost system-level performance improvements.


