
Market Overview:
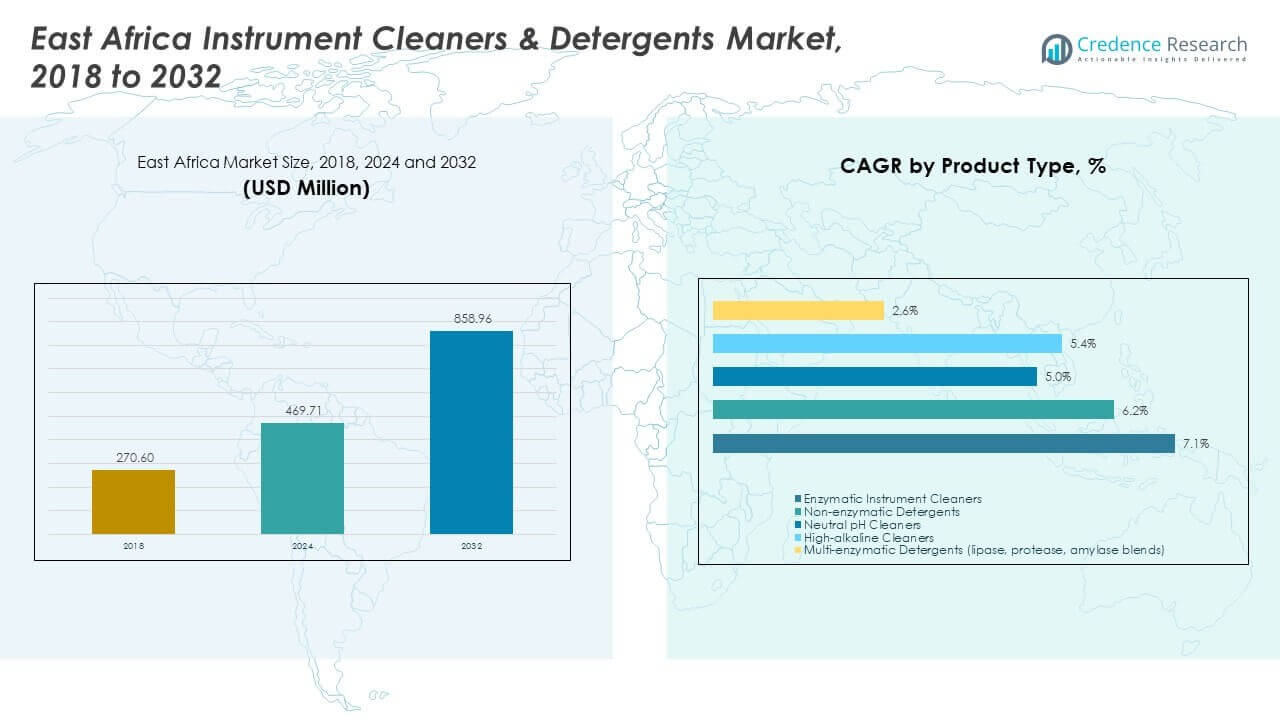
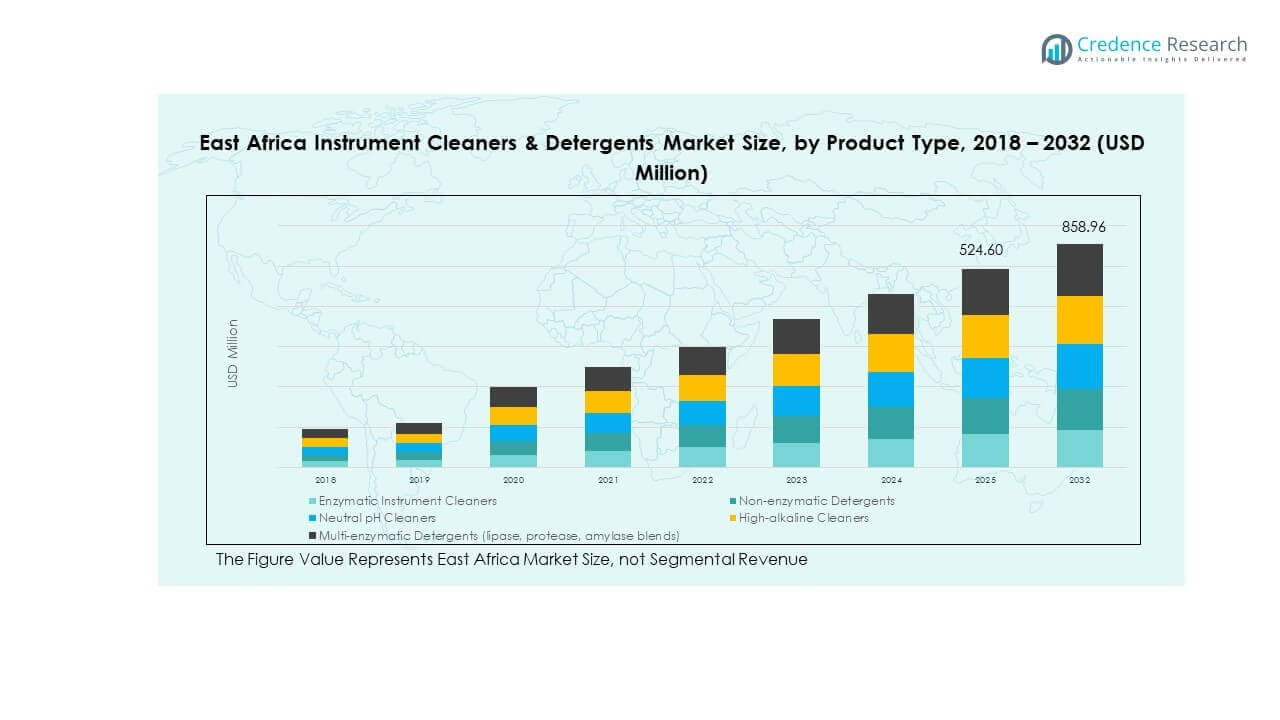
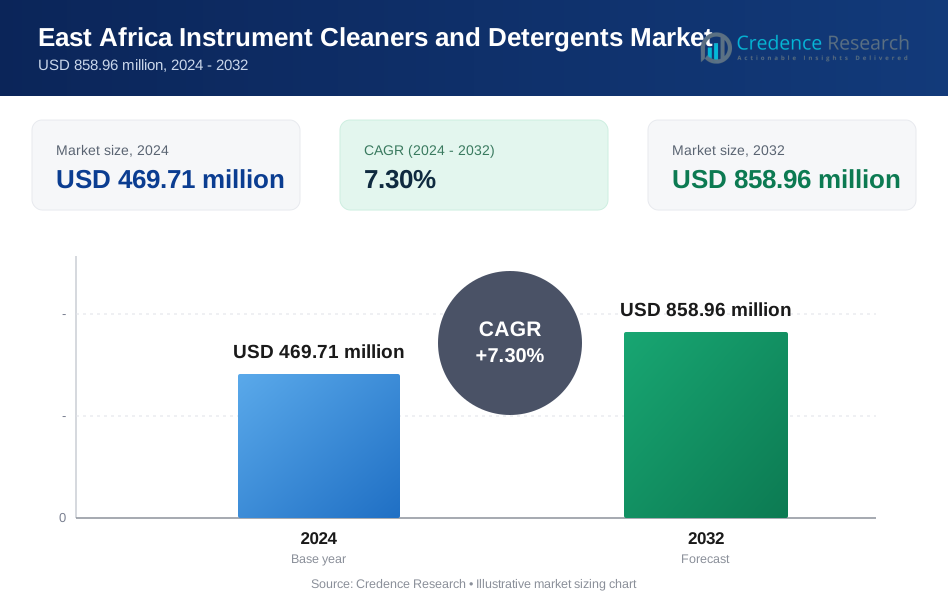
The East Africa Instrument Cleaners & Detergents Market size was valued at USD 270.60 million in 2018 to USD 469.71 million in 2024 and is anticipated to reach USD 858.96 million by 2032, at a CAGR of 7.30% during the forecast period.
| REPORT ATTRIBUTE | DETAILS |
|---|---|
| Historical Period | 2020-2023 |
| Base Year | 2024 |
| Forecast Period | 2025-2032 |
| East Africa Instrument Cleaners and Detergents Market Size 2024 | USD 469.71 million |
| East Africa Instrument Cleaners and Detergents Market , CAGR | 7.30% |
| East Africa Instrument Cleaners and Detergents Market Size 2032 | USD 858.96 million |
Market growth is driven by stricter infection control practices across hospitals and diagnostic laboratories. Healthcare facilities increasingly adopt validated cleaning agents to reduce cross-contamination risks. Rising surgical volumes increase demand for effective instrument reprocessing solutions. Food and beverage processors also require certified detergents to meet safety audits. Urbanization supports healthcare infrastructure expansion across major cities. Training programs raise awareness of proper instrument hygiene practices. Manufacturers invest in low-residue and enzyme-based formulations. Regulatory oversight further strengthens routine usage patterns.
Kenya and Ethiopia lead the regional market due to stronger healthcare infrastructure development. These countries benefit from higher hospital density and expanding private healthcare investment. Tanzania follows with steady adoption across public hospitals and laboratories. Rwanda and Uganda emerge as fast-developing markets due to health sector reforms. International aid programs improve sterilization standards in public facilities. Urban centers show higher penetration than rural areas. Local distributors play a key role in market access. Regional supply chains continue to strengthen.
Market Insights:
- The East Africa Instrument Cleaners & Detergents Market was valued at USD 270.60 million in 2018, reached USD 469.71 million in 2024, and is projected to hit USD 858.96 million by 2032, expanding at a CAGR of 7.30% driven by sustained institutional demand.
- Kenya and Ethiopia together account for about 48% share of the East Africa Instrument Cleaners & Detergents Market due to stronger healthcare infrastructure, higher hospital density, and established distributor networks.
- Tanzania and Uganda jointly hold nearly 27% share of the East Africa Instrument Cleaners & Detergents Market, supported by public healthcare upgrades, expanding diagnostics, and improving procurement systems.
- Rwanda represents the fastest-growing region with close to 10% share in the East Africa Instrument Cleaners & Detergents Market, driven by health sector reforms, donor-funded programs, and rapid urban healthcare expansion.
- By product type, enzymatic and multi-enzymatic cleaners together contribute around 55% share of the East Africa Instrument Cleaners & Detergents Market, while high-alkaline and non-enzymatic cleaners account for about 45%, reflecting balanced demand across cleaning intensities.
Market Drivers:
Rising Healthcare Infrastructure Expansion Across East African Economies
Hospitals and clinics expand across urban and secondary cities. New facilities increase demand for certified cleaning solutions. Surgical procedures rise across public and private hospitals. Infection prevention protocols receive stronger enforcement. Procurement teams prefer standardized detergent products. Training programs promote proper instrument hygiene practices. Suppliers gain steady institutional contracts. The East Africa Instrument Cleaners & Detergents Market benefits from this expansion.
- For instance, Ecolab reported deployment of its instrument cleaning programs in over 3 million hospital beds globally, supported by standardized washer-disinfector protocols that cut rewash rates by up to 30% in audited facilities.
Growing Focus On Infection Control And Patient Safety Standards
Healthcare authorities stress strict sterilization and cleaning routines. Instrument contamination risks draw regulatory attention. Hospitals adopt validated detergents for routine cleaning cycles. Audit requirements push consistent product usage. Accreditation goals influence purchasing decisions. Staff follow defined reprocessing workflows. Demand rises for reliable chemical formulations. Product quality gains higher priority.
- For instance, STERIS validated its enzymatic detergents to achieve >99% protein soil removal in standardized test loads, supporting compliance with ISO 15883 washer-disinfector performance requirements.
Expansion Of Diagnostic Laboratories And Medical Testing Facilities
Diagnostic centers increase across major cities. Laboratory instruments require frequent surface cleaning. Sample accuracy depends on contamination control. Cleaning protocols support reliable test outcomes. Private labs invest in premium detergents. Public labs follow donor-backed hygiene standards. Equipment longevity improves with proper cleaning. Market demand strengthens across laboratory segments.
Growth In Food Processing And Pharmaceutical Manufacturing Activities
Food safety rules require strict equipment hygiene. Processing plants adopt specialized cleaning chemicals. Pharmaceutical units maintain cleanroom discipline. Compliance audits enforce detergent usage frequency. Export-oriented producers follow global standards. Industrial buyers prefer bulk supply contracts. Local manufacturing hubs drive steady consumption. This supports long-term market stability.
Market Trends:
Shift Toward Enzyme-Based And Low-Residue Cleaning Formulations
Manufacturers promote enzyme-based detergent solutions. These products support delicate instrument surfaces. Residue-free cleaning improves reusability. Healthcare staff value reduced rinse cycles. Water conservation supports adoption. Product labels highlight material compatibility. Buyers prefer safer chemical profiles. The East Africa Instrument Cleaners & Detergents Market reflects this shift.
- For instance, Getinge documented that its multi-enzymatic cleaners enabled effective cleaning at 40–50°C, lowering thermal stress on instruments while maintaining validated soil removal performance.
Rising Preference For Ready-To-Use And Pre-Measured Solutions
Facilities seek operational simplicity. Pre-measured detergents reduce dosage errors. Staff training becomes easier. Consistency improves across cleaning cycles. Time efficiency supports adoption. Smaller clinics favor ready-to-use formats. Packaging innovation supports this trend. Supply chains adapt to varied pack sizes.
- For instance, 3M Healthcare (now Solventum) introduced the 3M™ Flow Control Chemical Management System, which is 55% to 60% more accurate at diluting chemical concentrates than the nearest competitive system, effectively reducing dosing variability in facilities like hospitals.
Increased Participation Of Local Distributors And Private Label Brands
Local distributors expand healthcare portfolios. Private label detergents gain shelf presence. Competitive pricing attracts cost-sensitive buyers. Regional brands tailor products to local needs. Faster delivery improves customer retention. Distributors provide training support. Market competition intensifies across urban centers. Brand loyalty evolves steadily.
Gradual Adoption Of Environment-Friendly And Safer Chemical Profiles
Sustainability awareness rises among institutions. Buyers assess environmental impact of detergents. Low-toxicity products gain preference. Wastewater concerns influence purchasing policies. Manufacturers highlight biodegradable attributes. Donor-funded hospitals favor green products. Safety data sheets guide procurement. This trend gains steady traction.
Market Challenges Analysis:
Price Sensitivity And Budget Constraints Across Public Healthcare Systems
Public hospitals operate under limited budgets. Procurement teams prioritize cost over performance. Premium detergents face adoption resistance. Tender cycles delay supplier payments. Imported products face pricing pressure. Currency volatility affects landed costs. Small facilities seek low-cost alternatives. The East Africa Instrument Cleaners & Detergents Market faces margin pressure.
Limited Technical Training And Inconsistent Cleaning Practices
Staff training varies across facilities. Improper dilution reduces product effectiveness. Inconsistent protocols affect cleaning outcomes. Rural centers lack technical guidance. Equipment damage occurs due to misuse. Monitoring systems remain weak. Suppliers invest in on-site demonstrations. Adoption quality differs by location.
Market Opportunities:
Expansion Of Private Healthcare And Specialty Clinics In Urban Areas
Private hospitals expand service offerings. Specialty clinics increase procedure volumes. These facilities prefer branded detergents. Quality assurance influences purchasing decisions. Faster adoption supports premium segments. Long-term supply contracts gain importance. Urban demand drives volume growth. The East Africa Instrument Cleaners & Detergents Market gains new buyers.
Partnership Opportunities With Training Institutions And Healthcare Programs
Suppliers partner with training institutes. Education improves correct product usage. Demonstration programs build trust. Government health programs support standardization. Donor-funded projects adopt certified detergents. Brand visibility improves through training support. Long-term adoption strengthens supplier presence. Market penetration improves steadily.
Market Segmentation Analysis:
By Product Type
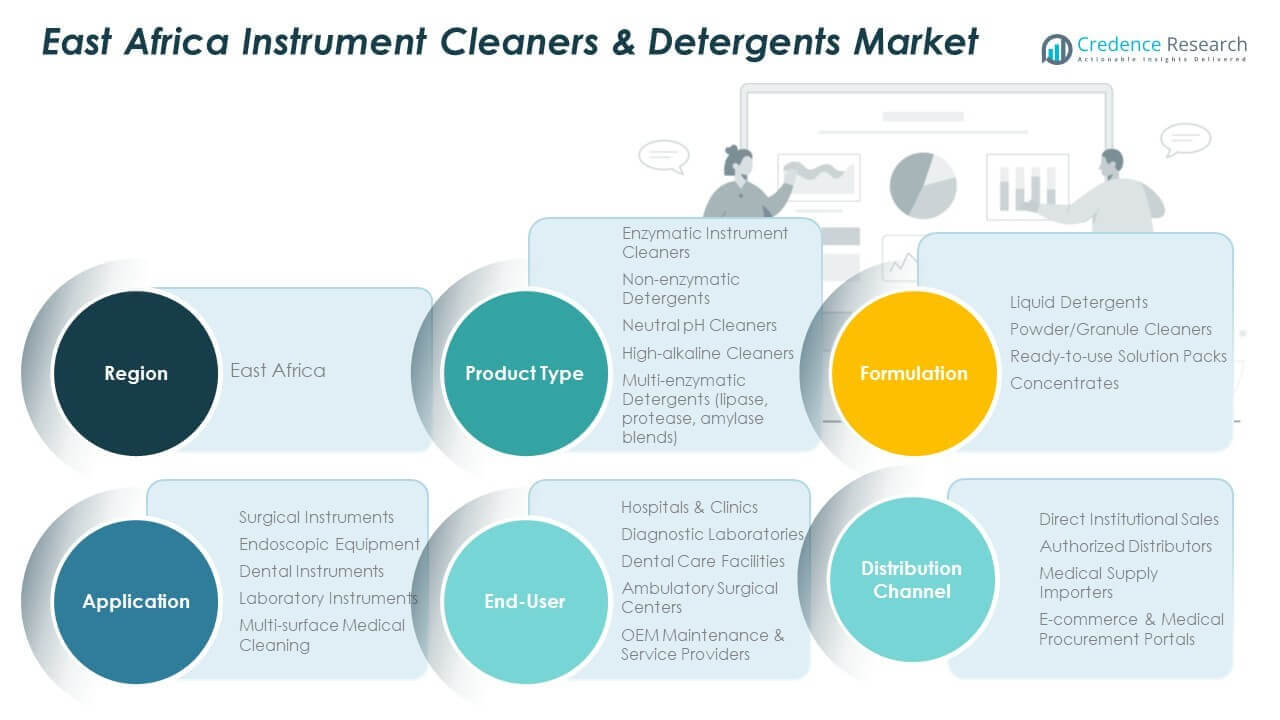
Enzymatic cleaners see wide use in hospitals due to gentle soil removal. These products protect delicate instruments. Acidic cleaners address scale and mineral buildup in washers. Alkaline cleaners handle heavy organic residue in high-throughput settings. Disinfectants support infection control after cleaning stages. Specialty detergents serve automated systems and niche equipment. The East Africa Instrument Cleaners & Detergents Market reflects balanced demand across these categories.
- For instance, METREX enzyme detergents demonstrated effective removal of blood soils within 5 minutes in standardized clinical reprocessing tests.
By Formulation
Liquid formulations lead due to ease of dosing and fast solubility. Staff prefer liquids for routine workflows. Powder formats attract cost-focused buyers and bulk users. Storage stability supports adoption in industrial sites. Concentrated products gain traction for space efficiency. Lower transport volume appeals to distributors. It benefits from improved handling practices.
- For instance, Diversey reported that its concentrated liquid detergents reduced packaging material use by over 50% per functional wash cycle while maintaining validated cleaning efficacy.
By Application
Healthcare remains the primary application due to strict hygiene rules. Medical instrument reprocessing drives steady usage. Industrial manufacturing follows with machinery and tool cleaning needs. Food service relies on approved detergents for audits. Commercial cleaning supports offices and institutions. Urban growth expands service demand. It shows diversified end-use exposure.
By End-User
Hospitals and clinics dominate consumption volumes. Diagnostic laboratories require frequent surface cleaning. Manufacturing facilities focus on equipment efficiency. Food processing units maintain safety compliance. Commercial service providers serve multi-site contracts. Procurement varies by budget and scale. It aligns with institutional purchasing patterns.
By Distribution Channel
Direct sales serve large healthcare accounts. Distributors and wholesalers provide regional reach. Online procurement platforms gain gradual acceptance. Buyers value availability and support. Logistics reliability shapes channel choice. It rewards strong local networks.
Segmentation:
By Product Type- Enzymatic cleaners
- Acidic cleaners
- Alkaline cleaners
- Disinfectants
- Specialty detergents
- Liquid
- Powder
- Concentrated
- Healthcare (medical instruments)
- Industrial (manufacturing)
- Food service
- Commercial cleaning
- Hospitals and clinics
- Diagnostic laboratories
- Manufacturing facilities
- Food processing units
- Commercial service providers
- Direct sales
- Distributors and wholesalers
- Online procurement platforms
- Kenya
- Ethiopia
- Tanzania
- Uganda
- Rwanda
- Burundi
- South Sudan
- Somalia
Regional Analysis:
Kenya And Ethiopia As Primary Revenue Contributors
Kenya and Ethiopia together account for nearly 48% of the regional market share. Kenya leads due to a mature private healthcare sector and strong distributor networks. Ethiopia follows with rapid hospital expansion and public health investments. Urban centers drive higher product consumption. Regulatory oversight supports standardized cleaning protocols. Import availability improves product access. The East Africa Instrument Cleaners & Detergents Market gains stability from these two countries.
Tanzania And Uganda As Established Growth Markets
Tanzania and Uganda jointly hold around 27% market share. Tanzania benefits from steady public healthcare upgrades. Diagnostic laboratories expand across major cities. Uganda shows rising adoption in private hospitals and clinics. Training initiatives improve cleaning compliance. Industrial activity supports non-healthcare demand. Distribution reach remains a key growth factor.
Emerging Markets Including Rwanda, Burundi, And Others
Rwanda, Burundi, South Sudan, and Somalia together represent about 25% share. Rwanda leads this group due to health sector reforms. International aid programs improve hygiene standards. Smaller markets show gradual adoption patterns. Limited budgets affect premium product uptake. Urban facilities adopt faster than rural centers. These markets offer long-term growth potential.
Key Player Analysis:
- 3M Healthcare
- STERIS Corporation
- Ecolab Inc.
- Getinge AB
- METREX
Competitive Analysis:
The East Africa Instrument Cleaners & Detergents Market shows moderate fragmentation with global and regional players competing on reach and reliability. Multinational firms leverage strong brand trust, broad portfolios, and technical support. Regional manufacturers compete through pricing and local distribution strength. Companies focus on healthcare and institutional buyers for stable volumes. Product consistency and regulatory compliance guide purchasing decisions. Strategic distributor partnerships improve last-mile access. It rewards suppliers that provide training and after-sales support. Competitive positioning depends on portfolio depth and supply continuity across countries.
Recent Developments:
- Product Launch: Automatiq Automation Platform – December 19, 2025: Getinge unveiled Automatiq, a groundbreaking family of next-generation automated solutions specifically designed to help Central Sterile Supply Departments (CSSDs) achieve safer, more consistent, and less labor-intensive sterile reprocessing. This comprehensive system seamlessly combines smart robotics, intelligent conveyor systems, and advanced software to optimize sterile reprocessing workflows. The platform includes the self-navigating Automatiq Envoy mobile robot that reduces manual handling between workstations, the intelligent Automatiq Depot buffer and workstation that improves workflow balance, and the Automatiq Loaders that ensure precise, reliable loading and unloading. The entire system is orchestrated by the Automatiq Hub software, which enables compatibility with third-party automation providers and traceability systems for data-driven reprocessing optimization.
- Acquisition: Acera Surgical Acquisition for Advanced Wound Care – November 20, 2025: Solventum announced a definitive agreement to acquire Acera Surgical, a privately held bioscience company focused on developing and commercializing fully engineered materials for regenerative wound care, in a transaction valued at $725 million in upfront cash plus up to $125 million in contingent payments based on achieving specific milestones. This strategic acquisition strengthens Solventum's leadership in advanced wound care by introducing Acera's Restrata synthetic tissue matrices portfolio to the acute care market, leveraging Solventum's global footprint and specialized wound care capabilities.
- Product Launch: Aquadis 44 Washer-Disinfector – November 13, 2025: In response to mounting pressures on healthcare facilities to reduce environmental impact while maintaining clinical quality, Getinge launched the Aquadis 44, its latest utility-efficient washer-disinfector designed to minimize utility consumption and lower operating costs. This innovative model features patent-pending adaptive water filling technology that automatically adjusts water and detergent amounts based on the load, ensuring consistent cleaning performance while significantly reducing energy, water, and detergent consumption. Available in both single and double-door configurations, the Aquadis 44 is engineered with ergonomic loading and user-friendly interfaces to reduce strain on healthcare staff while supporting efficient workflows.
Report Coverage:
The research report offers an in-depth analysis based on product type, formulation, application, end-user, distribution channel, and country segments. It details leading market players, providing an overview of their business, product offerings, investments, revenue streams, and key applications. Additionally, the report includes insights into the competitive environment, SWOT analysis, current market trends, as well as the primary drivers and constraints. Furthermore, it discusses various factors that have driven market expansion in recent years. The report also explores market dynamics, regulatory scenarios, and technological advancements that are shaping the industry. It assesses the impact of external factors and global economic changes on market growth. Lastly, it provides strategic recommendations for new entrants and established companies to navigate the complexities of the market.
Future Outlook:
- Healthcare infrastructure expansion continues to support steady product demand.
- Private hospitals increase preference for branded and validated detergents.
- Distributor networks strengthen across secondary cities.
- Training-led sales models gain importance among suppliers.
- Local manufacturing improves pricing competitiveness.
- Automated cleaning systems drive specialty detergent demand.
- Environmental compliance shapes product formulation choices.
- Industrial and food service applications show gradual uptake.
- Public procurement favors reliable long-term suppliers.
- Regional integration improves cross-border product availability.
Request a Free Sample
Fill in your details and we'll send you a free sample report.
- Sample data tables & charts
- Research methodology
Need a Custom Version of This Report?
Tailor the scope, geography, or segments to your exact requirements.
- Custom geography or segment scope
- Direct access to our analyst team
Frequently Asked Questions
What is the current market size and projected size in 2032?
At what CAGR is the market projected to grow between 2024 and 2032?
Which segment held the largest share in 2024?
What factors fuel market growth?
Who are the leading companies?
Which region led the market in 2024?
Table of Content
Chapter 1. Report Introduction
- 1.1 Report Description & Purpose
- 1.1.1 Report Title & Market Definition
- 1.1.2 Unique Selling Propositions (USP) & Key Differentiators
- 1.1.3 Value Proposition for Stakeholders
- 1.2 Research Objectives
- 1.2.1 Market Sizing Objectives (Volume & Revenue)
- 1.2.2 Segmentation Objectives
- 1.2.3 Competitive Intelligence Objectives
- 1.2.4 Forecast & Scenario Objectives
- 1.3 Report Scope
- 1.3.1 East Africa Instrument Cleaners and Detergents Scope – Types & Subtypes Covered
- 1.3.2 Geographic Scope – Regions & Countries Covered
- 1.3.3 Historical Period, Base Year & Forecast Period (2024; forecast to 2032)
- 1.3.4 Inclusions & Exclusions
- 1.4 HS Code & Classification Framework
- 1.5 Currency, Units & Pricing Basis
- 1.6 Target Stakeholders
- 1.7 Limitations & Assumptions
Chapter 2. Executive Summary
- 2.1 Global East Africa Instrument Cleaners and Detergents Market Snapshot
- 2.1.1 Market Size – Historical (2024) & Forecast (2024-2032) (2024: USD 469.71 million → 2032: USD 858.96 million)
- 2.1.2 Volume & Revenue – Global Totals
- 2.1.3 Key Market Highlights – Top Five Facts
- 2.2 East Africa Instrument Cleaners and Detergents Market Segmentation Snapshot
- 2.2.1 Market Split by Region – 2024 vs. 2032
- 2.3 Competitive Snapshot
- 2.3.1 Top 10 Players by Revenue Share – 2024
- 2.3.2 Top 10 Players by Volume Share – 2024
- 2.3.3 Recent Strategic Developments (18-Month Summary)
- 2.4 Key Investment Highlights & Strategic Conclusions
Chapter 3. East Africa Instrument Cleaners and Detergents Market Dynamics & Industry Analysis
- 3.1 Market Overview & Context
- 3.1.1 East Africa Instrument Cleaners and Detergents Market Position in the Broader Automotive Value Chain
- 3.1.2 OEM vs. Replacement Market Dynamics
- 3.1.3 Market Maturity & Development Stage by Region
- 3.2 East Africa Instrument Cleaners and Detergents Market Drivers
- 3.3 East Africa Instrument Cleaners and Detergents Market Restraints & Challenges
- 3.4 East Africa Instrument Cleaners and Detergents Market Opportunities
- 3.5 Porter's Five Forces Analysis
- 3.5.1 Threat of New Entrants
- 3.5.2 Bargaining Power of Suppliers
- 3.5.3 Bargaining Power of Buyers
- 3.5.4 Threat of Substitutes
- 3.5.5 Competitive Rivalry – Intensity Assessment
- 3.6 East Africa Instrument Cleaners and Detergents Value Chain Analysis
- 3.6.1 Upstream – Raw Material/Input Suppliers
- 3.6.1.1 Raw Material/Input 1
- 3.6.1.2 Raw Material/Input 2
- 3.6.1.3 Raw Material/Input 3
- 3.6.2 Midstream – Production/Manufacturing/Service Delivery
- 3.6.2.1 Production/Process Overview
- 3.6.2.2 Key Facility Locations & Capacity by Manufacturer
- 3.6.3 Downstream – Distribution & End Consumer
- 3.6.3.1 Primary Channel – B2B/OEM
- 3.6.3.2 Secondary Channels – Dealer, Retail, Online, Direct
- 3.6.4 Value Chain Profitability Analysis
- 3.6.1 Upstream – Raw Material/Input Suppliers
- 3.7 PESTEL Analysis
- 3.7.1 Political Factors
- 3.7.2 Economic Factors
- 3.7.3 Social Factors
- 3.7.4 Technological Factors
- 3.7.5 Environmental Factors
- 3.7.6 Legal Factors
- 3.8 East Africa Instrument Cleaners and Detergents Supply Chain Analysis
- 3.8.1 Raw Material/Input Supply Risk Assessment
- 3.8.2 Manufacturing Concentration Risk (Geographic Exposure)
- 3.8.3 Trade Disruption Impact Analysis
- 3.9 Regulatory & Policy Landscape
Note: The regulatory and policy landscape section covers regulations based on their applicability to the market, East Africa Instrument Cleaners and Detergents category, geography, and scope of the study. Only regulatory frameworks with a material impact on operations, compliance, trade, sustainability, or market access are analyzed in detail.
Chapter 4. Key Investment Pockets & Opportunity Analysis
- 4.1 East Africa Instrument Cleaners and Detergents Market Attractiveness Analysis
- 4.1.1 By Region – Investment Attractiveness Matrix (Volume × CAGR)
- 4.2 Absolute Revenue Growth Opportunity
- 4.2.1 By Region – Absolute USD Growth Through 2032
- 4.3 Incremental Volume Opportunity
- 4.3.1 By Region – Incremental Volume Through 2032
- 4.3.2 Segment – Incremental Volume
- 4.4 Emerging Submarket Opportunity Deep Dive (Subject to Applicability)
- 4.5 Emerging Market Opportunity Scorecards
- 4.5.1 United States
- 4.5.2 Europe
- 4.5.3 Asia
- 4.5.4 Middle East & Africa
Note: Emerging Market Opportunity Scorecards will be included based on relevance and strategic importance. Regions listed are indicative and may vary depending on data availability and market dynamics.
Chapter 5. East Africa Instrument Cleaners and Detergents Import-Export Analysis & Trade Flows
- 5.1 Global Trade Overview
- 5.1.1 Global Export Value by Country (2024)
- 5.1.2 Global Export Volume by Country (2024)
- 5.1.3 Global Import Value by Country (2024)
- 5.1.4 Global Import Volume by Country (2024)
- 5.1.5 Net Trade Balance by Country (2024)
- 5.2 Export Analysis – Segment
- 5.2.1 Type 1 (HS Code)
- 5.2.2 Type 2 (HS Code)
- 5.2.3 Type 3 (HS Code)
- 5.2.4 Type 4 (HS Code)
- 5.2.5 Type 5 (HS Code)
- 5.3 Import Analysis – Segment
- 5.3.1 Type 1 (HS Code)
- 5.3.2 Type 2 (HS Code)
- 5.3.3 Type 3 (HS Code)
- 5.3.4 Type 4 (HS Code)
- 5.3.5 Type 5 (HS Code)
- 5.4 Average Unit Trade Prices
- 5.4.1 Average Export Price – Segment & Country
- 5.4.2 Average Import Price – Segment & Source Country
- 5.4.3 Price Trends (2024)
- 5.5 Key Trade Route Analysis
- 5.5.1 Trade Route 1
- 5.5.2 Trade Route 2
- 5.5.3 Trade Route 3
- 5.5.4 Trade Route 4
- 5.5.5 Trade Route 5
- 5.6 Trade Policy Impact Assessment
- 5.6.1 US Anti-Dumping & Section 301 Tariffs
- 5.6.2 EU Customs Union Impact
- 5.6.3 Major Free Trade Agreements
- 5.6.4 USMCA Rules of Origin
Note: Trade policy analysis will be included only where relevant to the East Africa Instrument Cleaners and Detergents market.
Chapter 6. Competitive Landscape & Company Benchmarking
- 6.1 East Africa Instrument Cleaners and Detergents Market Concentration & Structure
- 6.1.1 Herfindahl-Hirschman Index (HHI) – vs. 2024
- 6.1.2 Tier 1, Tier 2 & Tier 3 Market Structure
- 6.1.3 Global, Regional & Local Player Dynamics
- 6.2 East Africa Instrument Cleaners and Detergents Market Share Analysis – 2024
- 6.2.1 Global Revenue Share by Company
- 6.2.2 Global Volume Share by Company
- 6.2.3 Regional Revenue Share
- 6.2.4 Market Share Evolution ( vs. 2024)
- 6.2.5 OEM Segment Share by Company
- 6.2.6 Replacement Segment Share by Company
- 6.3 Production/Delivery Capacity & Facility Analysis
- 6.3.1 Global Installed Capacity
- 6.3.2 Capacity Utilization Rates
- 6.3.3 Production/Output Volume
- 6.3.4 Facility Locations & Capacity Map
- 6.3.5 Planned Capacity Additions
- 6.4 East Africa Instrument Cleaners and Detergents Competitive Benchmarking Matrix
- 6.4.1 Revenue, Volume, CAGR & Profitability Comparison
- 6.4.2 Channel Revenue Mix
- 6.4.3 Geographic Revenue Exposure
- 6.4.4 R&D Intensity
- 6.4.5 Sustainability Maturity
- 6.5 Strategic Developments in East Africa Instrument Cleaners and Detergents (Last 24 Months)
- 6.5.1 Mergers, Acquisitions & Divestments
- 6.5.2 New East Africa Instrument Cleaners and Detergents Launches
- 6.5.3 Facility Expansions
- 6.5.4 Strategic Alliances, Joint Ventures & Partnerships
- 6.5.5 Distribution Expansion & Market Entry
- 6.5.6 Sustainability & ESG Initiatives
- 6.6 Competitive Strategy Mapping
- 6.6.1 Leader, Challenger, Follower & Niche Classification
- 6.6.2 Pricing Strategy Comparison
- 6.6.3 Channel Strategy Matrix
Note: Strategic developments are included based on their materiality and the availability of reliable information.
Chapter 7. Global East Africa Instrument Cleaners and Detergents Market – By Distribution Channel
- 7.1 Segment Overview
- 7.1.1 Volume & Revenue Split by Channel (2024 & 2032)
- 7.1.2 Channel Mix Evolution (2024-2032)
Chapter 8. Regional Market Analysis – Global Overview
- 8.1 Global Regional Overview
- 8.1.1 Regional Volume Share
- 8.1.2 Regional Revenue Share
- 8.1.3 Regional Volume by Region
- 8.1.4 Regional Revenue by Region
- 8.1.5 Regional Forecast Through 2032
- 8.2 Cross-Regional Segment Analysis
- 8.2.1 By Distribution Channel
- 8.2.2 By Brand/Price Tier
Chapter 9. North America East Africa Instrument Cleaners and Detergents Market
- 9.1 United States
- 9.2 Canada
- 9.3 Mexico
Chapter 10. Europe East Africa Instrument Cleaners and Detergents Market
- 10.1 Germany
- 10.2 France
- 10.3 Italy
- 10.4 United Kingdom
- 10.5 Spain
- 10.6 Poland
- 10.7 Russia
- 10.8 Netherlands
- 10.9 Belgium
- 10.10 Sweden
- 10.11 Denmark
- 10.12 Norway
- 10.13 Rest of Europe
Chapter 11. Asia Pacific East Africa Instrument Cleaners and Detergents Market
- 11.1 China
- 11.2 India
- 11.3 Japan
- 11.4 South Korea
- 11.5 Thailand
- 11.6 Indonesia
- 11.7 Vietnam
- 11.8 Malaysia
- 11.9 Australia
- 11.10 Rest of Asia Pacific
Chapter 12. Latin America East Africa Instrument Cleaners and Detergents Market
- 12.1 Brazil
- 12.2 Argentina
- 12.3 Colombia
- 12.4 Chile
- 12.5 Rest of Latin America
Chapter 13. Middle East East Africa Instrument Cleaners and Detergents Market
- 13.1 Saudi Arabia
- 13.2 United Arab Emirates
- 13.3 Turkey
- 13.4 Israel
- 13.5 Iran
- 13.6 Rest of the Middle East
Chapter 14. Africa East Africa Instrument Cleaners and Detergents Market
- 14.1 South Africa
- 14.2 Egypt
- 14.3 Nigeria
- 14.4 Morocco
- 14.5 Rest of Africa
Chapter 15. East Africa Instrument Cleaners and Detergents Company Profiles
- 15.1 [Company 01]
- 15.1.1 Company Overview
- 15.1.2 Key Management Personnel
- 15.1.3 Products & Services Portfolio
- 15.1.4 Financial Performance
- 15.1.5 Key Market Focus & Geographic Presence
- 15.1.6 Recent Developments & Strategic Initiatives
Note: The company profile list is preliminary and may change based on research findings, market developments, data availability, and client requirements.
Chapter 16. Appendices
- Appendix A – List of Abbreviations & Acronyms
- Appendix B – Industry Classification Code Reference – Full Series
- Appendix C – Production & Capacity Data Tables
- Appendix D – End-Use & Demand Base Tables
- Appendix E – Consumption & Replacement Rate Assumptions
- Appendix F – ASP Reference Tables
- Appendix G – Manufacturing & Facility Database
- Appendix H – Import-Export Data Tables
- Appendix I – Regulatory Summary Tables
- Appendix J – Primary Research Participant List (Anonymized)
- Appendix K – Primary Research Questionnaire Framework
- Appendix L – Data Sources & Bibliography
- Appendix M – Market Size Divergence & Source Comparison
Chapter 17. Research Methodology
- 17.1 Research Framework & Philosophy
- 17.2 Secondary Research – Sources, Hierarchy & Data Extraction
- 17.3 Data Modeling – Bottom-Up & Top-Down Market Sizing
- 17.4 Primary Research – Stakeholder Framework, LOI & Sample Sizes
- 17.5 Forecast Methodology – Regression, Scenario & Sensitivity Analysis
- 17.6 Quality Control – Four-Layer Validation Framework
- 17.7 Limitations & Standard Assumptions
- 17.8 Disclaimer
