
Electric Vehicle Motor Market Overview:
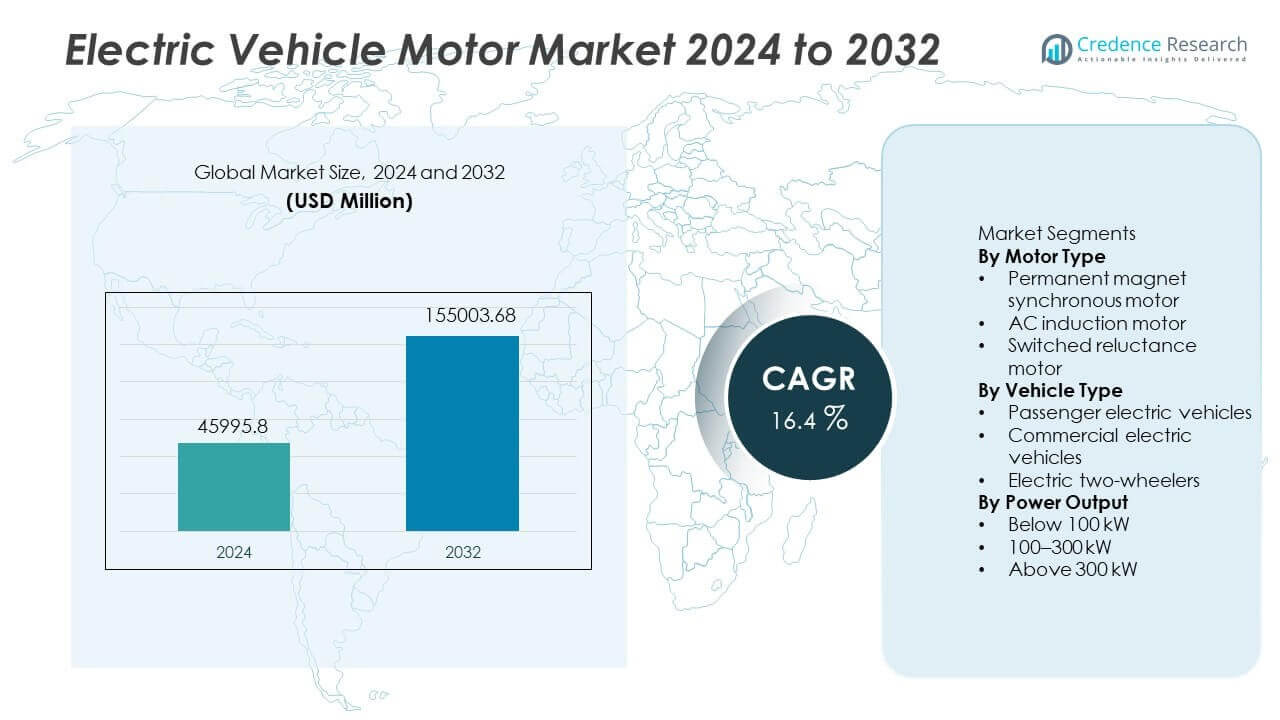
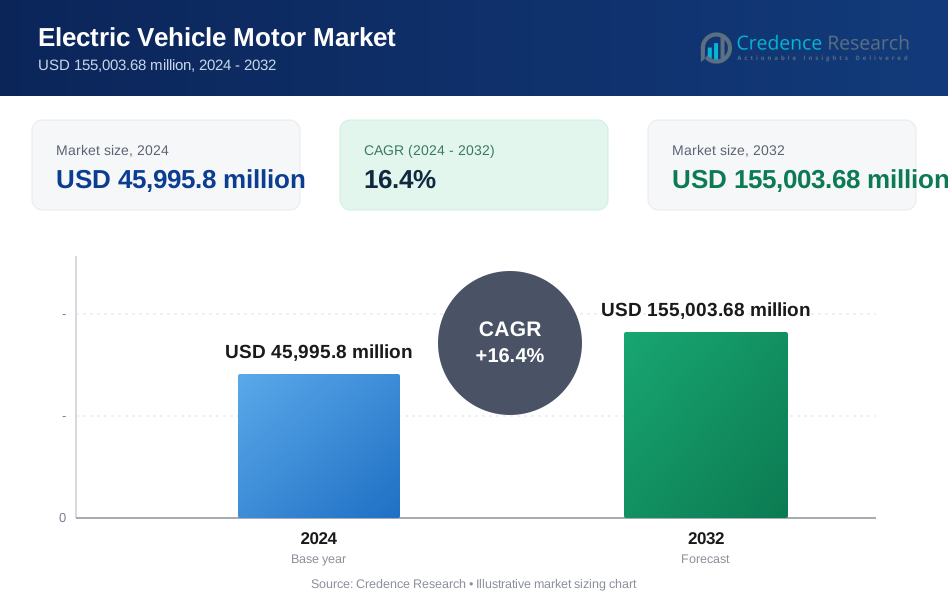
The Electric Vehicle Motor market was valued at USD 45,995.8 million in 2024 and is anticipated to reach USD 155,003.68 million by 2032, growing at a CAGR of 16.4% during the forecast period.
| REPORT ATTRIBUTE | DETAILS |
|---|---|
| Historical Period | 2020-2024 |
| Base Year | 2025 |
| Forecast Period | 2026-2032 |
| Electric Vehicle Motor Market Size 2024 | USD 45,995.8 million |
| Electric Vehicle Motor Market, CAGR | 16.4% |
| Electric Vehicle Motor Market Size 2032 | USD 155,003.68 million |
Electric Vehicle Motor Market Insights
- Market growth is driven by rapid electric vehicle adoption, emission regulations, and fleet electrification, with passenger electric vehicles leading the vehicle type segment at a 57% share due to higher production volumes.
- Market trends highlight strong demand for permanent magnet synchronous motors, which hold a 54% share, driven by high efficiency, compact size, and improved vehicle range performance.
- Competitive analysis shows intense rivalry focused on motor efficiency, rare-earth optimization, and localized manufacturing, while high component costs and raw material dependence remain key market restraints.
- Regional analysis indicates Asia Pacific leads with a 43% share, followed by Europe at 27% and North America at 22%, reflecting differences in EV production scale, regulations, and manufacturing maturity.
Electric Vehicle Motor Market Segmentation Analysis:
By Motor Type
By motor type, permanent magnet synchronous motors dominate the electric vehicle motor market with a 54% share. High efficiency, compact design, and superior power density drive adoption across passenger and commercial EVs. Automakers favor this motor for improved range and performance. AC induction motors hold a 30% share, supported by durability, lower cost, and reduced reliance on rare-earth materials. Switched reluctance motors account for 16%, driven by interest in robust designs and supply security. Permanent magnet motors lead due to mature manufacturing, strong OEM integration, and efficiency-focused vehicle architectures.
- For instance, Tesla uses an interior permanent magnet motor in the Model 3 that delivers a peak efficiency of 97 and supports a motor speed exceeding 18,000 rpm, improving driving range and acceleration.
By Vehicle Type
By vehicle type, passenger electric vehicles lead the market with a 57% share. Strong consumer demand, expanding model availability, and supportive incentives sustain dominance. OEMs prioritize passenger platforms to scale volumes and meet emission targets. Commercial electric vehicles hold a 28% share, supported by fleet electrification in buses, trucks, and logistics. Electric two-wheelers account for 15%, driven by urban mobility and affordability in Asia Pacific. Passenger EV leadership reflects higher production volumes, broader price bands, and improving charging access.
- For instance, BYD Company Ltd. reported annual passenger EV production exceeding 3,000,000 units, supported by in-house motors delivering peak outputs above 150 kilowatts for mass-market sedans and SUVs.
By Power Output
By power output, motors below 100 kW dominate with a 48% share. Widespread use in passenger cars and two-wheelers supports volume leadership. Cost efficiency and compact packaging drive adoption. The 100–300 kW segment holds a 35% share, driven by performance passenger EVs and light commercial vehicles. Above 300 kW accounts for 17%, supported by heavy-duty trucks and high-performance models. Lower-power motors lead due to broader application coverage and higher unit demand across mass-market vehicles.
Key Growth Drivers
Rapid Growth in Electric Vehicle Adoption
Electric vehicle adoption strongly drives the electric vehicle motor market. Rising EV sales increase demand for high-efficiency traction motors. Governments promote electrification through emission norms and incentives. Automakers expand electric portfolios across passenger and commercial segments. Higher EV production volumes directly raise motor installation rates. Urbanization supports electric mobility growth. Fleet electrification adds stable demand. Consumer preference shifts toward cleaner transport. Charging infrastructure expansion improves adoption confidence. Sustained EV penetration ensures long-term motor demand growth.
- For instance, Volkswagen AG scaled electric vehicle production using its MEB platform, integrating permanent magnet motors with peak outputs of 150 kilowatts in models such as the ID.4, while group-level EV production exceeded 800,000 units in a single year.
Advancements in Motor Efficiency and Power Density
Motor technology improvements support market expansion. Higher efficiency improves vehicle range and performance. Compact motor designs reduce vehicle weight. Power density enhancements support better acceleration. Advanced cooling improves reliability under high loads. Integration with power electronics boosts system efficiency. Improved materials reduce energy losses. OEM collaboration accelerates innovation cycles. Performance gains support premium and mass-market EVs. Technology progress strengthens motor adoption across platforms.
- For instance, Bosch developed an electric axle drive combining motor, inverter, and gearbox, achieving a continuous power output of 150 kilowatts and operating speeds exceeding 16,000 revolutions per minute within a reduced package size.
Supportive Government Regulations and Electrification Targets
Government regulations accelerate electric motor demand. Emission reduction targets push EV adoption timelines. Internal combustion phase-out plans favor electric drivetrains. Public transport electrification programs increase motor volumes. Fleet mandates support commercial EV growth. Incentives lower transition costs for manufacturers. Policy clarity improves investment planning. Infrastructure funding complements vehicle electrification. Regulatory pressure sustains long-term market momentum. Policy support remains a critical growth driver.
Key Trends & Opportunities
Shift Toward Permanent Magnet and Rare-Earth Optimization
Permanent magnet motors gain preference due to efficiency benefits. Automakers focus on range optimization strategies. Suppliers reduce rare-earth content through improved designs. Recycling initiatives support material sustainability. Advanced magnet layouts improve performance consistency. High-volume passenger EVs drive adoption. Cost stability improves supplier margins. OEM demand supports large-scale production. This trend enables premium motor differentiation. Optimization creates long-term value opportunities.
- For instance, Nidec Corporation developed a traction motor using a reduced heavy rare-earth magnet design, achieving a power output of 250 kilowatts while lowering dysprosium usage through optimized magnetic flux control.
Rising Demand from Commercial and Two-Wheeler Segments
Commercial and two-wheeler electrification expands motor demand. Electric buses and trucks gain policy support. Logistics fleets adopt electric drivetrains. Two-wheelers drive high unit volumes in urban markets. Cost-effective motor designs support affordability. Battery swapping models boost two-wheeler adoption. Emerging markets increase penetration rates. Diversified demand reduces market concentration risk. This trend broadens application scope. Volume growth supports scalable manufacturing.
- For instance, Yadea Group deploys hub and mid-drive motors rated up to 3,500 watts across mass-market electric scooters, supporting daily urban travel ranges above 80 kilometers per charge.
Key Challenges
High Cost of Advanced Motor Components
Advanced motor components increase production costs. Permanent magnets add cost pressure. Rare-earth price volatility affects margins. Thermal management systems raise expenses. Smaller manufacturers face pricing constraints. Cost sensitivity impacts mass-market EVs. Supply chain disruptions increase risk. OEMs seek cost reduction strategies. Profitability depends on scale efficiency. Managing component cost remains critical.
Dependence on Rare-Earth Material Supply Chains
Electric vehicle motors rely on rare-earth materials. Supply concentration increases geopolitical exposure. Trade restrictions affect availability. Price fluctuations impact production planning. Alternative motor designs need further validation. Recycling infrastructure remains limited. Supply diversification requires investment. Long-term contracts add complexity. Material dependency challenges stability. Supply chain resilience remains a key concern.
Regional Analysis
North America
North America holds a 22% share of the electric vehicle motor market, supported by strong EV adoption and domestic manufacturing investments. The United States leads demand due to expanding passenger EV production and fleet electrification. Automakers invest in local motor and battery plants to strengthen supply chains. Performance-focused EVs increase demand for high-efficiency motors. Public transport electrification supports steady volumes. R&D activity accelerates motor efficiency improvements. Charging infrastructure growth improves EV uptake. Policy incentives support electrification goals. The region benefits from advanced engineering capabilities and strong OEM–supplier collaboration.
Europe
Europe accounts for a 27% share of the electric vehicle motor market, driven by strict emission regulations and electrification mandates. Germany, France, and the Nordics lead regional demand through strong passenger EV adoption. Automakers prioritize efficient motor technologies to meet carbon targets. Public transport electrification boosts commercial motor demand. Advanced manufacturing supports precision motor production. Sustainability goals encourage energy-efficient designs. Standardization improves cross-border vehicle deployment. OEM investments in dedicated EV platforms sustain motor demand. Regulatory consistency underpins stable regional growth.
Asia Pacific
Asia Pacific leads the electric vehicle motor market with a 43% share, driven by large-scale EV production and cost-efficient manufacturing. China dominates motor demand through high passenger EV and two-wheeler volumes. Government incentives accelerate electrification across segments. Local supply chains support rapid scaling and cost control. India and Southeast Asia add growth through two-wheeler electrification. Commercial EV adoption expands in urban transport. Technology localization improves competitiveness. Export-oriented manufacturing strengthens volume growth. The region remains the primary engine of global motor demand.
Rest of the World
The Rest of the World holds an 8% share of the electric vehicle motor market, reflecting early-stage adoption. Latin America expands demand through electric buses and urban fleets. The Middle East invests in electrification aligned with energy transition goals. Australia supports EV uptake through incentives and infrastructure rollout. Limited local manufacturing constrains scale. Import dependence affects pricing. Policy frameworks continue to evolve. Pilot projects build market awareness. Gradual infrastructure development supports long-term growth potential across emerging regions.
Electric Vehicle Motor Market Segmentations:
By Motor Type
- Permanent magnet synchronous motor
- AC induction motor
- Switched reluctance motor
By Vehicle Type
- Passenger electric vehicles
- Commercial electric vehicles
- Electric two-wheelers
By Power Output
- Below 100 kW
- 100–300 kW
- Above 300 kW
By Geography
- North America
- U.S.
- Canada
- Mexico
- Europe
- Germany
- France
- U.K.
- Italy
- Spain
- Rest of Europe
- Asia Pacific
- China
- Japan
- India
- South Korea
- South-east Asia
- Rest of Asia Pacific
- Latin America
- Brazil
- Argentina
- Rest of Latin America
- Middle East & Africa
- GCC Countries
- South Africa
- Rest of the Middle East and Africa
Competitive Landscape
Competitive landscape analysis in the electric vehicle motor market highlights Bosch, Nidec Corporation, ZF Friedrichshafen AG, Denso Corporation, and ABB Ltd. as key participants. The market remains highly competitive due to rapid EV adoption and continuous motor innovation. Leading players focus on improving motor efficiency, power density, and thermal management. Permanent magnet motor development remains a strategic priority. Companies invest in localized manufacturing to reduce supply risks and costs. Strategic partnerships with automakers strengthen long-term supply contracts. R&D spending supports rare-earth optimization and alternative motor designs. Scale, reliability, and cost efficiency define competitive positioning. Regional expansion targets high EV production hubs. Overall competition centers on technology leadership, supply chain control, and OEM integration.
Key Player Analysis
- Bosch
- Nidec Corporation
- Siemens AG
- ABB Ltd.
- ZF Friedrichshafen AG
- Denso Corporation
- Valeo
- Hitachi Astemo
- Magna International
- Continental AG
Recent Developments
- In September 2025, Bosch showcased advanced electric drive solutions including integrated eAxles and high-efficiency motors at IAA Mobility 2025.
- In August 2025, Nidec started using Siemens Teamcenter software to improve EV motor development processes.
- In June 2025, ZF promoted its scalable SELECT e-drive technology for better EV powertrain performance.
Report Coverage
The research report offers an in-depth analysis based on Motor Type, Vehicle Type, Power Output and Geography. It details leading market players, providing an overview of their business, product offerings, investments, revenue streams, and key applications. Additionally, the report includes insights into the competitive environment, SWOT analysis, current market trends, as well as the primary drivers and constraints. Furthermore, it discusses various factors that have driven market expansion in recent years. The report also explores market dynamics, regulatory scenarios, and technological advancements that are shaping the industry. It assesses the impact of external factors and global economic changes on market growth. Lastly, it provides strategic recommendations for new entrants and established companies to navigate the complexities of the market.
Future Outlook
- Electric vehicle production growth will continue driving motor demand globally.
- Permanent magnet motors will remain the dominant motor technology.
- Motor efficiency improvements will support extended vehicle range.
- Commercial electric vehicle adoption will increase motor volume demand.
- Two-wheeler electrification will boost demand for compact motors.
- Rare-earth optimization will become a key design focus.
- Localized manufacturing will improve supply chain resilience.
- Integration of motors with power electronics will increase.
- R&D investment will accelerate alternative motor development.
- Asia Pacific will remain the leading region for motor market growth.
Request a Free Sample
Fill in your details and we'll send you a free sample report.
- Sample data tables & charts
- Research methodology
Need a Custom Version of This Report?
Tailor the scope, geography, or segments to your exact requirements.
- Custom geography or segment scope
- Direct access to our analyst team
Frequently Asked Questions
What is the current market size for the Electric Vehicle Motor market, and what is its projected size in 2032?
At what Compound Annual Growth Rate is the Electric Vehicle Motor market projected to grow between 2024 and 2032?
Which Electric Vehicle Motor market segment held the largest share in 2024?
What are the primary factors fueling the growth of the Electric Vehicle Motor market?
Who are the leading companies in the Electric Vehicle Motor market?
Which region commanded the largest share of the Electric Vehicle Motor market in 2024?
Table of Content
Chapter 1. Report Introduction
- 1.1 Report Description & Purpose
- 1.1.1 Report Title & Market Definition
- 1.1.2 Unique Selling Propositions (USP) & Key Differentiators
- 1.1.3 Value Proposition for Stakeholders
- 1.2 Research Objectives
- 1.2.1 Market Sizing Objectives (Volume & Revenue)
- 1.2.2 Segmentation Objectives
- 1.2.3 Competitive Intelligence Objectives
- 1.2.4 Forecast & Scenario Objectives
- 1.3 Report Scope
- 1.3.1 Electric Vehicle Motor Scope – Types & Subtypes Covered
- 1.3.2 Geographic Scope – Regions & Countries Covered
- 1.3.3 Historical Period, Base Year & Forecast Period (2024; forecast to 2032)
- 1.3.4 Inclusions & Exclusions
- 1.4 HS Code & Classification Framework
- 1.5 Currency, Units & Pricing Basis
- 1.6 Target Stakeholders
- 1.7 Limitations & Assumptions
Chapter 2. Executive Summary
- 2.1 Global Electric Vehicle Motor Market Snapshot
- 2.1.1 Market Size – Historical (2024) & Forecast (2024-2032) (2024: USD 45,995.8 million → 2032: USD 155,003.68 million)
- 2.1.2 Volume & Revenue – Global Totals
- 2.1.3 Key Market Highlights – Top Five Facts
- 2.2 Electric Vehicle Motor Market Segmentation Snapshot
- 2.2.1 Market Split by Region – 2024 vs. 2032
- 2.3 Competitive Snapshot
- 2.3.1 Top 10 Players by Revenue Share – 2024
- 2.3.2 Top 10 Players by Volume Share – 2024
- 2.3.3 Recent Strategic Developments (18-Month Summary)
- 2.4 Key Investment Highlights & Strategic Conclusions
Chapter 3. Electric Vehicle Motor Market Dynamics & Industry Analysis
- 3.1 Market Overview & Context
- 3.1.1 Electric Vehicle Motor Market Position in the Broader Automotive Value Chain
- 3.1.2 OEM vs. Replacement Market Dynamics
- 3.1.3 Market Maturity & Development Stage by Region
- 3.2 Electric Vehicle Motor Market Drivers
- 3.3 Electric Vehicle Motor Market Restraints & Challenges
- 3.4 Electric Vehicle Motor Market Opportunities
- 3.5 Porter's Five Forces Analysis
- 3.5.1 Threat of New Entrants
- 3.5.2 Bargaining Power of Suppliers
- 3.5.3 Bargaining Power of Buyers
- 3.5.4 Threat of Substitutes
- 3.5.5 Competitive Rivalry – Intensity Assessment
- 3.6 Electric Vehicle Motor Value Chain Analysis
- 3.6.1 Upstream – Raw Material/Input Suppliers
- 3.6.1.1 Raw Material/Input 1
- 3.6.1.2 Raw Material/Input 2
- 3.6.1.3 Raw Material/Input 3
- 3.6.2 Midstream – Production/Manufacturing/Service Delivery
- 3.6.2.1 Production/Process Overview
- 3.6.2.2 Key Facility Locations & Capacity by Manufacturer
- 3.6.3 Downstream – Distribution & End Consumer
- 3.6.3.1 Primary Channel – B2B/OEM
- 3.6.3.2 Secondary Channels – Dealer, Retail, Online, Direct
- 3.6.4 Value Chain Profitability Analysis
- 3.6.1 Upstream – Raw Material/Input Suppliers
- 3.7 PESTEL Analysis
- 3.7.1 Political Factors
- 3.7.2 Economic Factors
- 3.7.3 Social Factors
- 3.7.4 Technological Factors
- 3.7.5 Environmental Factors
- 3.7.6 Legal Factors
- 3.8 Electric Vehicle Motor Supply Chain Analysis
- 3.8.1 Raw Material/Input Supply Risk Assessment
- 3.8.2 Manufacturing Concentration Risk (Geographic Exposure)
- 3.8.3 Trade Disruption Impact Analysis
- 3.9 Regulatory & Policy Landscape
Note: The regulatory and policy landscape section covers regulations based on their applicability to the market, Electric Vehicle Motor category, geography, and scope of the study. Only regulatory frameworks with a material impact on operations, compliance, trade, sustainability, or market access are analyzed in detail.
Chapter 4. Key Investment Pockets & Opportunity Analysis
- 4.1 Electric Vehicle Motor Market Attractiveness Analysis
- 4.1.1 By Region – Investment Attractiveness Matrix (Volume × CAGR)
- 4.2 Absolute Revenue Growth Opportunity
- 4.2.1 By Region – Absolute USD Growth Through 2032
- 4.3 Incremental Volume Opportunity
- 4.3.1 By Region – Incremental Volume Through 2032
- 4.3.2 Segment – Incremental Volume
- 4.4 Emerging Submarket Opportunity Deep Dive (Subject to Applicability)
- 4.5 Emerging Market Opportunity Scorecards
- 4.5.1 United States
- 4.5.2 Europe
- 4.5.3 Asia
- 4.5.4 Middle East & Africa
Note: Emerging Market Opportunity Scorecards will be included based on relevance and strategic importance. Regions listed are indicative and may vary depending on data availability and market dynamics.
Chapter 5. Electric Vehicle Motor Import-Export Analysis & Trade Flows
- 5.1 Global Trade Overview
- 5.1.1 Global Export Value by Country (2024)
- 5.1.2 Global Export Volume by Country (2024)
- 5.1.3 Global Import Value by Country (2024)
- 5.1.4 Global Import Volume by Country (2024)
- 5.1.5 Net Trade Balance by Country (2024)
- 5.2 Export Analysis – Segment
- 5.2.1 Type 1 (HS Code)
- 5.2.2 Type 2 (HS Code)
- 5.2.3 Type 3 (HS Code)
- 5.2.4 Type 4 (HS Code)
- 5.2.5 Type 5 (HS Code)
- 5.3 Import Analysis – Segment
- 5.3.1 Type 1 (HS Code)
- 5.3.2 Type 2 (HS Code)
- 5.3.3 Type 3 (HS Code)
- 5.3.4 Type 4 (HS Code)
- 5.3.5 Type 5 (HS Code)
- 5.4 Average Unit Trade Prices
- 5.4.1 Average Export Price – Segment & Country
- 5.4.2 Average Import Price – Segment & Source Country
- 5.4.3 Price Trends (2024)
- 5.5 Key Trade Route Analysis
- 5.5.1 Trade Route 1
- 5.5.2 Trade Route 2
- 5.5.3 Trade Route 3
- 5.5.4 Trade Route 4
- 5.5.5 Trade Route 5
- 5.6 Trade Policy Impact Assessment
- 5.6.1 US Anti-Dumping & Section 301 Tariffs
- 5.6.2 EU Customs Union Impact
- 5.6.3 Major Free Trade Agreements
- 5.6.4 USMCA Rules of Origin
Note: Trade policy analysis will be included only where relevant to the Electric Vehicle Motor market.
Chapter 6. Competitive Landscape & Company Benchmarking
- 6.1 Electric Vehicle Motor Market Concentration & Structure
- 6.1.1 Herfindahl-Hirschman Index (HHI) – vs. 2024
- 6.1.2 Tier 1, Tier 2 & Tier 3 Market Structure
- 6.1.3 Global, Regional & Local Player Dynamics
- 6.2 Electric Vehicle Motor Market Share Analysis – 2024
- 6.2.1 Global Revenue Share by Company
- 6.2.2 Global Volume Share by Company
- 6.2.3 Regional Revenue Share
- 6.2.4 Market Share Evolution ( vs. 2024)
- 6.2.5 OEM Segment Share by Company
- 6.2.6 Replacement Segment Share by Company
- 6.3 Production/Delivery Capacity & Facility Analysis
- 6.3.1 Global Installed Capacity
- 6.3.2 Capacity Utilization Rates
- 6.3.3 Production/Output Volume
- 6.3.4 Facility Locations & Capacity Map
- 6.3.5 Planned Capacity Additions
- 6.4 Electric Vehicle Motor Competitive Benchmarking Matrix
- 6.4.1 Revenue, Volume, CAGR & Profitability Comparison
- 6.4.2 Channel Revenue Mix
- 6.4.3 Geographic Revenue Exposure
- 6.4.4 R&D Intensity
- 6.4.5 Sustainability Maturity
- 6.5 Strategic Developments in Electric Vehicle Motor (Last 24 Months)
- 6.5.1 Mergers, Acquisitions & Divestments
- 6.5.2 New Electric Vehicle Motor Launches
- 6.5.3 Facility Expansions
- 6.5.4 Strategic Alliances, Joint Ventures & Partnerships
- 6.5.5 Distribution Expansion & Market Entry
- 6.5.6 Sustainability & ESG Initiatives
- 6.6 Competitive Strategy Mapping
- 6.6.1 Leader, Challenger, Follower & Niche Classification
- 6.6.2 Pricing Strategy Comparison
- 6.6.3 Channel Strategy Matrix
Note: Strategic developments are included based on their materiality and the availability of reliable information.
Chapter 7. Global Electric Vehicle Motor Market – By Distribution Channel
- 7.1 Segment Overview
- 7.1.1 Volume & Revenue Split by Channel (2024 & 2032)
- 7.1.2 Channel Mix Evolution (2024-2032)
Chapter 8. Regional Market Analysis – Global Overview
- 8.1 Global Regional Overview
- 8.1.1 Regional Volume Share
- 8.1.2 Regional Revenue Share
- 8.1.3 Regional Volume by Region
- 8.1.4 Regional Revenue by Region
- 8.1.5 Regional Forecast Through 2032
- 8.2 Cross-Regional Segment Analysis
- 8.2.1 By Distribution Channel
- 8.2.2 By Brand/Price Tier
Chapter 9. North America Electric Vehicle Motor Market
- 9.1 United States
- 9.2 Canada
- 9.3 Mexico
Chapter 10. Europe Electric Vehicle Motor Market
- 10.1 Germany
- 10.2 France
- 10.3 Italy
- 10.4 United Kingdom
- 10.5 Spain
- 10.6 Poland
- 10.7 Russia
- 10.8 Netherlands
- 10.9 Belgium
- 10.10 Sweden
- 10.11 Denmark
- 10.12 Norway
- 10.13 Rest of Europe
Chapter 11. Asia Pacific Electric Vehicle Motor Market
- 11.1 China
- 11.2 India
- 11.3 Japan
- 11.4 South Korea
- 11.5 Thailand
- 11.6 Indonesia
- 11.7 Vietnam
- 11.8 Malaysia
- 11.9 Australia
- 11.10 Rest of Asia Pacific
Chapter 12. Latin America Electric Vehicle Motor Market
- 12.1 Brazil
- 12.2 Argentina
- 12.3 Colombia
- 12.4 Chile
- 12.5 Rest of Latin America
Chapter 13. Middle East Electric Vehicle Motor Market
- 13.1 Saudi Arabia
- 13.2 United Arab Emirates
- 13.3 Turkey
- 13.4 Israel
- 13.5 Iran
- 13.6 Rest of the Middle East
Chapter 14. Africa Electric Vehicle Motor Market
- 14.1 South Africa
- 14.2 Egypt
- 14.3 Nigeria
- 14.4 Morocco
- 14.5 Rest of Africa
Chapter 15. Electric Vehicle Motor Company Profiles
- 15.1 [Company 01]
- 15.1.1 Company Overview
- 15.1.2 Key Management Personnel
- 15.1.3 Products & Services Portfolio
- 15.1.4 Financial Performance
- 15.1.5 Key Market Focus & Geographic Presence
- 15.1.6 Recent Developments & Strategic Initiatives
Note: The company profile list is preliminary and may change based on research findings, market developments, data availability, and client requirements.
Chapter 16. Appendices
- Appendix A – List of Abbreviations & Acronyms
- Appendix B – Industry Classification Code Reference – Full Series
- Appendix C – Production & Capacity Data Tables
- Appendix D – End-Use & Demand Base Tables
- Appendix E – Consumption & Replacement Rate Assumptions
- Appendix F – ASP Reference Tables
- Appendix G – Manufacturing & Facility Database
- Appendix H – Import-Export Data Tables
- Appendix I – Regulatory Summary Tables
- Appendix J – Primary Research Participant List (Anonymized)
- Appendix K – Primary Research Questionnaire Framework
- Appendix L – Data Sources & Bibliography
- Appendix M – Market Size Divergence & Source Comparison
Chapter 17. Research Methodology
- 17.1 Research Framework & Philosophy
- 17.2 Secondary Research – Sources, Hierarchy & Data Extraction
- 17.3 Data Modeling – Bottom-Up & Top-Down Market Sizing
- 17.4 Primary Research – Stakeholder Framework, LOI & Sample Sizes
- 17.5 Forecast Methodology – Regression, Scenario & Sensitivity Analysis
- 17.6 Quality Control – Four-Layer Validation Framework
- 17.7 Limitations & Standard Assumptions
- 17.8 Disclaimer
