Market Overview
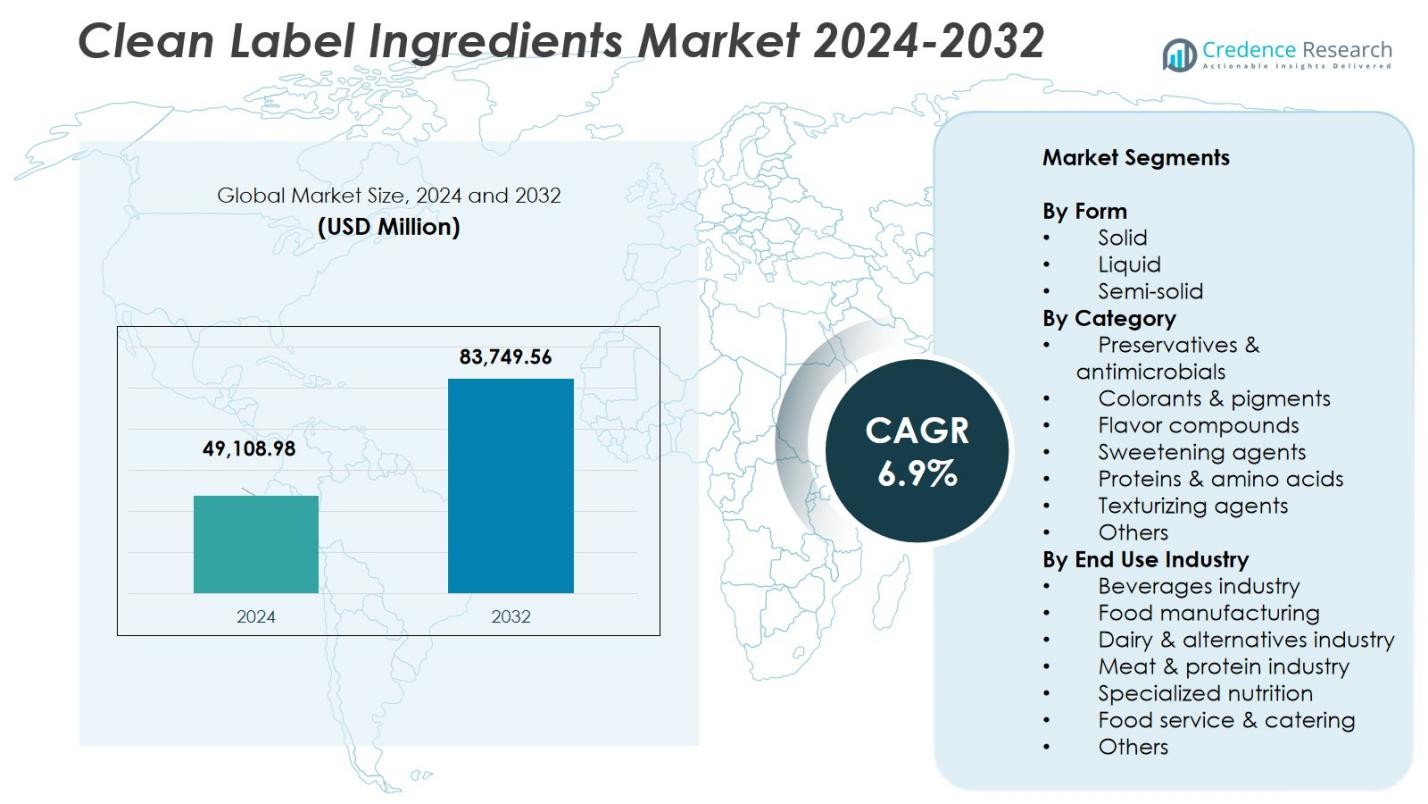
The Clean Label Ingredients Market size was valued at USD 49,108.98 Million in 2024 and is anticipated to reach USD 83,749.56 Million by 2032, at a CAGR of 6.9% during the forecast period.
| REPORT ATTRIBUTE |
DETAILS |
| Historical Period |
2020-2023 |
| Base Year |
2024 |
| Forecast Period |
2025-2032 |
| Clean Label Ingredients Market Size 2024 |
USD 49,108.98 Million |
| Clean Label Ingredients Market , CAGR |
6.9% |
| Clean Label Ingredients Market Size 2032 |
USD 83,749.56 Million |
The Clean Label Ingredients Market is driven by prominent companies including Cargill, Archer Daniels Midland, Koninklijke DSM, DuPont, Kerry Group, Tate & Lyle, Corbion, Sensient Technologies, and Frutarom, each expanding their portfolios to address rising demand for natural, transparent, and minimally processed ingredients. These players actively develop innovations in plant-based texturizers, natural colors, clean sweeteners, and functional ingredient systems to support reformulation across bakery, beverages, dairy alternatives, and ready-to-eat foods. Their strategic focus on sustainable sourcing, advanced processing technologies, and partnerships with global food manufacturers enhances market growth. Regionally, North America leads with a 32% market share, propelled by strong consumer preference for clean labels, stringent regulatory standards, and rapid adoption of natural ingredients across major food and beverage categories, solidifying its position as the dominant region in the clean label ingredients landscape.
Access crucial information at unmatched prices!
Request your sample report today & start making informed decisions powered by Credence Research Inc.!
Download Sample
Market Insights
- The Clean Label Ingredients Market was valued at USD 49,108.98 Million in 2024 and is projected to reach USD 83,749.56 Million by 2032 at a 9% CAGR, driven by rising adoption across food and beverage applications.
- Strong market growth is fueled by increasing consumer preference for natural, transparent, and minimally processed ingredients, prompting manufacturers to reformulate products using clean label flavors, sweeteners, texturizers, and natural preservatives.
- Key trends include rapid expansion of plant-based and functional ingredient solutions, along with technological advancements in fermentation, enzyme processing, and extraction to enhance natural ingredient performance.
- Leading players such as Cargill, ADM, DSM, DuPont, Kerry Group, Tate & Lyle, Corbion, Sensient, and Frutarom continue to expand portfolios and invest in sustainable sourcing, though high production costs and functional limitations of natural ingredients remain restraints.
- Regionally, North America leads with 32%, followed by Europe at 28%, Asia Pacific at 24%, while solid form dominates the market with a 60% segment share.
Market Segmentation Analysis:
By Form
The solid form segment leads the market with a 60% share, driven by its superior stability, longer shelf life, and extensive adoption in bakery, snacks, seasonings, and nutraceutical applications. Manufacturers favor solid clean label ingredients because they integrate efficiently into large-scale processing and support consistent product quality. Liquid ingredients hold 28% of the market, supported by strong use in beverages and dairy formulations, while semi-solid forms account for the remaining 12%, expanding within premium spreads and specialty food categories as clean label reformulation accelerates.
- For instance, CP Kelco’s GENU Pectin YM-FP-2100 stabilizes fruited drinking yogurts by operating at just a 1% use level in the fruit preparation, carrying stabilization into the final yogurt drink without requiring additional stabilizers, and Fiberstar citrus fiber delivers natural water-holding properties in beverage and dairy systems while replacing synthetic thickeners.
By Category
Within ingredient categories, texturizing agents dominate with a 34% market share, as they play a critical role in delivering desirable mouthfeel, structure, and stability across bakery, dairy alternatives, sauces, and prepared foods. Sweetening agents account for 20% of the market, reflecting rising replacement of artificial sweeteners with natural options, while flavor compounds represent 18% as brands shift to botanical and natural flavor solutions. Preservatives and antimicrobials hold 12%, colorants and pigments 10%, proteins and amino acids 4%, and other categories collectively account for 2% of overall demand.
- For instance, citrus pectin is widely used in plant-based yogurts and sauces for its gelling and thickening properties, while xanthan gum helps stabilize products like cheese and ice cream by preventing water separation.
By End-Use Industry
The food manufacturing segment holds the largest share at 42%, driven by widespread reformulation across bakery, confectionery, snacks, and ready meals to meet clean label expectations. The beverages industry follows with 20%, supported by rising adoption of natural colors, flavors, and sweeteners in juices, RTD drinks, and functional beverages. Dairy and alternatives contribute 14%, while the meat and protein industry holds 10% as producers replace artificial binders and preservatives. Specialized nutrition accounts for 8%, food service and catering for 4%, and other applications collectively represent 2% of market demand.
Key Growth Drivers
Rising Consumer Demand for Natural and Transparent Products
Growing consumer preference for food and beverage products made with recognizable, minimally processed, and chemical-free ingredients drives strong market expansion. Shoppers increasingly read labels, prioritize ingredient transparency, and seek products free from artificial additives, preservatives, and synthetic chemicals. This behavior pushes manufacturers to reformulate existing product lines with clean label solutions while launching new natural offerings. The shift is further supported by heightened health awareness, expanding organic consumption, and the influence of social media and clean eating trends, creating sustained demand for clean label ingredients across global markets.
- For instance, companies like Archer Daniels Midland and Cargill are investing heavily in clean label ingredient innovations to meet the demand for transparency and natural sourcing in products.
Regulatory Push Toward Safer and Cleaner Formulations
Regulatory bodies worldwide continue tightening rules on artificial additives, synthetic colors, and chemical preservatives, compelling manufacturers to adopt clean label alternatives. Increased scrutiny of artificial ingredients, coupled with mandatory labeling reforms, encourages companies to transition toward naturally derived, plant-based, and minimally processed inputs. These regulatory shifts not only enhance consumer confidence but also stimulate innovation in natural texturizers, colorants, sweeteners, and stabilizers. As compliance becomes essential, demand intensifies for clean label ingredients that meet both functional performance standards and evolving global food safety requirements.
- For instance, Nestlé has reformulated thousands of products by eliminating artificial additives and simplifying ingredient lists, making them easier to understand, and substituting synthetic additives with natural alternatives like beet juice for coloring and vinegar for preservation.
Growing Adoption in Processed and Convenience Foods
The rapid rise of ready-to-eat meals, snacks, bakery items, beverages, and dairy alternatives significantly boosts the demand for clean label ingredients. As consumers seek convenient food options without compromising health or clarity, manufacturers increasingly integrate natural flavors, stabilizers, sweeteners, and preservatives. Food companies invest in reformulation to maintain taste, texture, and shelf life while eliminating artificial components. Expanded product portfolios in plant-based foods, functional beverages, and premium snacks further amplify market growth, positioning clean label ingredients as essential for innovation in the evolving convenience food landscape.
Key Trends & Opportunities
Innovation in Plant-Based and Functional Ingredient Solutions
Rising interest in plant-based diets and functional nutrition presents a strong opportunity for clean label ingredient suppliers. Companies are developing natural proteins, botanical extracts, fermentation-derived compounds, and fiber-rich ingredients that offer both clean label appeal and enhanced nutritional benefits. This trend aligns with consumer expectations for products supporting immunity, gut health, and overall wellness. The shift toward multifunctional natural ingredients allows manufacturers to improve product performance while maintaining transparency, creating a robust innovation environment across beverages, dairy alternatives, snacks, and specialized nutrition categories.
- For instance, Tate & Lyle has developed fiber-rich clean label ingredients like resistant starches and inulin that improve gut health and texture in dairy alternatives and functional foods.
Technological Advancements in Clean Label Formulation
Advances in food processing technologies create new opportunities for formulating clean label products without compromising sensory or functional qualities. Techniques such as cold-press extraction, natural fermentation, enzyme modification, and precision drying enhance ingredient performance while maintaining natural integrity. These innovations enable the development of clean label emulsifiers, natural preservatives, and plant-based colorants that match or exceed the functionality of synthetic alternatives. As brands seek to innovate rapidly, technology-driven improvements in ingredient purity, stability, and scalability expand the market outlook and create new commercialization pathways.
- For instance, DuPont Nutrition & Health applies natural fermentation and enzyme modification to develop plant-based proteins and stabilizers that mimic synthetic alternatives in texture and performance.
Key Challenges
Functional Limitations of Natural Ingredients
Clean label ingredients often struggle to match the performance, stability, and cost efficiency of synthetic additives, posing a challenge for manufacturers attempting reformulation. Natural colorants may fade, plant-based stabilizers can alter texture, and natural preservatives often offer shorter shelf life protection. These functional gaps require ongoing innovation and may lead to higher formulation complexity, affecting product consistency and production efficiency. Brands must balance clean label positioning with sensory expectations, which can slow adoption in highly processed or shelf-stable food categories where synthetic ingredients traditionally excel.
Higher Production Costs and Supply Chain Constraints
Natural and minimally processed ingredients often come with higher sourcing, production, and quality assurance costs, creating barriers for price-sensitive manufacturers. Limited availability of certain botanical or plant-derived ingredients increases reliance on seasonal harvests, vulnerable agricultural supply chains, and fluctuating raw material prices. Ensuring consistent quality and traceability further raises operational expenses. These cost pressures challenge companies to maintain competitive pricing while transitioning to clean label formulations, especially in markets where affordability strongly influences consumer purchasing decisions.
Regional Analysis
North America
North America holds a 32% market share in the clean label ingredients market, driven by strong consumer preference for natural, transparent, and minimally processed products. The region benefits from advanced food processing capabilities, high regulatory scrutiny of artificial additives, and rapid adoption of clean label reformulations by major manufacturers. Growth is supported by increasing demand for plant-based foods, functional beverages, and premium snacks. Leading brands continue to invest in natural sweeteners, colors, texturizers, and preservatives, strengthening the regional leadership position. Expansion of retail clean label private-label products further accelerates market penetration.
Europe
Europe captures a 28% market share, supported by stringent food safety regulations, strict additive restrictions, and long-established consumer awareness of natural and organic ingredients. The clean label movement is highly mature across Western European countries, where manufacturers aggressively replace artificial additives with natural alternatives to meet evolving labeling standards. Demand expands across bakery, dairy, beverages, and convenience foods, largely influenced by sustainability initiatives and widespread preference for traceable plant-based ingredients. Investments in natural preservation technologies and botanical extracts continue to strengthen Europe’s role as an innovation hub in clean label formulations.
Asia Pacific
Asia Pacific accounts for a 24% market share and stands as the fastest-growing region due to rising incomes, expanding urban populations, and increasing preference for healthier packaged foods. Manufacturers in China, India, Japan, and Southeast Asia adopt clean label ingredients to address growing concerns over food safety, artificial additives, and long ingredient lists. The rapid growth of ready-to-eat meals, dairy alternatives, and functional beverages fuels significant demand for natural flavors, colors, and stabilizers. Local and international companies invest heavily in regional production facilities, supporting scalable, cost-efficient clean label ingredient supply chains.
Latin America
Latin America holds a 10% market share, driven by increasing consumer awareness of natural ingredients and rising demand for clean, safe, and transparent packaged foods. Countries such as Brazil, Mexico, and Argentina see accelerating reformulation efforts across beverages, dairy, bakery, and snacks as manufacturers replace synthetic additives with plant-based alternatives. Local producers adopt clean label positioning to differentiate products in competitive markets, while multinational brands expand natural ingredient portfolios to meet regional expectations. Growth is further supported by retail modernization and rising popularity of natural sweeteners, botanical extracts, and minimally processed preservative solutions.
Middle East & Africa
The Middle East & Africa region represents a 6% market share, with growth driven by increasing health consciousness, urbanization, and rising demand for premium packaged foods made with natural ingredients. Regional food manufacturers integrate clean label solutions into bakery, beverages, and dairy products to meet growing consumer expectations for transparency and quality. Import-dependent markets stimulate demand for globally sourced natural flavors, colorants, and stabilizers. Expansion of modern retail channels and investment from international food and ingredient companies contribute to steady market development, although high pricing and supply chain limitations remain challenges.
Market Segmentations:
By Form
By Category
- Preservatives & antimicrobials
- Colorants & pigments
- Flavor compounds
- Sweetening agents
- Proteins & amino acids
- Texturizing agents
- Others
By End Use Industry
- Beverages industry
- Food manufacturing
- Dairy & alternatives industry
- Meat & protein industry
- Specialized nutrition
- Food service & catering
- Others
By Region
- North America
- Europe
- Germany
- France
- U.K.
- Italy
- Spain
- Rest of Europe
- Asia Pacific
- China
- Japan
- India
- South Korea
- South-east Asia
- Rest of Asia Pacific
- Latin America
- Brazil
- Argentina
- Rest of Latin America
- Middle East & Africa
- GCC Countries
- South Africa
- Rest of the Middle East and Africa
Competitive Landscape
The competitive landscape of the clean label ingredients market features major players such as Cargill, Archer Daniels Midland, Koninklijke DSM, DuPont, Kerry Group, Tate & Lyle, Corbion, Sensient Technologies, and Frutarom, all actively strengthening their global presence through innovation and strategic expansion. Companies focus on developing natural flavors, colors, sweeteners, texturizers, and functional ingredient systems that meet consumer demand for transparency and reduced artificial additives. Intense competition drives continuous investment in R&D, sustainable sourcing, and advanced processing technologies to enhance ingredient performance while maintaining clean label integrity. Partnerships with food manufacturers, acquisitions of specialized ingredient suppliers, and expansion into plant-based and fermentation-derived solutions further accelerate market consolidation. These companies strategically broaden their product portfolios to address evolving regulations, rising demand for natural formulations, and the growing shift toward plant-based and functional foods across global markets.
Shape Your Report to Specific Countries or Regions & Enjoy 30% Off!
Key Player Analysis
- Corbion Inc.
- Kerry Group PLC
- Tate & Lyle Plc
- Frutarom
- Cargill
- Sensient Technologies
- Archer Daniels Midland
- Dupont De Nemours and Company
- Kerry Group Plc
- Koninklijke DSM N.V
Recent Developments
- In September 2025, Millbio strengthened its leadership in clean-label ingredients through a strategic partnership with Cain Foods, creating a fully integrated global platform designed to advance natural bakery solutions and expand its presence in the rapidly growing clean-label market.
- In August 2025, J&K Ingredients expanded its clean-label portfolio by acquiring key assets from NuTek Natural Ingredients, enhancing its capabilities in natural preservatives, salt-reduction solutions, flavor enhancers, and texture technologies to meet rising consumer demand for healthier, natural food ingredients.
- In November 2025, Ingredion Incorporated formed a partnership with Swiss biotech company Cosaic to scale a novel yeast-based emulsion ingredient aimed at supporting clean-label product formulations.
- In July 2025, ALDI Suisse introduced a clean-label mycoprotein chicken filet under its MyVay brand, developed in collaboration with biotech producer Planetary.
Report Coverage
The research report offers an in-depth analysis based on Form, Category, End Use Industry and Region. It details leading market players, providing an overview of their business, product offerings, investments, revenue streams, and key applications. Additionally, the report includes insights into the competitive environment, SWOT analysis, current market trends, as well as the primary drivers and constraints. Furthermore, it discusses various factors that have driven market expansion in recent years. The report also explores market dynamics, regulatory scenarios, and technological advancements that are shaping the industry. It assesses the impact of external factors and global economic changes on market growth. Lastly, it provides strategic recommendations for new entrants and established companies to navigate the complexities of the market.
Future Outlook
- The market will experience strong expansion as consumers continue prioritizing natural, transparent, and minimally processed ingredients.
- Manufacturers will increase reformulation efforts across major food and beverage categories to eliminate artificial additives.
- Plant-based and botanical ingredient development will grow rapidly to support cleaner product profiles.
- Fermentation, enzymatic processing, and other advanced technologies will enhance the performance of clean label ingredients.
- Demand for multifunctional natural ingredients will rise as brands seek to balance clean formulations with high functionality.
- Regulatory tightening on artificial additives will accelerate the shift toward natural alternatives.
- Clean label adoption will expand in emerging markets as awareness of food safety and ingredient quality increases.
- Supply chain localization and sustainable sourcing will become strategic priorities for ingredient producers.
- Foodservice and quick-service restaurant segments will increasingly integrate clean label formulations to meet customer expectations.
- Innovation in natural preservatives and shelf-life extension solutions will create new commercial opportunities for industry players.


