CHAPTER NO. 1 : GENESIS OF THE MARKET
1.1 Market Prelude – Introduction & Scope
1.2 The Big Picture – Objectives & Vision
1.3 Strategic Edge – Unique Value Proposition
1.4 Stakeholder Compass – Key Beneficiaries
CHAPTER NO. 2 : EXECUTIVE LENS
2.1 Pulse of the Industry – Market Snapshot
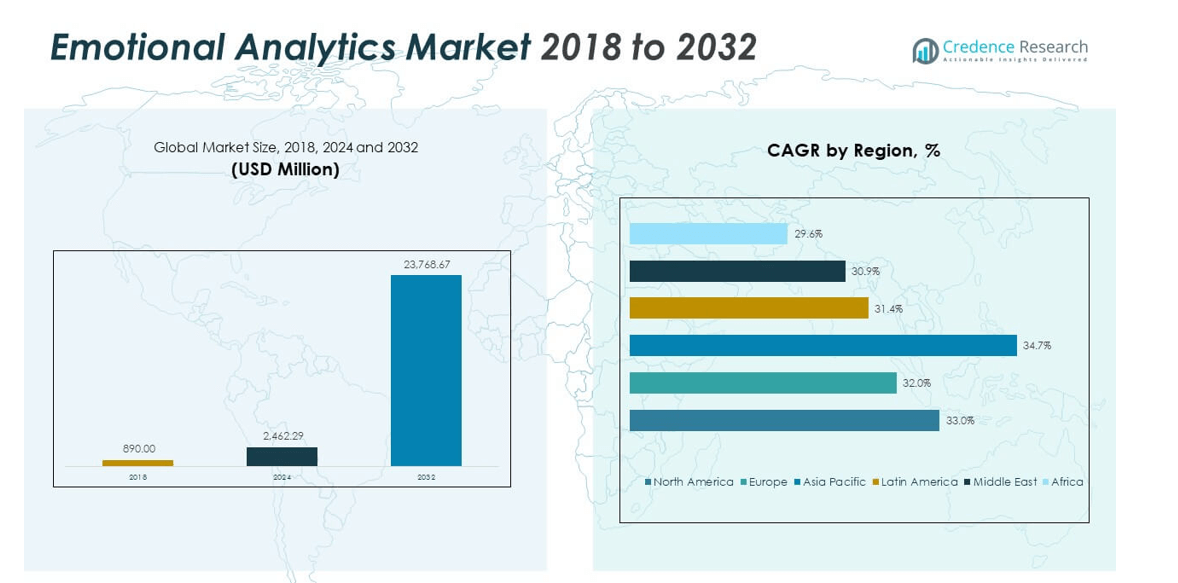
2.2 Growth Arc – Revenue Projections (USD Million)
2.3. Premium Insights – Based on Primary Interviews
CHAPTER NO. 3 : EMOTIONAL ANALYTICS MARKET FORCES & INDUSTRY PULSE
3.1 Foundations of Change – Market Overview
3.2 Catalysts of Expansion – Key Market Drivers
3.2.1 Momentum Boosters – Growth Triggers
3.2.2 Innovation Fuel – Disruptive Technologies
3.3 Headwinds & Crosswinds – Market Restraints
3.3.1 Regulatory Tides – Compliance Challenges
3.3.2 Economic Frictions – Inflationary Pressures
3.4 Untapped Horizons – Growth Potential & Opportunities
3.5 Strategic Navigation – Industry Frameworks
3.5.1 Market Equilibrium – Porter’s Five Forces
3.5.2 Ecosystem Dynamics – Value Chain Analysis
3.5.3 Macro Forces – PESTEL Breakdown
3.6 Price Trend Analysis
3.6.1 Regional Price Trend
3.6.2 Price Trend by product
CHAPTER NO. 4 : KEY INVESTMENT EPICENTER
4.1 Regional Goldmines – High-Growth Geographies
4.2 Product Frontiers – Lucrative Product Categories
4.3 Application Sweet Spots – Emerging Demand Segments
CHAPTER NO. 5: REVENUE TRAJECTORY & WEALTH MAPPING
5.1 Momentum Metrics – Forecast & Growth Curves
5.2 Regional Revenue Footprint – Market Share Insights
5.3 Segmental Wealth Flow – Type & Application Revenue
CHAPTER NO. 6 : TRADE & COMMERCE ANALYSIS
6.1. Import Analysis by Region
6.1.1. Global Emotional Analytics Market Import Revenue By Region
6.2. Export Analysis by Region
6.2.1. Global Emotional Analytics Market Export Revenue By Region
CHAPTER NO. 7 : COMPETITION ANALYSIS
7.1. Company Market Share Analysis
7.1.1. Global Emotional Analytics Market: Company Market Share
7.2. Global Emotional Analytics Market Company Revenue Market Share
7.3. Strategic Developments
7.3.1. Acquisitions & Mergers
7.3.2. New Product Launch
7.3.3. Regional Expansion
7.4. Competitive Dashboard
7.5. Company Assessment Metrics, 2024
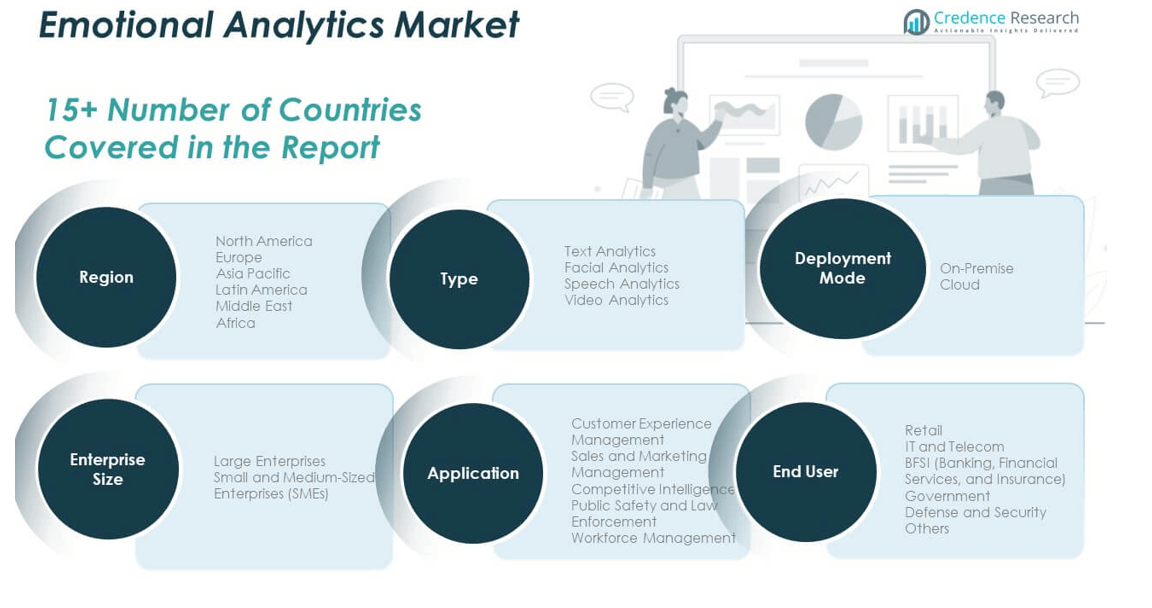
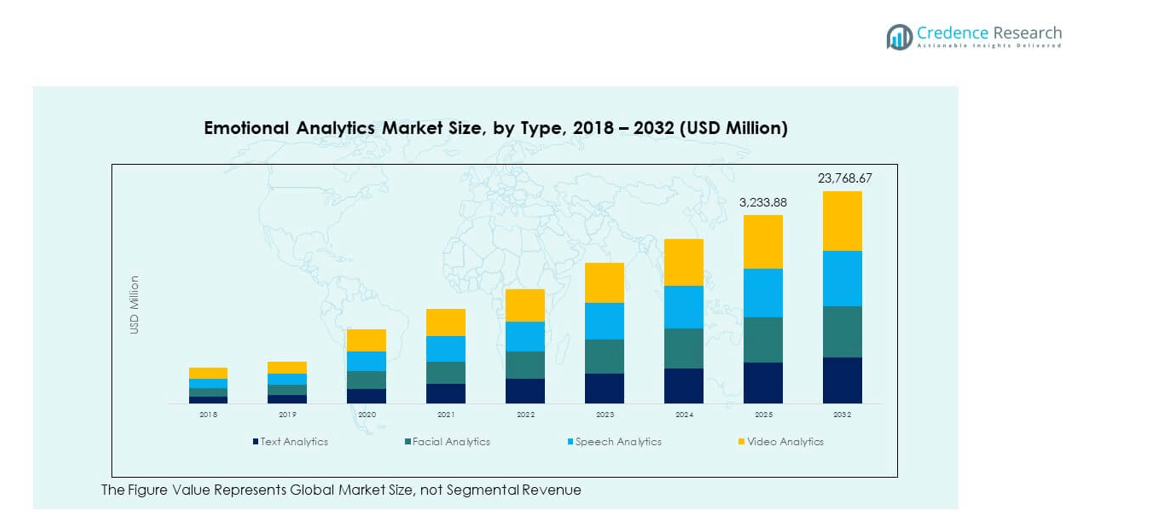
CHAPTER NO. 8 : EMOTIONAL ANALYTICS MARKET – BY TYPE SEGMENT ANALYSIS
8.1. Emotional Analytics Market Overview by Type Segment
8.1.1. Emotional Analytics Market Revenue Share By Type
8.2. Text Analytics
8.3. Facial Analytics
8.4. Speech Analytics
8.5. Video Analytics
CHAPTER NO. 9 : EMOTIONAL ANALYTICS MARKET – BY APPLICATION SEGMENT ANALYSIS
9.1. Emotional Analytics Market Overview by Application Segment
9.1.1. Emotional Analytics Market Revenue Share By Application
9.2. Customer Experience Management
9.3. Sales and Marketing Management
9.4. Competitive Intelligence
9.5. Public Safety and Law Enforcement
9.6. Workforce Management
CHAPTER NO. 10 : EMOTIONAL ANALYTICS MARKET – BY END-USER SEGMENT ANALYSIS
10.1. Emotional Analytics Market Overview by End-user Segment
10.1.1. Emotional Analytics Market Revenue Share By End-user
10.2. Retail
10.3. IT and Telecom
10.4 BFSI (Banking, Financial Services, and Insurance)
10.5. Government
10.6. Defense and Security
10.7. Others
CHAPTER NO. 11 : EMOTIONAL ANALYTICS MARKET – BY DEPLOYMENT MODE SEGMENT ANALYSIS
11.1. Emotional Analytics Market Overview by Deployment Mode Segment
11.1.1. Emotional Analytics Market Revenue Share By Deployment Mode
11.2. On-Premise
11.3. Cloud
CHAPTER NO. 12 : EMOTIONAL ANALYTICS MARKET – BY ENTERPRISE SIZE SEGMENT ANALYSIS
12.1. Emotional Analytics Market Overview by Enterprise Size Segment
12.1.1. Emotional Analytics Market Revenue Share By Enterprise Size
12.2. Large Enterprises
12.3. Small and Medium-Sized Enterprises (SMEs)
CHAPTER NO. 13 : EMOTIONAL ANALYTICS MARKET – REGIONAL ANALYSIS
13.1. Emotional Analytics Market Overview by Region Segment
13.1.1. Global Emotional Analytics Market Revenue Share By Region
13.1.2. Regions
13.1.3. Global Emotional Analytics Market Revenue By Region
13.1.4. Type
13.1.5. Global Emotional Analytics Market Revenue By Type
13.1.6. Application
13.1.7. Global Emotional Analytics Market Revenue By Application
13.1.8. End-user
13.1.9. Global Emotional Analytics Market Revenue By End-user
13.1.10. Deployment Mode
13.1.12. Global Emotional Analytics Market Revenue By Deployment Mode
13.1.13. Enterprise Size
13.1.14. Global Emotional Analytics Market Revenue By Enterprise Size
CHAPTER NO. 14 : NORTH AMERICA EMOTIONAL ANALYTICS MARKET – COUNTRY ANALYSIS
14.1. North America Emotional Analytics Market Overview by Country Segment
14.1.1. North America Emotional Analytics Market Revenue Share By Region
14.2. North America
14.2.1. North America Emotional Analytics Market Revenue By Country
14.2.2. Type
14.2.3. North America Emotional Analytics Market Revenue By Type
14.2.4. Application
14.2.5. North America Emotional Analytics Market Revenue By Application
14.2.6. End-user
14.2.7. North America Emotional Analytics Market Revenue By End-user
14.2.8. Deployment Mode
14.2.9. North America Emotional Analytics Market Revenue By Deployment Mode
14.2.10. Enterprise Size
14.2.11. North America Emotional Analytics Market Revenue By Enterprise Size
14.3. U.S.
14.4. Canada
14.5. Mexico
CHAPTER NO. 15 : EUROPE EMOTIONAL ANALYTICS MARKET – COUNTRY ANALYSIS
15.1. Europe Emotional Analytics Market Overview by Country Segment
15.1.1. Europe Emotional Analytics Market Revenue Share By Region
15.2. Europe
15.2.1. Europe Emotional Analytics Market Revenue By Country
15.2.2. Type
15.2.3. Europe Emotional Analytics Market Revenue By Type
15.2.4. Application
15.2.5. Europe Emotional Analytics Market Revenue By Application
15.2.6. End-user
15.2.7. Europe Emotional Analytics Market Revenue By End-user
15.2.8. Deployment Mode
15.2.9. Europe Emotional Analytics Market Revenue By Deployment Mode
15.2.10. Enterprise Size
15.2.11. Europe Emotional Analytics Market Revenue By Enterprise Size
15.3. UK
15.4. France
15.5. Germany
15.6. Italy
15.7. Spain
15.8. Russia
15.9. Rest of Europe
CHAPTER NO. 16 : ASIA PACIFIC EMOTIONAL ANALYTICS MARKET – COUNTRY ANALYSIS
16.1. Asia Pacific Emotional Analytics Market Overview by Country Segment
16.1.1. Asia Pacific Emotional Analytics Market Revenue Share By Region
16.2. Asia Pacific
16.2.1. Asia Pacific Emotional Analytics Market Revenue By Country
16.2.2. Type
16.2.3. Asia Pacific Emotional Analytics Market Revenue By Type
16.2.4. Application
16.2.5. Asia Pacific Emotional Analytics Market Revenue By Application
16.2.6. End-user
16.2.7. Asia Pacific Emotional Analytics Market Revenue By End-user
16.2.8. Deployment Mode
16.2.9. Asia Pacific Emotional Analytics Market Revenue By Deployment Mode
16.2.10. Enterprise Size
16.2.11. Asia Pacific Emotional Analytics Market Revenue By Enterprise Size
16.3. China
16.4. Japan
16.5. South Korea
16.6. India
16.7. Australia
16.8. Southeast Asia
16.9. Rest of Asia Pacific
CHAPTER NO. 17 : LATIN AMERICA EMOTIONAL ANALYTICS MARKET – COUNTRY ANALYSIS
17.1. Latin America Emotional Analytics Market Overview by Country Segment
17.1.1. Latin America Emotional Analytics Market Revenue Share By Region
17.2. Latin America
17.2.1. Latin America Emotional Analytics Market Revenue By Country
17.2.2. Type
17.2.3. Latin America Emotional Analytics Market Revenue By Type
17.2.4. Application
17.2.5. Latin America Emotional Analytics Market Revenue By Application
17.2.6. End-user
17.2.7. Latin America Emotional Analytics Market Revenue By End-user
17.2.8. Deployment Mode
17.2.9. Latin America Emotional Analytics Market Revenue By Deployment Mode
17.2.10. Enterprise Size
17.2.11. Latin America Emotional Analytics Market Revenue By Enterprise Size
17.3. Brazil
17.4. Argentina
17.5. Rest of Latin America
CHAPTER NO. 18 : MIDDLE EAST EMOTIONAL ANALYTICS MARKET – COUNTRY ANALYSIS
18.1. Middle East Emotional Analytics Market Overview by Country Segment
18.1.1. Middle East Emotional Analytics Market Revenue Share By Region
18.2. Middle East
18.2.1. Middle East Emotional Analytics Market Revenue By Country
18.2.2. Type
18.2.3. Middle East Emotional Analytics Market Revenue By Type
18.2.4. Application
18.2.5. Middle East Emotional Analytics Market Revenue By Application
18.2.6. End-user
18.2.7. Middle East Emotional Analytics Market Revenue By End-user
18.2.8. Deployment Mode
18.2.9. Middle East Emotional Analytics Market Revenue By Deployment Mode
18.2.10. Enterprise Size
18.2.11. Middle East Emotional Analytics Market Revenue By Enterprise Size
18.3. GCC Countries
18.4. Israel
18.5. Turkey
18.6. Rest of Middle East
CHAPTER NO. 19 : AFRICA EMOTIONAL ANALYTICS MARKET – COUNTRY ANALYSIS
19.1. Africa Emotional Analytics Market Overview by Country Segment
19.1.1. Africa Emotional Analytics Market Revenue Share By Region
19.2. Africa
19.2.1. Africa Emotional Analytics Market Revenue By Country
19.2.2. Type
19.2.3. Africa Emotional Analytics Market Revenue By Type
19.2.4. Application
19.2.5. Africa Emotional Analytics Market Revenue By Application
19.2.6. End-user
19.2.7. Africa Emotional Analytics Market Revenue By End-user
19.2.8. Deployment Mode
19.2.9. Africa Emotional Analytics Market Revenue By Deployment Mode
19.2.10. Enterprise Size
19.2.11. Africa Emotional Analytics Market Revenue By Enterprise Size
19.3. South Africa
19.4. Egypt
19.5. Rest of Africa
CHAPTER NO. 20 : COMPANY PROFILES
20.1. Kairos AR, Inc. (USA)
20.1.1. Company Overview
20.1.2. Product Portfolio
20.1.3. Financial Overview
20.1.4. Recent Developments
20.1.5. Growth Strategy
20.1.6. SWOT Analysis
20.2. Eyeris (USA)
20.3. Realeyes (UK)
20.4. Noldus Information Technology (Netherlands)
20.5. IBM Corporation (USA)
20.6. Microsoft Corporation (USA)
20.7. Google LLC (USA)
20.8. Tobii AB (Sweden)
20.9. Amazon Web Services, Inc. (USA)
20.10. Apple Inc. (USA)
20.11. NEC Corporation (Japan)
20.12. Cognitec Systems GmbH (Germany)
20.13. Sentiance (Belgium)
20.14. NVISO SA (Switzerland)
20.15. Adoreboard (UK)