
Market Overview
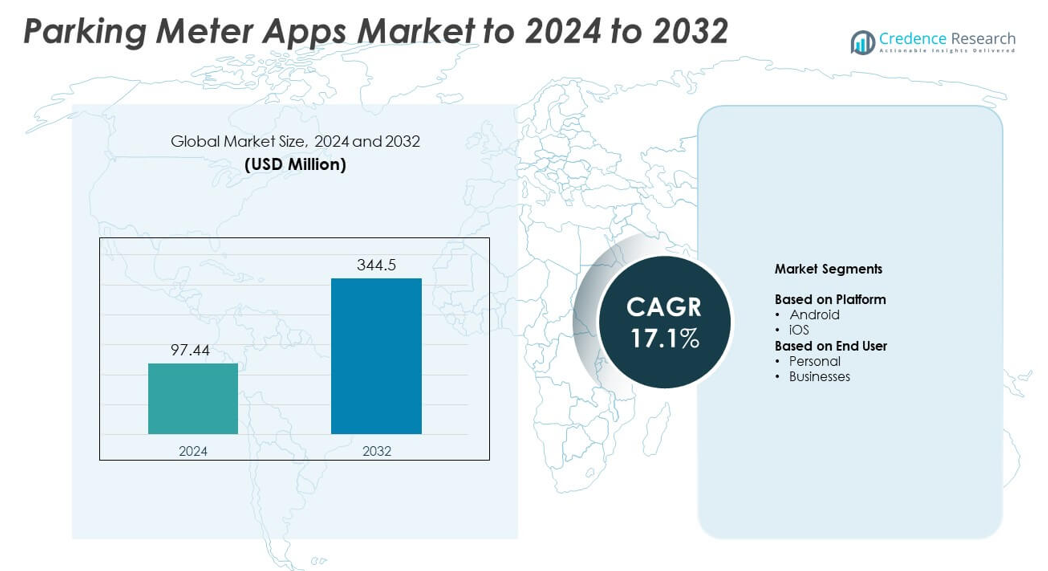
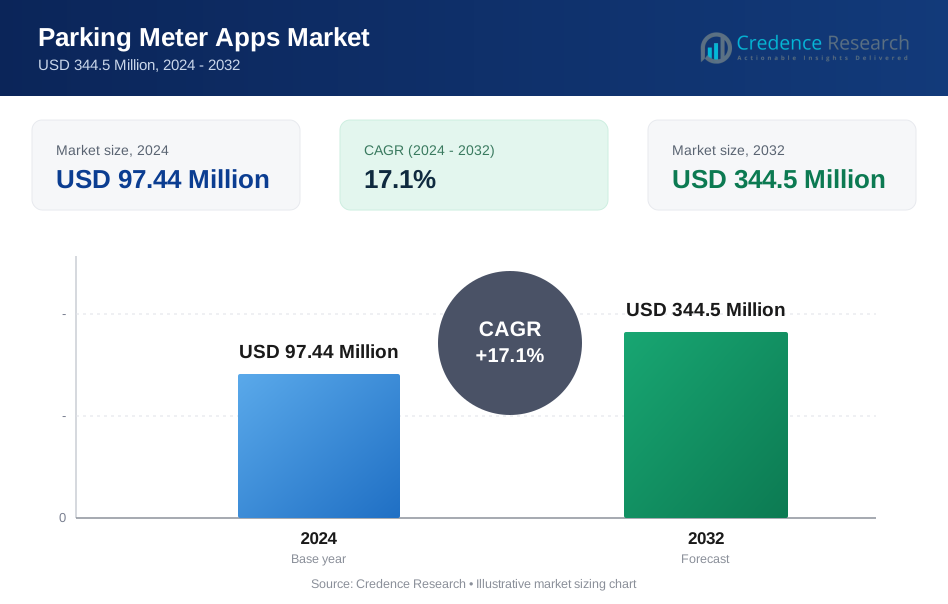
Parking Meter Apps Market size was valued at USD 97.44 Million in 2024 and is anticipated to reach USD 344.5 Million by 2032, at a CAGR of 17.1% during the forecast period.
| REPORT ATTRIBUTE | DETAILS |
|---|---|
| Historical Period | 2020-2023 |
| Base Year | 2024 |
| Forecast Period | 2025-2032 |
| Parking Meter Apps Market Size 2024 | USD 97.44 Million |
| Parking Meter Apps Market, CAGR | 17.1% |
| Parking Meter Apps Market Size 2032 | USD 344.5 Million |
The Parking Meter Apps Market includes major players such as ParkMate, PASSPORT LABS, INC., EasyPark, ParkMobile, LLC, Flowbird, PayByPhone, ParkWhiz, INRIX, Inc., Parkopedia, and IEM SA, all of which shape competition through advanced payment systems and wider city integrations. These companies strengthen adoption by improving app speed, location accuracy, and multi-platform support for commuters and businesses. North America leads the market with about 39% share in 2024 due to strong digital payment usage and extensive smart parking infrastructure. Europe follows with nearly 31% share, supported by unified mobility systems and high app penetration in urban centers.
Market Insights
- Parking Meter Apps Market size was USD 97.44 Million in 2024 and will reach USD 344.5 Million by 2032, growing at a CAGR of 17.1%. • Rising adoption of digital parking systems, higher smartphone usage, and strong demand for cashless mobility solutions drive market expansion, with Android holding about 64% share due to broader device penetration. • Key trends include integration with navigation platforms, wider EV-compatible parking services, and AI-based predictions that help users locate spaces faster and improve city-level occupancy management. • Competition intensifies as leading players enhance app reliability, strengthen payment features, and expand global coverage; companies also focus on cybersecurity and multi-city interoperability to boost user trust. • North America leads with 39% share in 2024, followed by Europe with 31%; Asia Pacific grows fast with 22% share due to rising urbanization, while Latin America and Middle East & Africa hold smaller shares driven by gradual smart parking upgrades.
Market Segmentation Analysis:
By Platform
Android leads the segment with about 64% share in 2024. Users prefer Android platforms due to wider device penetration and strong support across mid-range smartphones. Developers release frequent updates that improve payment flow, map accuracy, and meter integration. Adoption grows as cities expand smart parking programs linked to Android-based mobility apps. iOS grows at a steady pace, supported by high-income users who favor secure transactions and premium app design. Rising adoption of digital wallets on iOS also supports higher engagement in crowded urban zones.
- For instance, The ParkMobile 'About Us' information and several recent press releases state the company has a user base of over 45 million people, while the company's 2023 Year in Review reported concluding the year with 59 million users.
By End User
Personal users dominate the segment with nearly 71% share in 2024. Growth comes from rising digital adoption among daily commuters who want quick parking access. Consumers value features like real-time space availability, rate comparison, and remote top-ups. Expansion of pay-by-phone parking zones adds further traction. Business users grow as companies integrate parking tools into fleet management systems. Demand increases among logistics firms, delivery platforms, and corporate offices seeking centralized billing and time tracking for employee parking activities.
- For instance, JustPark serves over 13 million driversthrough a network of more than 250,000 parking spaces across the UK. This footprint shows strong use by everyday motorists and small fleets.
Key Growth Drivers
Rising Adoption of Smart Parking Systems
Cities expand smart mobility programs that integrate sensors, digital meters, and unified parking platforms. This expansion increases demand for parking meter apps that support real-time updates, prepaid sessions, and remote extensions. Users choose these apps because they reduce wait times and improve trip planning. Governments also promote digital payments to cut cash handling and enhance compliance. These factors collectively strengthen app penetration across dense urban cores.
- For instance, the official press release announcing the corporate rebrand to Arrive in June 2025 stated that the company, including brands like EasyPark, Flowbird, RingGo, ParkMobile, and Parkopedia, is present in over 20,000 citiesand more than 90 countries
Shift Toward Contactless and Cashless Payments
Commuters increasingly prefer mobile payments for faster and safer parking access. Digital wallets, QR-based billing, and in-app receipts improve user convenience and lower parking operator costs. Cashless systems also reduce errors and help agencies track revenue more accurately. Adoption accelerates as retail hubs, airports, and municipal lots standardize touch-free meters. This shift makes app-based transactions a default choice for many drivers.
- For instance, the RingGo "Corporate" pageconfirms it has "over 17,000 locations in 500 towns and cities across the UK"
Growth in Vehicle Ownership and Urban Congestion
Vehicle numbers rise in major cities, creating high demand for flexible parking tools. Parking meter apps help drivers locate available spaces and avoid congestion zones. Municipal authorities implement demand-based pricing, making digital platforms essential for instant fare updates. Increased traffic density pushes commuters toward technology that saves time and reduces fuel waste. The link between rising urbanization and efficient parking access boosts market expansion.
Key Trends and Opportunities
Integration With Navigation and Mobility Platforms
Parking apps increasingly connect with navigation tools, ride-hailing platforms, and EV charging networks. These integrations help users plan entire trips through a single interface. Real-time traffic data and meter availability improve decision making in crowded zones. Mobility platforms also gain value by offering bundled travel options. This creates strong opportunities for app developers to expand service ecosystems.
- For instance, Parkopedia’s database covers over 90 million parking spaces across roughly 20,000 cities in 90 countries by the year of 2022.
Expansion of EV-Compatible Parking Solutions
As electric vehicles grow, cities deploy more charging-enabled parking spaces linked to digital apps. Users seek platforms that display charger type, availability, and session costs along with parking status. Operators partner with EV infrastructure providers to unify payments under one system. This trend supports wider monetization and positions parking apps as essential companions for EV drivers. The shift also encourages long-term upgrades in smart parking networks.
- For instance, the Shell Recharge app lets drivers find over 500,000 public charge points in 33 European countries.
Growing Use of AI for Dynamic Pricing and Space Prediction
Developers use AI models to predict space turnover, plan meter maintenance, and adjust pricing during peak hours. These capabilities help cities balance occupancy and boost revenue. Users benefit from fewer parking uncertainties and better route planning. AI-driven insights support more efficient space allocation in commercial districts. This opens new opportunities for advanced analytics in future app versions.
Key Challenges
Data Security and Privacy Concerns
Parking meter apps handle sensitive information such as payment credentials, location trails, and vehicle details. Security breaches can erode user trust and slow adoption. Operators must comply with strict data-protection rules while maintaining seamless app performance. Implementing encryption and secure gateways increases costs for developers. Sustained investment in cybersecurity remains a major challenge for market expansion.
Limited Infrastructure Integration Across Cities
Many cities still rely on legacy meters that do not support full digital connectivity. This fragmentation slows the rollout of app-based features and restricts interoperability. Operators face delays in upgrading hardware and aligning digital payment policies. Inconsistent municipal standards limit seamless app experiences across regions. Overcoming infrastructure gaps remains a key hurdle for nationwide app adoption.
Regional Analysis
North America North America leads the market with about 39% share in 2024. The region benefits from extensive adoption of digital parking systems in the United States and Canada. Cities expand smart meter networks that support mobile payments and real-time availability checks. Rising commuter density in metropolitan zones increases reliance on app-based parking tools. Strong smartphone penetration and digital wallet usage further improve user adoption. Municipal programs focused on reducing congestion and improving curbside management also support long-term growth.
Europe Europe holds nearly 31% share in 2024, supported by mature urban mobility ecosystems. Countries such as Germany, the United Kingdom, France, and the Netherlands promote app-based parking to streamline traffic flow in busy city centers. Widespread use of cashless payments encourages faster adoption across public and private lots. Sustainability goals also push cities to replace traditional meters with connected digital alternatives. Growth accelerates as European transport agencies integrate parking apps with transit passes and low-emission zone tools to improve user convenience.
Asia Pacific
Asia Pacific accounts for roughly 22% share in 2024 and grows quickly due to rising urbanization. Expanding vehicle ownership in China, India, Japan, and South Korea increases demand for organized parking management. Large cities deploy smart mobility platforms that link parking meters with navigation and digital payment systems. Consumers rely on mobile apps to avoid congestion and secure parking near commercial hubs. Government-backed digital payment initiatives strengthen adoption, while ongoing smart city investments widen opportunities for app developers.
Latin America
Latin America captures about 5% share in 2024, with growth driven by digital transformation in major cities. Countries such as Brazil, Mexico, and Chile adopt mobile parking solutions to improve traffic control and reduce cash-based meter operations. Commuters prefer apps that offer transparent pricing and remote payment options. However, uneven infrastructure limits deployment in smaller cities. Continued expansion of municipal smart mobility projects is expected to enhance app usage across business districts and high-traffic zones.
Middle East and Africa
Middle East and Africa hold nearly 3% share in 2024, supported by growing investments in digital infrastructure. Urban centers such as Dubai, Riyadh, and Johannesburg introduce app-based systems to enhance parking compliance and streamline payments. Rising smartphone penetration supports adoption among daily commuters. Smart city programs accelerate deployment of digital meters, although adoption varies across regions due to cost and infrastructure gaps. Expanding commercial real estate projects and airport parking upgrades continue to drive regional market growth.
Market Segmentations:
By Platform
- Android
- iOS
By End User
- Personal
- Businesses
By Geography
- North America
- U.S.
- Canada
- Mexico
- Europe
- Germany
- France
- U.K.
- Italy
- Spain
- Rest of Europe
- Asia Pacific
- China
- Japan
- India
- South Korea
- South-east Asia
- Rest of Asia Pacific
- Latin America
- Brazil
- Argentina
- Rest of Latin America
- Middle East & Africa
- GCC Countries
- South Africa
- Rest of the Middle East and Africa
Competitive Landscape
The Parking Meter Apps Market is shaped by leading companies such as ParkMate, PASSPORT LABS, INC., EasyPark, ParkMobile, LLC, Flowbird, PayByPhone, ParkWhiz, INRIX, Inc., Parkopedia, and IEM SA. These providers compete by strengthening app reliability, expanding global coverage, and improving system integration with municipal parking networks. Developers emphasize smoother payment flows, advanced mapping accuracy, and faster session extensions to enhance user experience. Many companies invest in AI-driven analytics that help cities manage occupancy and optimize pricing. Partnerships with transport authorities and private parking operators expand market reach across high-density zones. Growing demand for contactless payments encourages firms to launch updated digital wallet compatibility and multi-language support. Continuous upgrades in cybersecurity, fraud prevention, and data encryption also help build user trust. As smart city investments rise, competition intensifies around interoperability, EV-compatible features, and predictive space availability tools, shaping long-term innovation in the market.
Key Player Analysis
- ParkMate
- PASSPORT LABS, INC.
- EasyPark
- ParkMobile, LLC
- Flowbird
- PayByPhone
- ParkWhiz
- INRIX, Inc.
- Parkopedia
- IEM SA
Recent Developments
- In 2025, INRIX launched a new revenue and transaction integration feature within INRIX Curb Analytics. This feature combines parking location, rates, restrictions, supply and demand, and actual usage/revenue data into one platform for cities.
- In 2025, ParkMobile unveiled an enhanced app experience with a redesigned interface and smarter navigation, making it faster for users to pay for and manage parking sessions.
- In 2024, PayByPhone launched an in-app EV charging and payments feature in the UK, turning its parking app into a broader vehicle management tool with integrated charging services.
Report Coverage
The research report offers an in-depth analysis based on Platform, End-User and Geography. It details leading market players, providing an overview of their business, product offerings, investments, revenue streams, and key applications. Additionally, the report includes insights into the competitive environment, SWOT analysis, current market trends, as well as the primary drivers and constraints. Furthermore, it discusses various factors that have driven market expansion in recent years. The report also explores market dynamics, regulatory scenarios, and technological advancements that are shaping the industry. It assesses the impact of external factors and global economic changes on market growth. Lastly, it provides strategic recommendations for new entrants and established companies to navigate the complexities of the market.
Future Outlook
- The market will grow as more cities expand smart parking programs.
- Digital payments will become the default method for parking access.
- Integration with navigation and mobility apps will improve user convenience.
- AI-based demand forecasting will enhance dynamic pricing and occupancy control.
- EV-compatible parking features will gain wider adoption across urban zones.
- Municipal agencies will upgrade legacy meters to support full app connectivity.
- App developers will focus on stronger cybersecurity to protect user data.
- Fleet and business users will increase adoption for centralized parking management.
- Cross-border interoperability will rise as regions align digital parking standards.
- Subscription-based parking services will expand in dense commercial districts.
Request a Free Sample
Fill in your details and we'll send you a free sample report.
- Sample data tables & charts
- Research methodology
Need a Custom Version of This Report?
Tailor the scope, geography, or segments to your exact requirements.
- Custom geography or segment scope
- Direct access to our analyst team
Frequently Asked Questions
What is the current market size for Parking Meter Apps Market, and what is its projected size in 2032?
At what Compound Annual Growth Rate is the Parking Meter Apps Market projected to grow between 2025 and 2032?
Which Parking Meter Apps Market segment held the largest share in 2024?
What are the primary factors fueling the growth of the Parking Meter Apps Market?
Who are the leading companies in the Parking Meter Apps Market?
Table of Content
Chapter 1. Report Introduction
- 1.1 Report Description & Purpose
- 1.1.1 Report Title & Market Definition
- 1.1.2 Unique Selling Propositions (USP) & Key Differentiators
- 1.1.3 Value Proposition for Stakeholders
- 1.2 Research Objectives
- 1.2.1 Market Sizing Objectives (Volume & Revenue)
- 1.2.2 Segmentation Objectives
- 1.2.3 Competitive Intelligence Objectives
- 1.2.4 Forecast & Scenario Objectives
- 1.3 Report Scope
- 1.3.1 Parking Meter Apps Scope – Types & Subtypes Covered
- 1.3.2 Geographic Scope – Regions & Countries Covered
- 1.3.3 Historical Period, Base Year & Forecast Period (2024; forecast to 2032)
- 1.3.4 Inclusions & Exclusions
- 1.4 HS Code & Classification Framework
- 1.5 Currency, Units & Pricing Basis
- 1.6 Target Stakeholders
- 1.7 Limitations & Assumptions
Chapter 2. Executive Summary
- 2.1 Global Parking Meter Apps Market Snapshot
- 2.1.1 Market Size – Historical (2024) & Forecast (2024-2032) (2024: USD 97.44 Million → 2032: USD 344.5 Million)
- 2.1.2 Volume & Revenue – Global Totals
- 2.1.3 Key Market Highlights – Top Five Facts
- 2.2 Parking Meter Apps Market Segmentation Snapshot
- 2.2.1 Market Split by Region – 2024 vs. 2032
- 2.3 Competitive Snapshot
- 2.3.1 Top 10 Players by Revenue Share – 2024
- 2.3.2 Top 10 Players by Volume Share – 2024
- 2.3.3 Recent Strategic Developments (18-Month Summary)
- 2.4 Key Investment Highlights & Strategic Conclusions
Chapter 3. Parking Meter Apps Market Dynamics & Industry Analysis
- 3.1 Market Overview & Context
- 3.1.1 Parking Meter Apps Market Position in the Broader Automotive Value Chain
- 3.1.2 OEM vs. Replacement Market Dynamics
- 3.1.3 Market Maturity & Development Stage by Region
- 3.2 Parking Meter Apps Market Drivers
- 3.3 Parking Meter Apps Market Restraints & Challenges
- 3.4 Parking Meter Apps Market Opportunities
- 3.5 Porter's Five Forces Analysis
- 3.5.1 Threat of New Entrants
- 3.5.2 Bargaining Power of Suppliers
- 3.5.3 Bargaining Power of Buyers
- 3.5.4 Threat of Substitutes
- 3.5.5 Competitive Rivalry – Intensity Assessment
- 3.6 Parking Meter Apps Value Chain Analysis
- 3.6.1 Upstream – Raw Material/Input Suppliers
- 3.6.1.1 Raw Material/Input 1
- 3.6.1.2 Raw Material/Input 2
- 3.6.1.3 Raw Material/Input 3
- 3.6.2 Midstream – Production/Manufacturing/Service Delivery
- 3.6.2.1 Production/Process Overview
- 3.6.2.2 Key Facility Locations & Capacity by Manufacturer
- 3.6.3 Downstream – Distribution & End Consumer
- 3.6.3.1 Primary Channel – B2B/OEM
- 3.6.3.2 Secondary Channels – Dealer, Retail, Online, Direct
- 3.6.4 Value Chain Profitability Analysis
- 3.6.1 Upstream – Raw Material/Input Suppliers
- 3.7 PESTEL Analysis
- 3.7.1 Political Factors
- 3.7.2 Economic Factors
- 3.7.3 Social Factors
- 3.7.4 Technological Factors
- 3.7.5 Environmental Factors
- 3.7.6 Legal Factors
- 3.8 Parking Meter Apps Supply Chain Analysis
- 3.8.1 Raw Material/Input Supply Risk Assessment
- 3.8.2 Manufacturing Concentration Risk (Geographic Exposure)
- 3.8.3 Trade Disruption Impact Analysis
- 3.9 Regulatory & Policy Landscape
Note: The regulatory and policy landscape section covers regulations based on their applicability to the market, Parking Meter Apps category, geography, and scope of the study. Only regulatory frameworks with a material impact on operations, compliance, trade, sustainability, or market access are analyzed in detail.
Chapter 4. Key Investment Pockets & Opportunity Analysis
- 4.1 Parking Meter Apps Market Attractiveness Analysis
- 4.1.1 By Region – Investment Attractiveness Matrix (Volume × CAGR)
- 4.2 Absolute Revenue Growth Opportunity
- 4.2.1 By Region – Absolute USD Growth Through 2032
- 4.3 Incremental Volume Opportunity
- 4.3.1 By Region – Incremental Volume Through 2032
- 4.3.2 Segment – Incremental Volume
- 4.4 Emerging Submarket Opportunity Deep Dive (Subject to Applicability)
- 4.5 Emerging Market Opportunity Scorecards
- 4.5.1 United States
- 4.5.2 Europe
- 4.5.3 Asia
- 4.5.4 Middle East & Africa
Note: Emerging Market Opportunity Scorecards will be included based on relevance and strategic importance. Regions listed are indicative and may vary depending on data availability and market dynamics.
Chapter 5. Parking Meter Apps Import-Export Analysis & Trade Flows
- 5.1 Global Trade Overview
- 5.1.1 Global Export Value by Country (2024)
- 5.1.2 Global Export Volume by Country (2024)
- 5.1.3 Global Import Value by Country (2024)
- 5.1.4 Global Import Volume by Country (2024)
- 5.1.5 Net Trade Balance by Country (2024)
- 5.2 Export Analysis – Segment
- 5.2.1 Type 1 (HS Code)
- 5.2.2 Type 2 (HS Code)
- 5.2.3 Type 3 (HS Code)
- 5.2.4 Type 4 (HS Code)
- 5.2.5 Type 5 (HS Code)
- 5.3 Import Analysis – Segment
- 5.3.1 Type 1 (HS Code)
- 5.3.2 Type 2 (HS Code)
- 5.3.3 Type 3 (HS Code)
- 5.3.4 Type 4 (HS Code)
- 5.3.5 Type 5 (HS Code)
- 5.4 Average Unit Trade Prices
- 5.4.1 Average Export Price – Segment & Country
- 5.4.2 Average Import Price – Segment & Source Country
- 5.4.3 Price Trends (2024)
- 5.5 Key Trade Route Analysis
- 5.5.1 Trade Route 1
- 5.5.2 Trade Route 2
- 5.5.3 Trade Route 3
- 5.5.4 Trade Route 4
- 5.5.5 Trade Route 5
- 5.6 Trade Policy Impact Assessment
- 5.6.1 US Anti-Dumping & Section 301 Tariffs
- 5.6.2 EU Customs Union Impact
- 5.6.3 Major Free Trade Agreements
- 5.6.4 USMCA Rules of Origin
Note: Trade policy analysis will be included only where relevant to the Parking Meter Apps market.
Chapter 6. Competitive Landscape & Company Benchmarking
- 6.1 Parking Meter Apps Market Concentration & Structure
- 6.1.1 Herfindahl-Hirschman Index (HHI) – vs. 2024
- 6.1.2 Tier 1, Tier 2 & Tier 3 Market Structure
- 6.1.3 Global, Regional & Local Player Dynamics
- 6.2 Parking Meter Apps Market Share Analysis – 2024
- 6.2.1 Global Revenue Share by Company
- 6.2.2 Global Volume Share by Company
- 6.2.3 Regional Revenue Share
- 6.2.4 Market Share Evolution ( vs. 2024)
- 6.2.5 OEM Segment Share by Company
- 6.2.6 Replacement Segment Share by Company
- 6.3 Production/Delivery Capacity & Facility Analysis
- 6.3.1 Global Installed Capacity
- 6.3.2 Capacity Utilization Rates
- 6.3.3 Production/Output Volume
- 6.3.4 Facility Locations & Capacity Map
- 6.3.5 Planned Capacity Additions
- 6.4 Parking Meter Apps Competitive Benchmarking Matrix
- 6.4.1 Revenue, Volume, CAGR & Profitability Comparison
- 6.4.2 Channel Revenue Mix
- 6.4.3 Geographic Revenue Exposure
- 6.4.4 R&D Intensity
- 6.4.5 Sustainability Maturity
- 6.5 Strategic Developments in Parking Meter Apps (Last 24 Months)
- 6.5.1 Mergers, Acquisitions & Divestments
- 6.5.2 New Parking Meter Apps Launches
- 6.5.3 Facility Expansions
- 6.5.4 Strategic Alliances, Joint Ventures & Partnerships
- 6.5.5 Distribution Expansion & Market Entry
- 6.5.6 Sustainability & ESG Initiatives
- 6.6 Competitive Strategy Mapping
- 6.6.1 Leader, Challenger, Follower & Niche Classification
- 6.6.2 Pricing Strategy Comparison
- 6.6.3 Channel Strategy Matrix
Note: Strategic developments are included based on their materiality and the availability of reliable information.
Chapter 7. Global Parking Meter Apps Market – By Distribution Channel
- 7.1 Segment Overview
- 7.1.1 Volume & Revenue Split by Channel (2024 & 2032)
- 7.1.2 Channel Mix Evolution (2024-2032)
Chapter 8. Regional Market Analysis – Global Overview
- 8.1 Global Regional Overview
- 8.1.1 Regional Volume Share
- 8.1.2 Regional Revenue Share
- 8.1.3 Regional Volume by Region
- 8.1.4 Regional Revenue by Region
- 8.1.5 Regional Forecast Through 2032
- 8.2 Cross-Regional Segment Analysis
- 8.2.1 By Distribution Channel
- 8.2.2 By Brand/Price Tier
Chapter 9. North America Parking Meter Apps Market
- 9.1 United States
- 9.2 Canada
- 9.3 Mexico
Chapter 10. Europe Parking Meter Apps Market
- 10.1 Germany
- 10.2 France
- 10.3 Italy
- 10.4 United Kingdom
- 10.5 Spain
- 10.6 Poland
- 10.7 Russia
- 10.8 Netherlands
- 10.9 Belgium
- 10.10 Sweden
- 10.11 Denmark
- 10.12 Norway
- 10.13 Rest of Europe
Chapter 11. Asia Pacific Parking Meter Apps Market
- 11.1 China
- 11.2 India
- 11.3 Japan
- 11.4 South Korea
- 11.5 Thailand
- 11.6 Indonesia
- 11.7 Vietnam
- 11.8 Malaysia
- 11.9 Australia
- 11.10 Rest of Asia Pacific
Chapter 12. Latin America Parking Meter Apps Market
- 12.1 Brazil
- 12.2 Argentina
- 12.3 Colombia
- 12.4 Chile
- 12.5 Rest of Latin America
Chapter 13. Middle East Parking Meter Apps Market
- 13.1 Saudi Arabia
- 13.2 United Arab Emirates
- 13.3 Turkey
- 13.4 Israel
- 13.5 Iran
- 13.6 Rest of the Middle East
Chapter 14. Africa Parking Meter Apps Market
- 14.1 South Africa
- 14.2 Egypt
- 14.3 Nigeria
- 14.4 Morocco
- 14.5 Rest of Africa
Chapter 15. Parking Meter Apps Company Profiles
- 15.1 [Company 01]
- 15.1.1 Company Overview
- 15.1.2 Key Management Personnel
- 15.1.3 Products & Services Portfolio
- 15.1.4 Financial Performance
- 15.1.5 Key Market Focus & Geographic Presence
- 15.1.6 Recent Developments & Strategic Initiatives
Note: The company profile list is preliminary and may change based on research findings, market developments, data availability, and client requirements.
Chapter 16. Appendices
- Appendix A – List of Abbreviations & Acronyms
- Appendix B – Industry Classification Code Reference – Full Series
- Appendix C – Production & Capacity Data Tables
- Appendix D – End-Use & Demand Base Tables
- Appendix E – Consumption & Replacement Rate Assumptions
- Appendix F – ASP Reference Tables
- Appendix G – Manufacturing & Facility Database
- Appendix H – Import-Export Data Tables
- Appendix I – Regulatory Summary Tables
- Appendix J – Primary Research Participant List (Anonymized)
- Appendix K – Primary Research Questionnaire Framework
- Appendix L – Data Sources & Bibliography
- Appendix M – Market Size Divergence & Source Comparison
Chapter 17. Research Methodology
- 17.1 Research Framework & Philosophy
- 17.2 Secondary Research – Sources, Hierarchy & Data Extraction
- 17.3 Data Modeling – Bottom-Up & Top-Down Market Sizing
- 17.4 Primary Research – Stakeholder Framework, LOI & Sample Sizes
- 17.5 Forecast Methodology – Regression, Scenario & Sensitivity Analysis
- 17.6 Quality Control – Four-Layer Validation Framework
- 17.7 Limitations & Standard Assumptions
- 17.8 Disclaimer
