
Market Overview
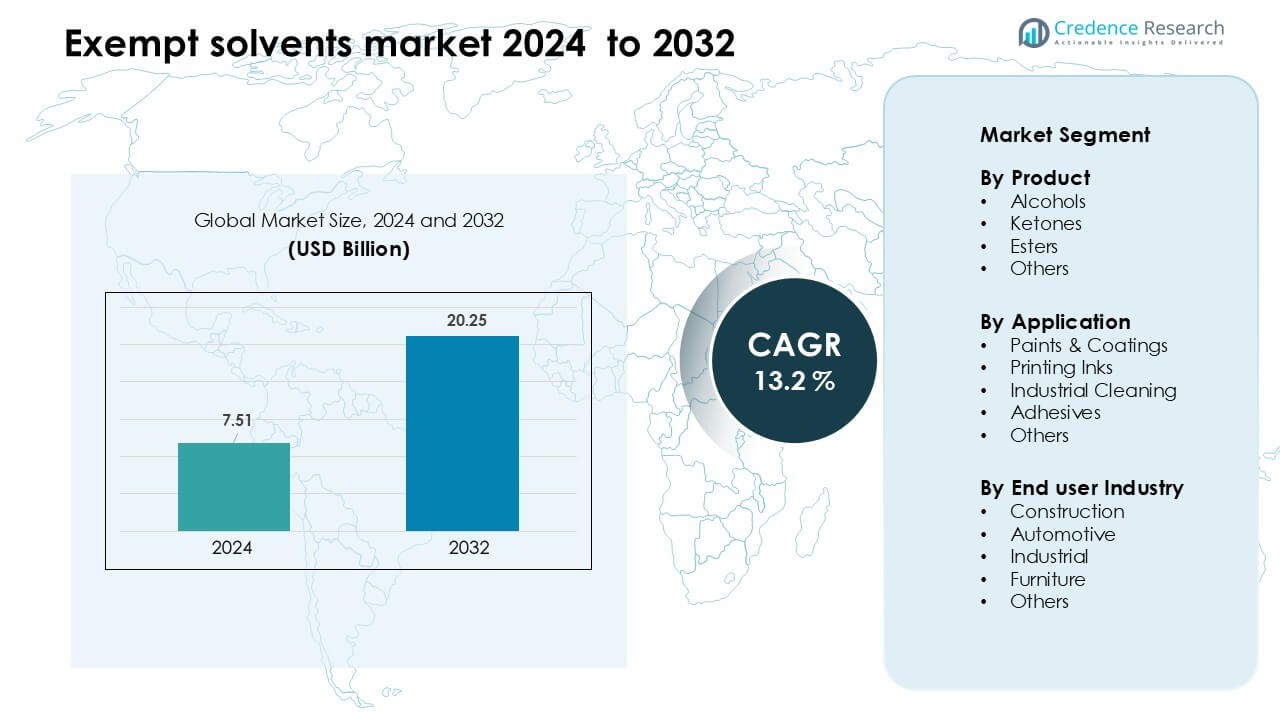
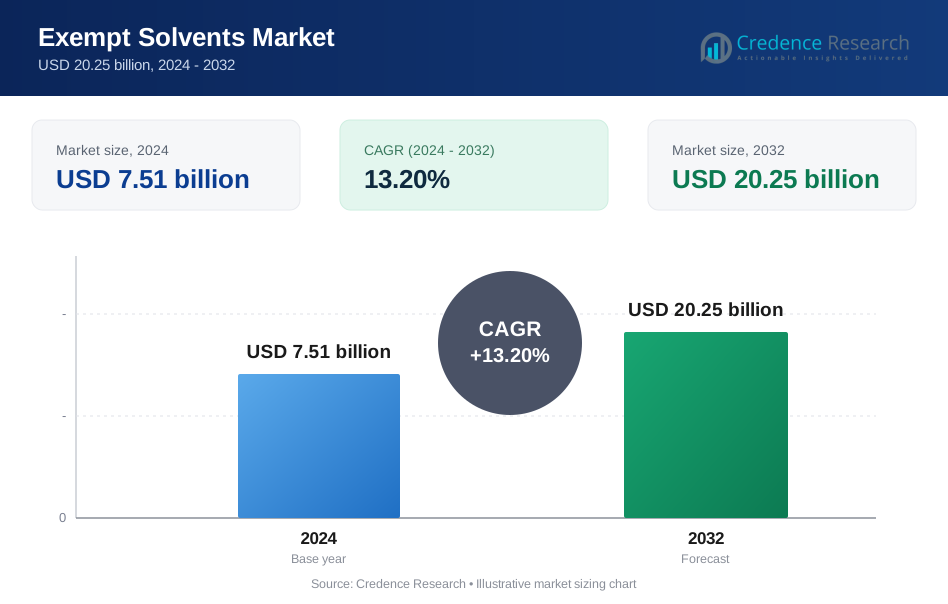
Exempt solvents market was valued at USD 7.51 billion in 2024 and is anticipated to reach USD 20.25 billion by 2032, growing at a CAGR of 13.2 % during the forecast period.
| REPORT ATTRIBUTE | DETAILS |
|---|---|
| Historical Period | 2020-2023 |
| Base Year | 2024 |
| Forecast Period | 2025-2032 |
| Exempt solvents Market Size 2024 | USD 7.51 Billion |
| Exempt solvents Market, CAGR | 13.2 % |
| Exempt solvents Market Size 2032 | USD 20.25 Billion |
The exempt solvents market is shaped by leading companies such as Celanese Corporation, Honeywell International Inc., INEOS, BASF, LyondellBasell Industries Holdings B.V., Exxon Mobil Corporation, Ashland, Gandhar Oil Refinery (India) Limited, Vijay Chemsol, and Moksha Chemicals. These players strengthen their positions through high-purity solvent portfolios, compliant low-VOC formulations, and continued investments in sustainable and bio-based alternatives. They support major end-use sectors such as coatings, printing inks, adhesives, and industrial cleaning with performance-driven solutions. North America remained the leading region in 2024 with about 37% share, supported by strict environmental regulations, strong manufacturing activity, and high adoption of compliant solvent technologies.
Market Insights
- The exempt solvents market reached USD 7.51 billion in 2024 and is projected to hit USD 20.25 billion by 2032, growing at a 13.2 % CAGR.
- Demand grows as stricter VOC regulations push coatings, printing inks, and industrial cleaning manufacturers toward compliant solvent systems, with alcohol-based exempt solvents holding the largest share at 41%.
- A key trend includes rising adoption of bio-based and low-odor solvent grades, driven by sustainability goals and expanding use in high-performance coatings and precision cleaning.
- Competition remains strong among Celanese Corporation, BASF, Honeywell, Exxon Mobil, INEOS, and LyondellBasell, with companies focusing on high-purity blends and expanded regional supply networks.
- North America leads with 37% share, followed by Europe at 30%, supported by strict emission standards, while Asia Pacific grows fastest due to construction, automotive, and industrial expansion.
Market Segmentation Analysis:
By Product
Alcohols dominated the exempt solvents market in 2024 with about 41% share. Strong demand came from manufacturers seeking low-VOC formulations for coatings, inks, and cleaning blends. Alcohol-based exempt solvents offered fast evaporation, high solvency, and broad compatibility with resins, which supported their use in industrial and architectural products. Ketones and esters gained measured growth as producers adopted greener formulations, but alcohols remained ahead due to wider regulatory acceptance and stable supply. Rising pressure to cut emissions and maintain performance continued to drive alcohol adoption across major industrial processes.
- For instance, Eastman Chemical Company offers an LVP-VOC exempt alcohol solvent called EEH, which has a boiling point of 226 °C and a vapor pressure of 0.08 mmHg at 20 °C, providing very low volatility while maintaining strong solvency.
By Application
Paints and coatings held the leading position in 2024 with nearly 46% share. Growth came from rising use of exempt solvents in architectural paints, automotive refinishes, and protective coatings where low-VOC requirements are strict. The segment benefited from strong construction activity and wider adoption of compliant formulations that maintain drying speed and film quality. Printing inks and industrial cleaning followed as manufacturers shifted to safer alternatives. Adhesives also used exempt solvents to meet emission rules, but paints and coatings maintained dominance due to higher production volumes and diverse substrate needs.
- For instance, Eastman Chemical reports that its EEH solvent is widely used in architectural coatings this solvent has a vapor pressure of less than 0.1 mmHg at 20 °C, allowing formulators to use it without counting it as a VOC under many regulations.
By End-User Industry
The construction industry accounted for the largest share in 2024 at around 38%. Demand increased as builders and contractors adopted compliant coatings, sealants, and surface-treatment materials for residential, commercial, and infrastructure projects. Exempt solvents supported fast-drying finishes, improved workability, and lower environmental impact, which aligned with green-building mandates. Automotive and industrial sectors expanded their usage for refinishes, degreasing, and component treatment, while furniture producers used these solvents for clearer finishes. However, construction remained ahead due to continuous project pipelines and strict emission standards across major regions.
Key Growth Drivers
Growing Enforcement of Global VOC Regulations
Stricter VOC regulations across major regions continue to push industries toward exempt solvents to maintain compliance while preserving product performance. Regulatory agencies in North America, Europe, and developed Asian markets enforce emission limits across coatings, inks, adhesives, and industrial cleaners, creating steady demand for low-VOC alternatives. Exempt solvents help manufacturers avoid reformulation delays, approval challenges, and potential distribution barriers linked to non-compliant solvents. Industries also adopt these solvents to meet corporate sustainability targets and reduce environmental impact. As clean-air standards tighten and more regions follow similar regulatory frameworks, exempt solvents gain wider acceptance as reliable, compliant, and high-performing substitutes. This regulatory momentum directly supports market expansion across both mature and emerging industrial sectors, making VOC-driven compliance one of the strongest long-term growth catalysts.
- For instance, the use of double-metal-cyanide (DMC) catalysts for producing high-quality polyether polyols is a well-established and superior alternative to conventional alkaline catalysts like potassium hydroxide (KOH).
Rising Demand for High-Performance Coating Systems
High-performance and specialty coatings increasingly rely on exempt solvents to achieve faster drying, smoother film formation, and consistent viscosity control. Construction, automotive refinishing, and industrial maintenance sectors require coatings that deliver high durability, clarity, and aesthetic quality while meeting environmental regulations. Exempt solvents support premium formulations by enhancing evaporation balance and improving application characteristics, making them ideal for protective, architectural, and metal coatings. Infrastructure development, renovation activity, and the global shift toward durable, low-emission finishes further strengthen demand. Manufacturers continue investing in advanced resin-solvent combinations to achieve better mechanical performance and compliance. As premium coatings gain strong global adoption across new and existing structures, exempt solvents become essential in enabling high-quality, regulation-friendly coating solutions.
- For instance, Eastman Chemical uses its EEH solvent (ethylene glycol 2-ethylhexyl ether) in automotive waterborne basecoat systems, enabling formulations with just 2.0 lb/gal VOC, while providing a very low vapor pressure (~0.02 torr at 25 °C) and a slow evaporation rate (0.003 relative to n-butyl acetate), which helps achieve smooth finishes and good leveling.
Expansion of Industrial Cleaning and Precision Manufacturing
Industrial cleaning processes benefit from exempt solvents because they offer fast evaporation, low toxicity, and strong degreasing performance without increasing regulated VOC emissions. Automotive workshops, metal fabrication units, and electronics facilities use these solvents for maintenance, equipment cleaning, and surface preparation. Precision sectors like aerospace and electronics manufacturing show rising demand due to strict requirements for residue-free cleaning and workplace safety. Exempt solvents support high-throughput operations by reducing downtime and improving consistency in cleaning results. Growing focus on occupational health, indoor-air quality, and safe-use profiles strengthens adoption. As factories modernize maintenance routines and replace hazardous legacy chemicals, exempt solvents gain broader acceptance across diverse industrial workflows.
Key Trend & Opportunity
Shift Toward Bio-Based and Renewable Exempt Solvents
A strong market trend is the shift toward bio-based exempt solvents derived from renewable feedstocks. Companies explore plant-based, fermentation-derived, and biomass-based raw materials to reduce dependence on petrochemical inputs and meet sustainability expectations. These renewable alternatives offer similar solvency and evaporation properties while lowering carbon footprints, helping manufacturers achieve eco-certifications and meet procurement requirements set by global brands. Growing interest in circular-economy practices, resource efficiency, and low-carbon materials accelerates development in this segment. As environmental reporting becomes stricter, bio-based exempt solvents present strong opportunities for premium, sustainable product lines across coatings, inks, and adhesives.
- For instance, GFBiochemicals has leveraged its RE:CHEMISTRY platform (backed by over 200 patents) to commercialize levulinate-based solvents (like butyl levulinate and ethyl levulinate) derived from lignocellulosic biomass, enabling high-solvency bio-solvents with industrial scalability.
Rising Demand for Low-Odor and High-Purity Formulations
Increasing preference for low-odor, clean-handling, and high-purity exempt solvents across printing, automotive, furniture, and electronics sectors drives a key opportunity. These formulations improve workplace comfort, reduce operator exposure, and support sensitive indoor applications. High-purity exempt solvents offer better stability, fewer impurities, and improved compatibility with advanced resins and cleaning systems. Precision manufacturing, electronic component assembly, and high-value finishing segments require such specialty grades to maintain product performance and quality. As industries prioritize cleaner, safer working environments, demand for low-odor solvent solutions continues to rise, creating opportunities for specialty chemical suppliers.
- For instance, Eastman Chemical offers a High-Purity Methyl Acetate solvent with trace metals in the parts-per-billion (ppb) range and a very low odor profile.
Key Challenge
Volatility in Petrochemical Feedstock Prices
Fluctuating prices of petrochemical feedstocks pose a major challenge for exempt solvent producers. Crude oil price instability, supply disruptions, and geopolitical factors significantly influence production costs. Manufacturers often face pressure to adjust prices or absorb margin losses, especially in competitive segments like coatings and adhesives. Smaller producers struggle to maintain steady procurement due to fewer long-term supply contracts. End-user industries, in turn, experience unpredictable cost cycles, complicating budgeting and purchasing decisions. Continued volatility in the petrochemical value chain forces producers to diversify raw material sources and strengthen supply resilience.
Slow Penetration in Emerging Markets
Adoption of exempt solvents in emerging economies remains limited due to low awareness, cost sensitivity, and weak enforcement of VOC standards. Many small and mid-sized manufacturers continue using traditional solvents because they are cheaper upfront and widely familiar. Limited technical training, insufficient regulatory clarity, and fragmented supply networks further slow down the shift toward compliant, lower-emission alternatives. This slows market expansion despite strong long-term potential in construction, automotive, and industrial sectors. For deeper penetration, suppliers must invest in education, formulation support, and regulatory partnerships to highlight performance, safety, and compliance advantages.
Regional Analysis
North America
North America led the exempt solvents market in 2024 with about 37% share, driven by strict VOC regulations and strong adoption across coatings, printing inks, and industrial cleaning applications. The U.S. remained the primary demand center due to advanced manufacturing, automotive refinishing activity, and widespread use of compliant architectural coatings. Growth also came from rising demand for low-odor and high-purity solvents in electronics and precision cleaning. Canada contributed steadily through expanding construction and increased use of environmentally responsible materials. Strong regulatory enforcement and continuous industrial upgrades kept North America in a leading position.
Europe
Europe accounted for nearly 30% share in 2024, supported by stringent environmental policies and accelerated use of eco-friendly solvents in coatings, adhesives, and printing applications. Germany, France, Italy, and the U.K. drove demand through advanced automotive, construction, and industrial sectors. The region’s commitment to low-emission manufacturing and the adoption of circular-economy practices further boosted market expansion. Growth continued as companies invested in bio-based and renewable solvent alternatives. Europe’s strong compliance culture and shift toward green chemistry maintained its position as one of the most regulated and innovation-focused markets for exempt solvents.
Asia Pacific
Asia Pacific held about 24% share in 2024 and showed the fastest growth due to rapid industrialization, expanding construction activity, and increased automotive production. China, Japan, South Korea, and India drove significant demand for compliant coating and cleaning solutions. Rising environmental awareness and gradual implementation of VOC control standards pushed manufacturers toward safer solvent alternatives. Growth of electronics and precision manufacturing further supported high-purity solvent usage. Although adoption varies by country, Asia Pacific’s large industrial base and rising regulatory alignment continued to position the region as a high-potential market.
Latin America
Latin America captured nearly 6% share in 2024, driven by moderate adoption of exempt solvents across construction, automotive refinishing, and industrial cleaning sectors. Brazil and Mexico led demand due to expanding infrastructure activity and increasing interest in compliant coating solutions. While VOC regulations are less strict than in developed regions, gradual policy improvements and growing industry awareness support steady growth. Rising investments in manufacturing and packaging also encourage use of safer solvent alternatives. Limited regulatory enforcement and cost sensitivity still slow adoption, but long-term prospects remain positive.
Middle East & Africa
The Middle East & Africa accounted for around 3% share in 2024, with demand concentrated in construction, industrial maintenance, and automotive aftermarket applications. The UAE, Saudi Arabia, and South Africa led market growth as infrastructure development and industrial diversification increased solvent consumption. Rising awareness of indoor-air quality and occupational safety drove interest in low-VOC products. Adoption remained slower in several countries due to weaker regulatory frameworks and reliance on conventional solvents. However, growing investment in manufacturing and stronger environmental movements are expected to support gradual uptake of exempt solvents in the region.
Market Segmentations:
By Product
- Alcohols
- Ketones
- Esters
- Others
By Application
- Paints & Coatings
- Printing Inks
- Industrial Cleaning
- Adhesives
- Others
By End user
- Construction
- Automotive
- Industrial
- Furniture
- Others
By Geography
- North America
- U.S.
- Canada
- Mexico
- Europe
- Germany
- France
- U.K.
- Italy
- Spain
- Rest of Europe
- Asia Pacific
- China
- Japan
- India
- South Korea
- South-east Asia
- Rest of Asia Pacific
- Latin America
- Brazil
- Argentina
- Rest of Latin America
- Middle East & Africa
- GCC Countries
- South Africa
- Rest of the Middle East and Africa
Competitive Landscape
The exempt solvents market is highly competitive, with major global and regional companies expanding their portfolios to meet rising demand for low-VOC and regulatory-compliant formulations. Key players include Celanese Corporation, Honeywell International Inc., INEOS, BASF, LyondellBasell Industries Holdings B.V., Exxon Mobil Corporation, Ashland, Gandhar Oil Refinery (India) Limited, Vijay Chemsol, and Moksha Chemicals. These companies focus on advanced solvent technologies, high-purity grades, and improved solvency performance to support coatings, inks, adhesives, and industrial cleaning sectors. Leading players invest in R&D to develop environment-friendly and bio-based alternatives, while others strengthen regional presence through partnerships and distribution expansions. Competition intensifies as manufacturers prioritize technical support, cost efficiency, and compliance with evolving VOC standards. The landscape continues to evolve with capacity upgrades and product diversification aimed at meeting performance and sustainability needs across global industries.
Key Player Analysis
- Celanese Corporation (U.S.)
- Moksha Chemicals (India)
- Honeywell International Inc. (U.S.)
- INEOS (U.K)
- BASF (Germany)
- Vijay Chemsol (India)
- Gandhar Oil Refinery (India) Limited (India)
- Ashland (U.S.)
- LyondellBasell Industries Holdings B.V. (Netherlands)
- Exxon Mobil Corporation (U.S.)
Recent Developments
- In November 2025, Moksha Chemicals (India): updated/maintains online product catalog and supplier listings (website and recent PDF/catalog upload show active listings for liquid acetone, mix-xylene and other industrial solvents). as a regional Indian supplier/trader, Moksha’s continued listing and supply of acetone and other industrial solvents supports local downstream availability of commonly used exempt solvents. (site/catalog entries Nov 2025).
- In October 2025, Celanese Corporation (U.S.): announced intent to cease manufacturing at its Lanaken (Belgium) acetate-tow facility (decision communicated Oct 2025; closure planned in 2H 2026). the move follows challenging demand and regulatory uncertainty in acetyl/acetate products and could affect regional supply of acetate-chain products and acetone/acetone-derivative flows tied to that value chain.
- In June 2024, Celanese Corporation (U.S.): declared force majeure on Western-Hemisphere acetic-acid / vinyl acetate monomer and related acetyl-chain products (announcement June 2024), a supply disruption that materially affected availability of ethyl acetate and other acetone-derivative feedstocks used in formulations where exempt-solvent status matters for regulatory compliance
Report Coverage
The research report offers an in-depth analysis based on Product, Application, End-User and Geography. It details leading market players, providing an overview of their business, product offerings, investments, revenue streams, and key applications. Additionally, the report includes insights into the competitive environment, SWOT analysis, current market trends, as well as the primary drivers and constraints. Furthermore, it discusses various factors that have driven market expansion in recent years. The report also explores market dynamics, regulatory scenarios, and technological advancements that are shaping the industry. It assesses the impact of external factors and global economic changes on market growth. Lastly, it provides strategic recommendations for new entrants and established companies to navigate the complexities of the market.
Future Outlook
- The market will grow steadily as more countries enforce stricter VOC emission rules.
- Demand will rise for high-purity exempt solvents used in advanced coatings and precision cleaning.
- Bio-based and renewable solvent options will gain wider adoption across industries.
- Manufacturers will invest more in low-odor and safer formulations for indoor applications.
- Technical innovation will improve solvent stability, performance, and compatibility with modern resins.
- Asia Pacific will become a key growth engine due to rapid industrial expansion.
- Regional players will expand capacity to reduce reliance on imported solvent blends.
- Partnerships between chemical producers and coating formulators will increase.
- Digital monitoring and compliance systems will support faster adoption of low-VOC solutions.
- Competition will intensify as companies focus on sustainability, purity, and regulatory alignment.
Request a Free Sample
Fill in your details and we'll send you a free sample report.
- Sample data tables & charts
- Research methodology
Need a Custom Version of This Report?
Tailor the scope, geography, or segments to your exact requirements.
- Custom geography or segment scope
- Direct access to our analyst team
Frequently Asked Questions
What is the current market size for Exempt solvents market, and what is its projected size in 2032?
At what Compound Annual Growth Rate is the Exempt solvents market projected to grow between 2025 and 2032?
Which Exempt solvents market segment held the largest share in 2024?
What are the primary factors fueling the growth of the Exempt solvents market?
Who are the leading companies in the Exempt solvents market?
Which region commanded the largest share of the Exempt solvents market?
Table of Content
Chapter 1. Report Introduction
- 1.1 Report Description & Purpose
- 1.1.1 Report Title & Market Definition
- 1.1.2 Unique Selling Propositions (USP) & Key Differentiators
- 1.1.3 Value Proposition for Stakeholders
- 1.2 Research Objectives
- 1.2.1 Market Sizing Objectives (Volume & Revenue)
- 1.2.2 Segmentation Objectives
- 1.2.3 Competitive Intelligence Objectives
- 1.2.4 Forecast & Scenario Objectives
- 1.3 Report Scope
- 1.3.1 Exempt Solvents Scope – Types & Subtypes Covered
- 1.3.2 Geographic Scope – Regions & Countries Covered
- 1.3.3 Historical Period, Base Year & Forecast Period (2024; forecast to 2032)
- 1.3.4 Inclusions & Exclusions
- 1.4 HS Code & Classification Framework
- 1.5 Currency, Units & Pricing Basis
- 1.6 Target Stakeholders
- 1.7 Limitations & Assumptions
Chapter 2. Executive Summary
- 2.1 Global Exempt Solvents Market Snapshot
- 2.1.1 Market Size – Historical (2024) & Forecast (2024-2032) (2024: USD 7.51 billion → 2032: USD 20.25 billion)
- 2.1.2 Volume & Revenue – Global Totals
- 2.1.3 Key Market Highlights – Top Five Facts
- 2.2 Exempt Solvents Market Segmentation Snapshot
- 2.2.1 Market Split by Region – 2024 vs. 2032
- 2.3 Competitive Snapshot
- 2.3.1 Top 10 Players by Revenue Share – 2024
- 2.3.2 Top 10 Players by Volume Share – 2024
- 2.3.3 Recent Strategic Developments (18-Month Summary)
- 2.4 Key Investment Highlights & Strategic Conclusions
Chapter 3. Exempt Solvents Market Dynamics & Industry Analysis
- 3.1 Market Overview & Context
- 3.1.1 Exempt Solvents Market Position in the Broader Automotive Value Chain
- 3.1.2 OEM vs. Replacement Market Dynamics
- 3.1.3 Market Maturity & Development Stage by Region
- 3.2 Exempt Solvents Market Drivers
- 3.3 Exempt Solvents Market Restraints & Challenges
- 3.4 Exempt Solvents Market Opportunities
- 3.5 Porter's Five Forces Analysis
- 3.5.1 Threat of New Entrants
- 3.5.2 Bargaining Power of Suppliers
- 3.5.3 Bargaining Power of Buyers
- 3.5.4 Threat of Substitutes
- 3.5.5 Competitive Rivalry – Intensity Assessment
- 3.6 Exempt Solvents Value Chain Analysis
- 3.6.1 Upstream – Raw Material/Input Suppliers
- 3.6.1.1 Raw Material/Input 1
- 3.6.1.2 Raw Material/Input 2
- 3.6.1.3 Raw Material/Input 3
- 3.6.2 Midstream – Production/Manufacturing/Service Delivery
- 3.6.2.1 Production/Process Overview
- 3.6.2.2 Key Facility Locations & Capacity by Manufacturer
- 3.6.3 Downstream – Distribution & End Consumer
- 3.6.3.1 Primary Channel – B2B/OEM
- 3.6.3.2 Secondary Channels – Dealer, Retail, Online, Direct
- 3.6.4 Value Chain Profitability Analysis
- 3.6.1 Upstream – Raw Material/Input Suppliers
- 3.7 PESTEL Analysis
- 3.7.1 Political Factors
- 3.7.2 Economic Factors
- 3.7.3 Social Factors
- 3.7.4 Technological Factors
- 3.7.5 Environmental Factors
- 3.7.6 Legal Factors
- 3.8 Exempt Solvents Supply Chain Analysis
- 3.8.1 Raw Material/Input Supply Risk Assessment
- 3.8.2 Manufacturing Concentration Risk (Geographic Exposure)
- 3.8.3 Trade Disruption Impact Analysis
- 3.9 Regulatory & Policy Landscape
Note: The regulatory and policy landscape section covers regulations based on their applicability to the market, Exempt Solvents category, geography, and scope of the study. Only regulatory frameworks with a material impact on operations, compliance, trade, sustainability, or market access are analyzed in detail.
Chapter 4. Key Investment Pockets & Opportunity Analysis
- 4.1 Exempt Solvents Market Attractiveness Analysis
- 4.1.1 By Region – Investment Attractiveness Matrix (Volume × CAGR)
- 4.2 Absolute Revenue Growth Opportunity
- 4.2.1 By Region – Absolute USD Growth Through 2032
- 4.3 Incremental Volume Opportunity
- 4.3.1 By Region – Incremental Volume Through 2032
- 4.3.2 Segment – Incremental Volume
- 4.4 Emerging Submarket Opportunity Deep Dive (Subject to Applicability)
- 4.5 Emerging Market Opportunity Scorecards
- 4.5.1 United States
- 4.5.2 Europe
- 4.5.3 Asia
- 4.5.4 Middle East & Africa
Note: Emerging Market Opportunity Scorecards will be included based on relevance and strategic importance. Regions listed are indicative and may vary depending on data availability and market dynamics.
Chapter 5. Exempt Solvents Import-Export Analysis & Trade Flows
- 5.1 Global Trade Overview
- 5.1.1 Global Export Value by Country (2024)
- 5.1.2 Global Export Volume by Country (2024)
- 5.1.3 Global Import Value by Country (2024)
- 5.1.4 Global Import Volume by Country (2024)
- 5.1.5 Net Trade Balance by Country (2024)
- 5.2 Export Analysis – Segment
- 5.2.1 Type 1 (HS Code)
- 5.2.2 Type 2 (HS Code)
- 5.2.3 Type 3 (HS Code)
- 5.2.4 Type 4 (HS Code)
- 5.2.5 Type 5 (HS Code)
- 5.3 Import Analysis – Segment
- 5.3.1 Type 1 (HS Code)
- 5.3.2 Type 2 (HS Code)
- 5.3.3 Type 3 (HS Code)
- 5.3.4 Type 4 (HS Code)
- 5.3.5 Type 5 (HS Code)
- 5.4 Average Unit Trade Prices
- 5.4.1 Average Export Price – Segment & Country
- 5.4.2 Average Import Price – Segment & Source Country
- 5.4.3 Price Trends (2024)
- 5.5 Key Trade Route Analysis
- 5.5.1 Trade Route 1
- 5.5.2 Trade Route 2
- 5.5.3 Trade Route 3
- 5.5.4 Trade Route 4
- 5.5.5 Trade Route 5
- 5.6 Trade Policy Impact Assessment
- 5.6.1 US Anti-Dumping & Section 301 Tariffs
- 5.6.2 EU Customs Union Impact
- 5.6.3 Major Free Trade Agreements
- 5.6.4 USMCA Rules of Origin
Note: Trade policy analysis will be included only where relevant to the Exempt Solvents market.
Chapter 6. Competitive Landscape & Company Benchmarking
- 6.1 Exempt Solvents Market Concentration & Structure
- 6.1.1 Herfindahl-Hirschman Index (HHI) – vs. 2024
- 6.1.2 Tier 1, Tier 2 & Tier 3 Market Structure
- 6.1.3 Global, Regional & Local Player Dynamics
- 6.2 Exempt Solvents Market Share Analysis – 2024
- 6.2.1 Global Revenue Share by Company
- 6.2.2 Global Volume Share by Company
- 6.2.3 Regional Revenue Share
- 6.2.4 Market Share Evolution ( vs. 2024)
- 6.2.5 OEM Segment Share by Company
- 6.2.6 Replacement Segment Share by Company
- 6.3 Production/Delivery Capacity & Facility Analysis
- 6.3.1 Global Installed Capacity
- 6.3.2 Capacity Utilization Rates
- 6.3.3 Production/Output Volume
- 6.3.4 Facility Locations & Capacity Map
- 6.3.5 Planned Capacity Additions
- 6.4 Exempt Solvents Competitive Benchmarking Matrix
- 6.4.1 Revenue, Volume, CAGR & Profitability Comparison
- 6.4.2 Channel Revenue Mix
- 6.4.3 Geographic Revenue Exposure
- 6.4.4 R&D Intensity
- 6.4.5 Sustainability Maturity
- 6.5 Strategic Developments in Exempt Solvents (Last 24 Months)
- 6.5.1 Mergers, Acquisitions & Divestments
- 6.5.2 New Exempt Solvents Launches
- 6.5.3 Facility Expansions
- 6.5.4 Strategic Alliances, Joint Ventures & Partnerships
- 6.5.5 Distribution Expansion & Market Entry
- 6.5.6 Sustainability & ESG Initiatives
- 6.6 Competitive Strategy Mapping
- 6.6.1 Leader, Challenger, Follower & Niche Classification
- 6.6.2 Pricing Strategy Comparison
- 6.6.3 Channel Strategy Matrix
Note: Strategic developments are included based on their materiality and the availability of reliable information.
Chapter 7. Global Exempt Solvents Market – By Distribution Channel
- 7.1 Segment Overview
- 7.1.1 Volume & Revenue Split by Channel (2024 & 2032)
- 7.1.2 Channel Mix Evolution (2024-2032)
Chapter 8. Regional Market Analysis – Global Overview
- 8.1 Global Regional Overview
- 8.1.1 Regional Volume Share
- 8.1.2 Regional Revenue Share
- 8.1.3 Regional Volume by Region
- 8.1.4 Regional Revenue by Region
- 8.1.5 Regional Forecast Through 2032
- 8.2 Cross-Regional Segment Analysis
- 8.2.1 By Distribution Channel
- 8.2.2 By Brand/Price Tier
Chapter 9. North America Exempt Solvents Market
- 9.1 United States
- 9.2 Canada
- 9.3 Mexico
Chapter 10. Europe Exempt Solvents Market
- 10.1 Germany
- 10.2 France
- 10.3 Italy
- 10.4 United Kingdom
- 10.5 Spain
- 10.6 Poland
- 10.7 Russia
- 10.8 Netherlands
- 10.9 Belgium
- 10.10 Sweden
- 10.11 Denmark
- 10.12 Norway
- 10.13 Rest of Europe
Chapter 11. Asia Pacific Exempt Solvents Market
- 11.1 China
- 11.2 India
- 11.3 Japan
- 11.4 South Korea
- 11.5 Thailand
- 11.6 Indonesia
- 11.7 Vietnam
- 11.8 Malaysia
- 11.9 Australia
- 11.10 Rest of Asia Pacific
Chapter 12. Latin America Exempt Solvents Market
- 12.1 Brazil
- 12.2 Argentina
- 12.3 Colombia
- 12.4 Chile
- 12.5 Rest of Latin America
Chapter 13. Middle East Exempt Solvents Market
- 13.1 Saudi Arabia
- 13.2 United Arab Emirates
- 13.3 Turkey
- 13.4 Israel
- 13.5 Iran
- 13.6 Rest of the Middle East
Chapter 14. Africa Exempt Solvents Market
- 14.1 South Africa
- 14.2 Egypt
- 14.3 Nigeria
- 14.4 Morocco
- 14.5 Rest of Africa
Chapter 15. Exempt Solvents Company Profiles
- 15.1 [Company 01]
- 15.1.1 Company Overview
- 15.1.2 Key Management Personnel
- 15.1.3 Products & Services Portfolio
- 15.1.4 Financial Performance
- 15.1.5 Key Market Focus & Geographic Presence
- 15.1.6 Recent Developments & Strategic Initiatives
Note: The company profile list is preliminary and may change based on research findings, market developments, data availability, and client requirements.
Chapter 16. Appendices
- Appendix A – List of Abbreviations & Acronyms
- Appendix B – Industry Classification Code Reference – Full Series
- Appendix C – Production & Capacity Data Tables
- Appendix D – End-Use & Demand Base Tables
- Appendix E – Consumption & Replacement Rate Assumptions
- Appendix F – ASP Reference Tables
- Appendix G – Manufacturing & Facility Database
- Appendix H – Import-Export Data Tables
- Appendix I – Regulatory Summary Tables
- Appendix J – Primary Research Participant List (Anonymized)
- Appendix K – Primary Research Questionnaire Framework
- Appendix L – Data Sources & Bibliography
- Appendix M – Market Size Divergence & Source Comparison
Chapter 17. Research Methodology
- 17.1 Research Framework & Philosophy
- 17.2 Secondary Research – Sources, Hierarchy & Data Extraction
- 17.3 Data Modeling – Bottom-Up & Top-Down Market Sizing
- 17.4 Primary Research – Stakeholder Framework, LOI & Sample Sizes
- 17.5 Forecast Methodology – Regression, Scenario & Sensitivity Analysis
- 17.6 Quality Control – Four-Layer Validation Framework
- 17.7 Limitations & Standard Assumptions
- 17.8 Disclaimer
