
Market Overview
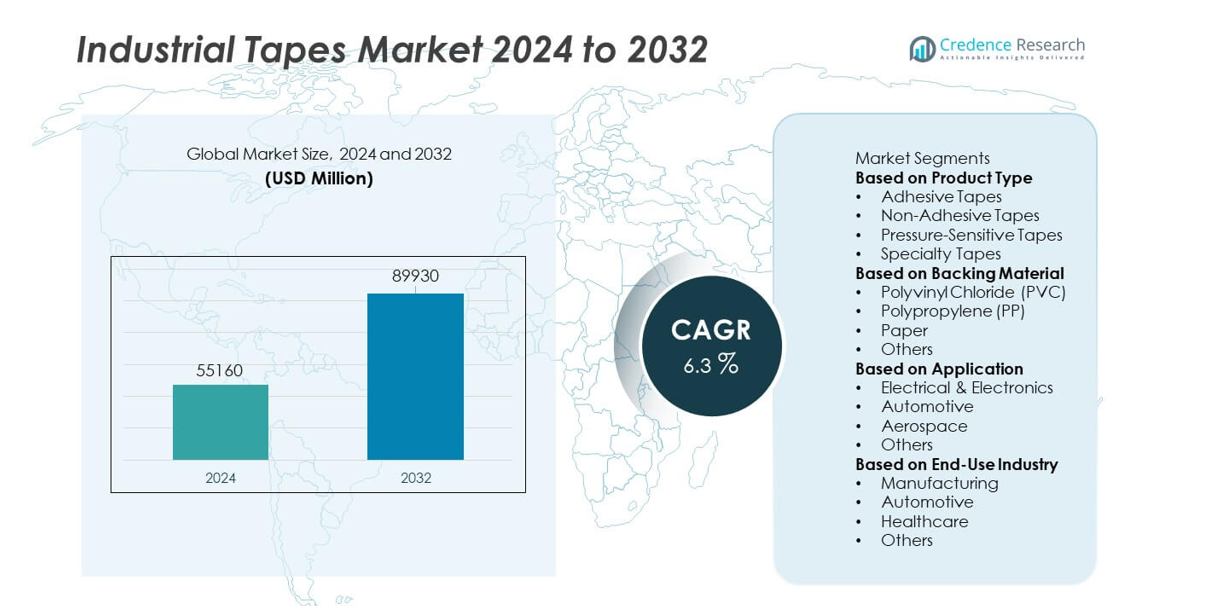
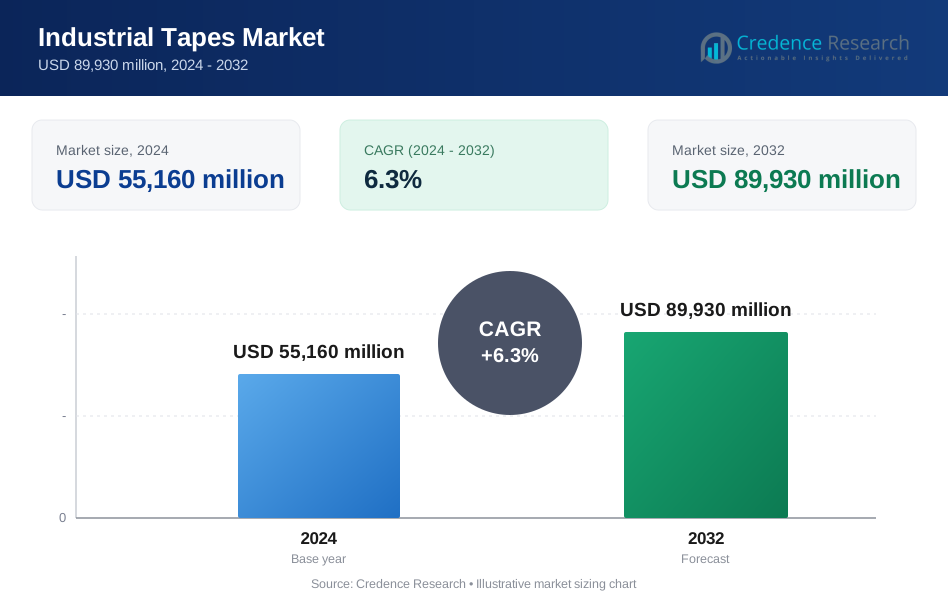
The Industrial Tapes market was valued at USD 55,160 million in 2024 and is projected to reach USD 89,930 million by 2032, registering a CAGR of 6.3% during the forecast period.
| REPORT ATTRIBUTE | DETAILS |
|---|---|
| Historical Period | 2020-2023 |
| Base Year | 2024 |
| Forecast Period | 2025-2032 |
| Industrial Tapes Market Size 2024 | USD 55,160 million |
| Industrial Tapes Market, CAGR | 6.3% |
| Industrial Tapes Market Size 2032 | USD 89,930 million |
The top players in the Industrial Tapes market—3M Company, Avery Dennison Corporation, Nitto Denko Corporation, Tesa SE, Saint-Gobain Performance Plastics, Intertape Polymer Group, Scapa Group, Henkel AG & Co. KGaA, Berry Global Inc., and Lintec Corporation—drive market growth through advanced adhesive technologies, durable backing materials, and high-performance bonding solutions. These companies focus on innovation in pressure-sensitive, specialty, and temperature-resistant tapes to support automotive, electronics, aerospace, and construction applications. Asia Pacific leads the market with a 31% share, driven by large-scale manufacturing and strong industrial expansion. North America follows with 33%, supported by high adoption of specialty tapes, while Europe holds 28%, strengthened by automotive production and strict quality standards.
Market Insights
- The Industrial Tapes market reached USD 55,160 million in 2024 and is set to reach USD 89,930 million by 2032 at a CAGR of 6.3%, highlighting steady global demand.
- Growth strengthens as manufacturers shift to high-performance bonding solutions, with Adhesive Tapes holding a 52% segment share due to wide use in packaging, electronics, and automotive assembly.
- Key trends include rising adoption of specialty, heat-resistant, and eco-friendly tapes, along with increased usage in EV production, automation, and lightweight component bonding across major industries.
- Competition intensifies as leading players such as 3M, Avery Dennison, Nitto Denko, Tesa SE, and Henkel invest in sustainable adhesives, R&D expansion, and advanced pressure-sensitive technologies to improve performance.
- Regional demand is led by North America at 33%, Asia Pacific at 31%, and Europe at 28%, supported by strong industrial manufacturing, construction growth, and rising electronics production across these markets.
Market Segmentation Analysis:
By Product Type
Adhesive Tapes dominate this segment with a market share of 52%, driven by strong demand across packaging, automotive assembly, electronics insulation, and industrial bonding applications. Pressure-Sensitive Tapes continue to expand as manufacturers adopt quick-apply, residue-free solutions for high-speed production lines. Specialty Tapes gain traction in aerospace, construction, and HVAC due to enhanced durability and heat resistance. Non-Adhesive Tapes maintain use in electrical insulation and bundling tasks. Growth in this segment is fueled by lightweight bonding needs, reduced mechanical fasteners, and rising automation in manufacturing processes.
- For instance, 3M's VHB tape line includes an acrylic foam variant designed to withstand continuous temperatures of 150°C (300°F) and short-term exposure up to 230°C (450°F). This product can be used for structural bonding in applications like automotive panels and battery enclosures, offering immediate handling strength upon contact, which can improve production efficiency for manufacturers by eliminating the need for cure time.
By Backing Material
Polyvinyl Chloride (PVC) leads the backing material category with a market share of 41%, supported by its flexibility, electrical resistance, and suitability for insulation and surface protection. Polypropylene (PP) tapes grow rapidly due to strong tensile strength and cost efficiency in packaging and logistics. Paper-backed tapes gain traction in masking, painting, and eco-friendly applications. Other materials, including foam and cloth, cater to vibration damping and sealing needs. Demand increases as industries seek durable, temperature-stable, and moisture-resistant tape solutions for diverse operational environments.
- For instance, Avery Dennison is a global materials science company that develops various pressure-sensitive adhesive materials and specialty products, including sustainable options for packaging. The company focuses on innovative solutions suitable for applications like high-speed logistics and automated sealing lines.
By Application
Electrical & Electronics represent the dominant application with a market share of 36%, driven by high usage in insulation, circuit assembly, EMI shielding, and component protection. Automotive applications expand as manufacturers adopt tapes for wire harnessing, interior bonding, noise reduction, and lightweight structural assembly. Aerospace relies on high-performance tapes for thermal insulation, composite bonding, and vibration control. Other industrial uses include construction, packaging, and general assembly tasks. Market growth is fueled by miniaturization of electronics, rising EV production, and increasing demand for high-reliability bonding materials across advanced manufacturing sectors.
Key Growth Drivers
Rising Demand for High-Performance Bonding Solutions
Industrial tapes gain adoption as manufacturers shift from mechanical fasteners to lightweight, high-strength bonding materials. These tapes offer strong adhesion, vibration resistance, and improved durability across automotive, electronics, and construction sectors. Companies use advanced tapes for cable management, insulation, assembly, and component protection. Growth accelerates as industries reduce production time and enhance structural integrity. The shift toward lightweight materials in automotive and aerospace further increases demand for reliable, flexible, and efficient bonding solutions.
- For instance, Tesa SE developed an acrylic foam bonding tape designed for automotive exterior trims, validated to deliver a shear strength of 1,200 N and withstand thermal cycling between –40°C and 120°C for 2,000 cycles. The material also passed a 1,500-hour salt spray corrosion test, supporting its use in long-life vehicle body assemblies.
Expansion of Electronics and Electrical Manufacturing
The electronics sector drives strong demand for insulation, shielding, thermal management, and component mounting tapes. Industrial tapes support high-speed assembly processes and meet strict performance standards for heat resistance and dielectric strength. Growth in smartphones, appliances, circuit boards, and renewable energy systems increases tape consumption. Manufacturers adopt specialized tapes for EMI protection and microelectronic bonding. Rising automation and miniaturization trends strengthen demand for precision-engineered tapes across global electronics production hubs.
- For instance, Nitto Denko offers polyimide-based insulation tapes, some of which are rated for continuous operation at temperatures up to 260°C. Polyimide tapes from other manufacturers typically feature a dielectric strength around 7,500 V (volts).
Growing Construction and Infrastructure Activities
Construction projects rely on industrial tapes for sealing, bonding, flooring installation, HVAC insulation, and moisture control. Rising urbanization and industrial expansion stimulate demand for durable, weather-resistant tapes. Manufacturers benefit from growing use of tapes in window sealing, structural reinforcement, and safety marking. Increasing adoption of energy-efficient buildings boosts usage of thermal insulation and vapor-barrier tapes. As infrastructure upgrades expand globally, the requirement for high-performance tapes continues to rise in both residential and commercial development.
Key Trends & Opportunities
Shift Toward Sustainable and Eco-Friendly Tape Materials
Industries adopt sustainable tapes made from recyclable backings, solvent-free adhesives, and low-VOC formulations. Growing regulatory pressure and corporate sustainability goals accelerate this trend. Manufacturers develop biodegradable paper tapes and energy-efficient production methods to meet environmental standards. Opportunities expand for companies offering green adhesive technologies and eco-certified products. Demand grows across packaging, construction, and electronics as buyers prioritize safer and environmentally responsible materials.
- For instance, Saint-Gobain Performance Plastics offers a wide array of high-performance adhesive tapes, including water-based systems and those designed with sustainability in mind.
Advancements in High-Temperature and Specialty Tapes
Specialty tapes gain momentum in aerospace, automotive, and electronics due to their heat resistance, flame retardancy, and chemical durability. Manufacturers introduce silicone-based, PTFE, and foam-backed tapes for harsh operating conditions. The rise of electric vehicles, composite materials, and high-power electronics drives increasing need for thermal and high-strength bonding solutions. Opportunities emerge for companies offering customized tapes engineered for extreme environments and complex industrial applications.
- For instance, other manufacturers developed a silicone-glass tape rated for continuous operation up to 200°C (392°F) which can withstand peak temperatures up to 260°C (500°F), with a typical dielectric breakdown of 3,000 V.
Key Challenges
Fluctuating Raw Material Prices
Industrial tapes rely heavily on raw materials such as polymers, resins, and adhesives, which face frequent price volatility due to supply constraints and petrochemical market fluctuations. This instability increases production costs and squeezes manufacturer margins. Companies struggle to maintain consistent pricing and supply stability. Global disruptions in logistics, energy costs, and chemical feedstocks further intensify this challenge, impacting large and small producers alike.
Competition from Low-Cost Manufacturers
The market faces strong competition from low-cost producers offering cheaper alternatives with reduced performance. Price-sensitive sectors may choose these products despite lower durability, affecting premium tape manufacturers. Established players must invest in innovation, branding, and quality assurance to differentiate themselves. Counterfeit and substandard products also enter emerging markets, creating reliability concerns. High competition pressures companies to enhance efficiency and maintain strong value propositions across applications.
Regional Analysis
North America
North America holds a market share of 33% in the Industrial Tapes market, driven by strong demand across automotive manufacturing, electronics assembly, aerospace applications, and construction activities. The region benefits from advanced production facilities, high adoption of specialty tapes, and strong emphasis on lightweight bonding materials. Investments in EV manufacturing and high-performance electronics boost the use of thermal, insulation, and pressure-sensitive tapes. Regulatory focus on safety, energy efficiency, and durable building materials further increases adoption. Key manufacturers expand R&D capabilities in the U.S. and Canada to meet rising demand for high-strength and temperature-resistant tapes.
Europe
Europe accounts for a market share of 28%, supported by growing adoption of industrial tapes in automotive, aerospace, packaging, and renewable energy systems. The region benefits from stringent environmental regulations, which encourage the use of eco-friendly, low-VOC, and sustainable adhesive solutions. Germany, France, and the U.K. lead demand due to advanced manufacturing bases and strong automation trends. Industrial tapes play a vital role in lightweight vehicle design and high-performance electronics production. The rise in infrastructure renovation and green building initiatives also contributes to steady demand across diverse industrial sectors.
Asia Pacific
Asia Pacific dominates application-driven growth with a market share of 31%, fueled by large-scale manufacturing in China, India, Japan, and South Korea. Rapid industrial expansion, rising electronics production, and strong automotive output create significant demand for high-strength, insulation, and specialty tapes. The region benefits from cost-effective production capabilities and increasing investments in industrial automation. Growing construction activities and infrastructure development also support consumption. As global supply chains shift toward Asia Pacific, the need for durable and versatile industrial tapes continues to strengthen across key manufacturing industries.
Latin America
Latin America holds a market share of 5%, driven by expanding automotive assembly, construction activities, and rising adoption of industrial packaging solutions. Brazil and Mexico lead demand due to growing manufacturing bases and increasing modernization of production facilities. Industrial tapes support electrical insulation, bonding, sealing, and safety applications across developing industrial sectors. While economic fluctuations influence spending patterns, ongoing investments in infrastructure, consumer goods production, and logistics continue to support market growth. The shift toward more durable and reliable adhesive materials further enhances adoption across regional industries.
Middle East & Africa
The Middle East & Africa region accounts for a market share of 3%, supported by increasing industrialization, construction activities, and rising adoption of electrical and HVAC tapes. GCC countries drive demand through large-scale infrastructure projects and industrial diversification. Industrial tapes gain traction in oil and gas operations, electrical maintenance, and building insulation applications. Africa shows growing usage in packaging, automotive repair, and small-scale manufacturing. Although limited industrial capacity and slower technological adoption pose challenges, ongoing investments in construction and energy sectors continue to drive gradual market expansion.
Market Segmentations:
By Product Type
- Adhesive Tapes
- Non-Adhesive Tapes
- Pressure-Sensitive Tapes
- Specialty Tapes
By Backing Material
- Polyvinyl Chloride (PVC)
- Polypropylene (PP)
- Paper
- Others
By Application
- Electrical & Electronics
- Automotive
- Aerospace
- Others
By End-Use Industry
- Manufacturing
- Automotive
- Healthcare
- Others
By Geography
- North America
- U.S.
- Canada
- Mexico
- Europe
- Germany
- France
- U.K.
- Italy
- Spain
- Rest of Europe
- Asia Pacific
- China
- Japan
- India
- South Korea
- South-east Asia
- Rest of Asia Pacific
- Latin America
- Brazil
- Argentina
- Rest of Latin America
- Middle East & Africa
- GCC Countries
- South Africa
- Rest of the Middle East and Africa
Competitive Landscape
The competitive landscape or analysis features major players such as 3M Company, Avery Dennison Corporation, Nitto Denko Corporation, Tesa SE, Saint-Gobain Performance Plastics, Intertape Polymer Group, Scapa Group, Henkel AG & Co. KGaA, Berry Global Inc., and Lintec Corporation. These companies compete by offering advanced adhesive technologies, high-strength bonding solutions, and specialized tapes designed for automotive, electronics, aerospace, and construction applications. Manufacturers invest in R&D to develop heat-resistant, eco-friendly, and high-performance tapes aligned with evolving industry standards. Strategic partnerships with OEMs, expansion of production facilities, and acquisitions strengthen their global presence. Many key players focus on sustainability through solvent-free adhesives, recyclable backings, and reduced VOC formulations. Continuous innovation in pressure-sensitive, specialty, and high-temperature tapes enhances competitiveness. As industries shift toward lightweight materials and faster assembly processes, leading companies enhance product reliability, durability, and customization capabilities to secure a larger share of the global Industrial Tapes market.
Key Player Analysis
- 3M Company
- Avery Dennison Corporation
- Nitto Denko Corporation
- Tesa SE
- Saint-Gobain Performance Plastics
- Intertape Polymer Group (IPG)
- Scapa Group
- Henkel AG & Co. KGaA
- Berry Global Inc.
- Lintec Corporation
Recent Developments
- In 2025, Nitto Denko Corporation is continuing its ongoing strategy of innovating and expanding its high-performance specialty tapes portfolio for the electronics, automotive, and industrial sectors, rather than announcing a new, singular expansion.
- In September 2023, Intertape Polymer Group (IPG) introduced the "170e" water-driven acrylic pressure-sensitive carton sealing tape.
- In February 2023, 3M Company launched a medical-grade pressure-sensitive adhesive tape capable of lasting up to four weeks, aimed at improving remote monitoring and long-term secure adhesion
Report Coverage
The research report offers an in-depth analysis based on Product Type, Backing Material, Application, End-Use Industry and Geography. It details leading market players, providing an overview of their business, product offerings, investments, revenue streams, and key applications. Additionally, the report includes insights into the competitive environment, SWOT analysis, current market trends, as well as the primary drivers and constraints. Furthermore, it discusses various factors that have driven market expansion in recent years. The report also explores market dynamics, regulatory scenarios, and technological advancements that are shaping the industry. It assesses the impact of external factors and global economic changes on market growth. Lastly, it provides strategic recommendations for new entrants and established companies to navigate the complexities of the market.
Future Outlook
- Demand for high-strength bonding solutions will rise as industries move away from mechanical fasteners.
- Specialty tapes will gain wider adoption in EVs, aerospace components, and advanced electronics.
- Sustainable adhesive technologies will expand as companies shift to low-VOC and recyclable tape materials.
- Automation in manufacturing will drive the need for fast-applying, pressure-sensitive tapes.
- Heat-resistant and flame-retardant tapes will see strong growth in high-temperature and safety-critical applications.
- Growth in construction and infrastructure projects will expand usage of sealing, insulation, and protective tapes.
- Demand for lightweight materials will push industries toward tapes designed for structural bonding and noise reduction.
- Emerging markets will increase consumption as manufacturing capacity and industrial investments expand.
- Smart tapes with conductive or thermal properties will gain traction in electronics and next-gen devices.
- Supply chain optimization and localized production will become key strategies for global tape manufacturers.
Request a Free Sample
Fill in your details and we'll send you a free sample report.
- Sample data tables & charts
- Research methodology
Need a Custom Version of This Report?
Tailor the scope, geography, or segments to your exact requirements.
- Custom geography or segment scope
- Direct access to our analyst team
Frequently Asked Questions
What is the current market size for the Industrial Tapes market, and what is its projected size in 2032?
At what Compound Annual Growth Rate is the Industrial Tapes market projected to grow between 2025 and 2032?
Who are the major players in this market?
What are the primary factors fueling the growth of the Industrial Tapes market
Who are the leading companies in the Industrial Tapes market?
Table of Content
Chapter 1. Report Introduction
- 1.1 Report Description & Purpose
- 1.1.1 Report Title & Market Definition
- 1.1.2 Unique Selling Propositions (USP) & Key Differentiators
- 1.1.3 Value Proposition for Stakeholders
- 1.2 Research Objectives
- 1.2.1 Market Sizing Objectives (Volume & Revenue)
- 1.2.2 Segmentation Objectives
- 1.2.3 Competitive Intelligence Objectives
- 1.2.4 Forecast & Scenario Objectives
- 1.3 Report Scope
- 1.3.1 Industrial Tapes Scope – Types & Subtypes Covered
- 1.3.2 Geographic Scope – Regions & Countries Covered
- 1.3.3 Historical Period, Base Year & Forecast Period (2024; forecast to 2032)
- 1.3.4 Inclusions & Exclusions
- 1.4 HS Code & Classification Framework
- 1.5 Currency, Units & Pricing Basis
- 1.6 Target Stakeholders
- 1.7 Limitations & Assumptions
Chapter 2. Executive Summary
- 2.1 Global Industrial Tapes Market Snapshot
- 2.1.1 Market Size – Historical (2024) & Forecast (2024-2032) (2024: USD 55,160 million → 2032: USD 89,930 million)
- 2.1.2 Volume & Revenue – Global Totals
- 2.1.3 Key Market Highlights – Top Five Facts
- 2.2 Industrial Tapes Market Segmentation Snapshot
- 2.2.1 Market Split by Region – 2024 vs. 2032
- 2.3 Competitive Snapshot
- 2.3.1 Top 10 Players by Revenue Share – 2024
- 2.3.2 Top 10 Players by Volume Share – 2024
- 2.3.3 Recent Strategic Developments (18-Month Summary)
- 2.4 Key Investment Highlights & Strategic Conclusions
Chapter 3. Industrial Tapes Market Dynamics & Industry Analysis
- 3.1 Market Overview & Context
- 3.1.1 Industrial Tapes Market Position in the Broader Automotive Value Chain
- 3.1.2 OEM vs. Replacement Market Dynamics
- 3.1.3 Market Maturity & Development Stage by Region
- 3.2 Industrial Tapes Market Drivers
- 3.3 Industrial Tapes Market Restraints & Challenges
- 3.4 Industrial Tapes Market Opportunities
- 3.5 Porter's Five Forces Analysis
- 3.5.1 Threat of New Entrants
- 3.5.2 Bargaining Power of Suppliers
- 3.5.3 Bargaining Power of Buyers
- 3.5.4 Threat of Substitutes
- 3.5.5 Competitive Rivalry – Intensity Assessment
- 3.6 Industrial Tapes Value Chain Analysis
- 3.6.1 Upstream – Raw Material/Input Suppliers
- 3.6.1.1 Raw Material/Input 1
- 3.6.1.2 Raw Material/Input 2
- 3.6.1.3 Raw Material/Input 3
- 3.6.2 Midstream – Production/Manufacturing/Service Delivery
- 3.6.2.1 Production/Process Overview
- 3.6.2.2 Key Facility Locations & Capacity by Manufacturer
- 3.6.3 Downstream – Distribution & End Consumer
- 3.6.3.1 Primary Channel – B2B/OEM
- 3.6.3.2 Secondary Channels – Dealer, Retail, Online, Direct
- 3.6.4 Value Chain Profitability Analysis
- 3.6.1 Upstream – Raw Material/Input Suppliers
- 3.7 PESTEL Analysis
- 3.7.1 Political Factors
- 3.7.2 Economic Factors
- 3.7.3 Social Factors
- 3.7.4 Technological Factors
- 3.7.5 Environmental Factors
- 3.7.6 Legal Factors
- 3.8 Industrial Tapes Supply Chain Analysis
- 3.8.1 Raw Material/Input Supply Risk Assessment
- 3.8.2 Manufacturing Concentration Risk (Geographic Exposure)
- 3.8.3 Trade Disruption Impact Analysis
- 3.9 Regulatory & Policy Landscape
Note: The regulatory and policy landscape section covers regulations based on their applicability to the market, Industrial Tapes category, geography, and scope of the study. Only regulatory frameworks with a material impact on operations, compliance, trade, sustainability, or market access are analyzed in detail.
Chapter 4. Key Investment Pockets & Opportunity Analysis
- 4.1 Industrial Tapes Market Attractiveness Analysis
- 4.1.1 By Region – Investment Attractiveness Matrix (Volume × CAGR)
- 4.2 Absolute Revenue Growth Opportunity
- 4.2.1 By Region – Absolute USD Growth Through 2032
- 4.3 Incremental Volume Opportunity
- 4.3.1 By Region – Incremental Volume Through 2032
- 4.3.2 Segment – Incremental Volume
- 4.4 Emerging Submarket Opportunity Deep Dive (Subject to Applicability)
- 4.5 Emerging Market Opportunity Scorecards
- 4.5.1 United States
- 4.5.2 Europe
- 4.5.3 Asia
- 4.5.4 Middle East & Africa
Note: Emerging Market Opportunity Scorecards will be included based on relevance and strategic importance. Regions listed are indicative and may vary depending on data availability and market dynamics.
Chapter 5. Industrial Tapes Import-Export Analysis & Trade Flows
- 5.1 Global Trade Overview
- 5.1.1 Global Export Value by Country (2024)
- 5.1.2 Global Export Volume by Country (2024)
- 5.1.3 Global Import Value by Country (2024)
- 5.1.4 Global Import Volume by Country (2024)
- 5.1.5 Net Trade Balance by Country (2024)
- 5.2 Export Analysis – Segment
- 5.2.1 Type 1 (HS Code)
- 5.2.2 Type 2 (HS Code)
- 5.2.3 Type 3 (HS Code)
- 5.2.4 Type 4 (HS Code)
- 5.2.5 Type 5 (HS Code)
- 5.3 Import Analysis – Segment
- 5.3.1 Type 1 (HS Code)
- 5.3.2 Type 2 (HS Code)
- 5.3.3 Type 3 (HS Code)
- 5.3.4 Type 4 (HS Code)
- 5.3.5 Type 5 (HS Code)
- 5.4 Average Unit Trade Prices
- 5.4.1 Average Export Price – Segment & Country
- 5.4.2 Average Import Price – Segment & Source Country
- 5.4.3 Price Trends (2024)
- 5.5 Key Trade Route Analysis
- 5.5.1 Trade Route 1
- 5.5.2 Trade Route 2
- 5.5.3 Trade Route 3
- 5.5.4 Trade Route 4
- 5.5.5 Trade Route 5
- 5.6 Trade Policy Impact Assessment
- 5.6.1 US Anti-Dumping & Section 301 Tariffs
- 5.6.2 EU Customs Union Impact
- 5.6.3 Major Free Trade Agreements
- 5.6.4 USMCA Rules of Origin
Note: Trade policy analysis will be included only where relevant to the Industrial Tapes market.
Chapter 6. Competitive Landscape & Company Benchmarking
- 6.1 Industrial Tapes Market Concentration & Structure
- 6.1.1 Herfindahl-Hirschman Index (HHI) – vs. 2024
- 6.1.2 Tier 1, Tier 2 & Tier 3 Market Structure
- 6.1.3 Global, Regional & Local Player Dynamics
- 6.2 Industrial Tapes Market Share Analysis – 2024
- 6.2.1 Global Revenue Share by Company
- 6.2.2 Global Volume Share by Company
- 6.2.3 Regional Revenue Share
- 6.2.4 Market Share Evolution ( vs. 2024)
- 6.2.5 OEM Segment Share by Company
- 6.2.6 Replacement Segment Share by Company
- 6.3 Production/Delivery Capacity & Facility Analysis
- 6.3.1 Global Installed Capacity
- 6.3.2 Capacity Utilization Rates
- 6.3.3 Production/Output Volume
- 6.3.4 Facility Locations & Capacity Map
- 6.3.5 Planned Capacity Additions
- 6.4 Industrial Tapes Competitive Benchmarking Matrix
- 6.4.1 Revenue, Volume, CAGR & Profitability Comparison
- 6.4.2 Channel Revenue Mix
- 6.4.3 Geographic Revenue Exposure
- 6.4.4 R&D Intensity
- 6.4.5 Sustainability Maturity
- 6.5 Strategic Developments in Industrial Tapes (Last 24 Months)
- 6.5.1 Mergers, Acquisitions & Divestments
- 6.5.2 New Industrial Tapes Launches
- 6.5.3 Facility Expansions
- 6.5.4 Strategic Alliances, Joint Ventures & Partnerships
- 6.5.5 Distribution Expansion & Market Entry
- 6.5.6 Sustainability & ESG Initiatives
- 6.6 Competitive Strategy Mapping
- 6.6.1 Leader, Challenger, Follower & Niche Classification
- 6.6.2 Pricing Strategy Comparison
- 6.6.3 Channel Strategy Matrix
Note: Strategic developments are included based on their materiality and the availability of reliable information.
Chapter 7. Global Industrial Tapes Market – By Distribution Channel
- 7.1 Segment Overview
- 7.1.1 Volume & Revenue Split by Channel (2024 & 2032)
- 7.1.2 Channel Mix Evolution (2024-2032)
Chapter 8. Regional Market Analysis – Global Overview
- 8.1 Global Regional Overview
- 8.1.1 Regional Volume Share
- 8.1.2 Regional Revenue Share
- 8.1.3 Regional Volume by Region
- 8.1.4 Regional Revenue by Region
- 8.1.5 Regional Forecast Through 2032
- 8.2 Cross-Regional Segment Analysis
- 8.2.1 By Distribution Channel
- 8.2.2 By Brand/Price Tier
Chapter 9. North America Industrial Tapes Market
- 9.1 United States
- 9.2 Canada
- 9.3 Mexico
Chapter 10. Europe Industrial Tapes Market
- 10.1 Germany
- 10.2 France
- 10.3 Italy
- 10.4 United Kingdom
- 10.5 Spain
- 10.6 Poland
- 10.7 Russia
- 10.8 Netherlands
- 10.9 Belgium
- 10.10 Sweden
- 10.11 Denmark
- 10.12 Norway
- 10.13 Rest of Europe
Chapter 11. Asia Pacific Industrial Tapes Market
- 11.1 China
- 11.2 India
- 11.3 Japan
- 11.4 South Korea
- 11.5 Thailand
- 11.6 Indonesia
- 11.7 Vietnam
- 11.8 Malaysia
- 11.9 Australia
- 11.10 Rest of Asia Pacific
Chapter 12. Latin America Industrial Tapes Market
- 12.1 Brazil
- 12.2 Argentina
- 12.3 Colombia
- 12.4 Chile
- 12.5 Rest of Latin America
Chapter 13. Middle East Industrial Tapes Market
- 13.1 Saudi Arabia
- 13.2 United Arab Emirates
- 13.3 Turkey
- 13.4 Israel
- 13.5 Iran
- 13.6 Rest of the Middle East
Chapter 14. Africa Industrial Tapes Market
- 14.1 South Africa
- 14.2 Egypt
- 14.3 Nigeria
- 14.4 Morocco
- 14.5 Rest of Africa
Chapter 15. Industrial Tapes Company Profiles
- 15.1 [Company 01]
- 15.1.1 Company Overview
- 15.1.2 Key Management Personnel
- 15.1.3 Products & Services Portfolio
- 15.1.4 Financial Performance
- 15.1.5 Key Market Focus & Geographic Presence
- 15.1.6 Recent Developments & Strategic Initiatives
Note: The company profile list is preliminary and may change based on research findings, market developments, data availability, and client requirements.
Chapter 16. Appendices
- Appendix A – List of Abbreviations & Acronyms
- Appendix B – Industry Classification Code Reference – Full Series
- Appendix C – Production & Capacity Data Tables
- Appendix D – End-Use & Demand Base Tables
- Appendix E – Consumption & Replacement Rate Assumptions
- Appendix F – ASP Reference Tables
- Appendix G – Manufacturing & Facility Database
- Appendix H – Import-Export Data Tables
- Appendix I – Regulatory Summary Tables
- Appendix J – Primary Research Participant List (Anonymized)
- Appendix K – Primary Research Questionnaire Framework
- Appendix L – Data Sources & Bibliography
- Appendix M – Market Size Divergence & Source Comparison
Chapter 17. Research Methodology
- 17.1 Research Framework & Philosophy
- 17.2 Secondary Research – Sources, Hierarchy & Data Extraction
- 17.3 Data Modeling – Bottom-Up & Top-Down Market Sizing
- 17.4 Primary Research – Stakeholder Framework, LOI & Sample Sizes
- 17.5 Forecast Methodology – Regression, Scenario & Sensitivity Analysis
- 17.6 Quality Control – Four-Layer Validation Framework
- 17.7 Limitations & Standard Assumptions
- 17.8 Disclaimer
