Market Overview
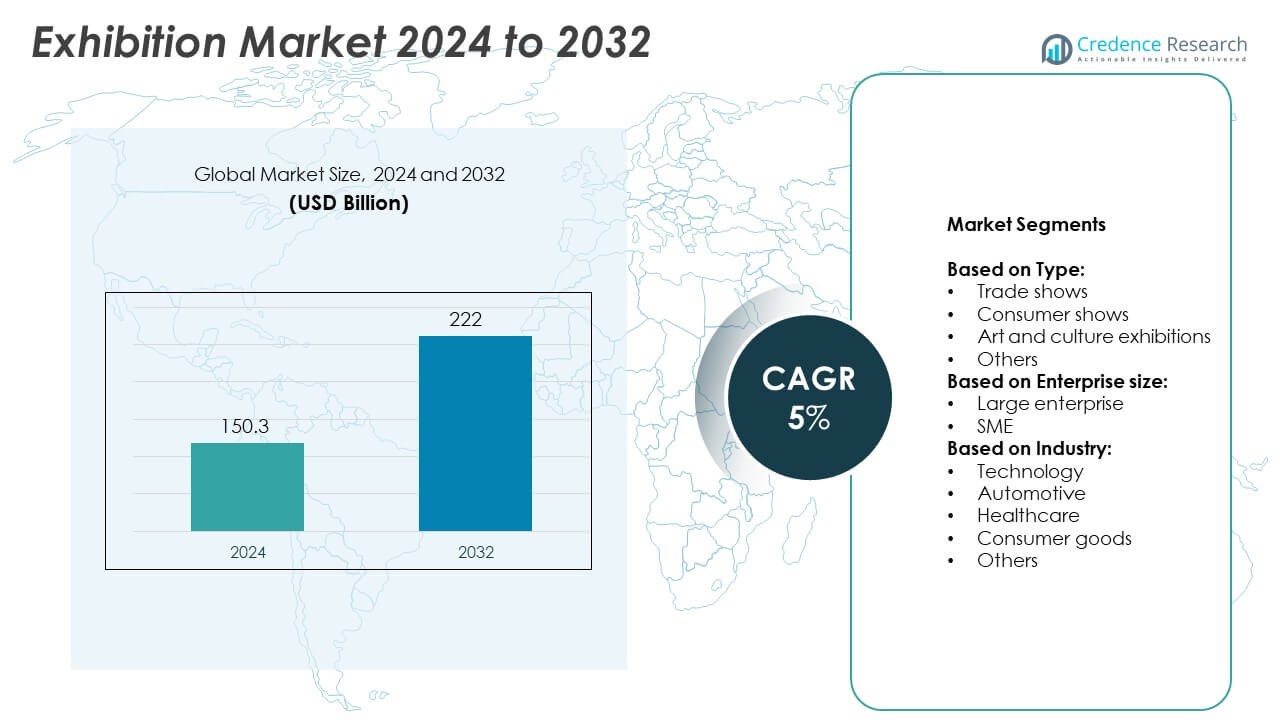
Exhibition Market size was valued at USD 150.3 billion in 2024 and is anticipated to reach USD 222 billion by 2032, at a CAGR of 5% during the forecast period.
| REPORT ATTRIBUTE |
DETAILS |
| Historical Period |
2020-2023 |
| Base Year |
2024 |
| Forecast Period |
2025-2032 |
| Exhibition Market Size 2024 |
USD 150.3 Billion |
| Exhibition Market, CAGR |
5% |
| Exhibition Market Size 2032 |
USD 222 Billion |
The Exhibition market grows through rising globalization, strong demand for trade platforms, and expanding corporate investments. Companies use exhibitions to launch products, build networks, and enhance brand visibility. Sustainability initiatives, supported by eco-friendly venues and green practices, shape long-term strategies. Digital integration with hybrid formats and advanced technologies such as AR and VR improves engagement and extends reach. It drives participation across industries, while data-driven personalization ensures tailored experiences. These drivers and trends collectively strengthen the market’s relevance and global presence.
North America leads the Exhibition market with advanced infrastructure and frequent large-scale events, while Europe maintains strong cultural and industrial exhibitions supported by sustainability initiatives. Asia Pacific grows rapidly with urbanization and government-backed investments in trade fairs. Latin America and Middle East & Africa show steady expansion through tourism-driven and industry-specific exhibitions. Key players such as Reed Exhibitions, Informa Markets, GL Events, and Messe München strengthen their positions by focusing on hybrid formats, digital integration, and global expansion strategies.
Access crucial information at unmatched prices!
Request your sample report today & start making informed decisions powered by Credence Research Inc.!
Download Sample
Market Insights
- The Exhibition market size was USD 150.3 billion in 2024 and is projected to reach USD 222 billion by 2032, growing at a CAGR of 5%.
- Globalization, rising demand for business networking, and strong focus on product showcasing drive the market forward.
- Hybrid event formats and digital technologies such as AR, VR, and data analytics shape emerging trends.
- Leading companies including Reed Exhibitions, Informa Markets, GL Events, Messe München, and Clarion Events dominate with global portfolios and sector-specific expertise.
- High operational costs, economic fluctuations, and uncertainties in attendance act as restraints for organizers and exhibitors.
- North America leads with advanced venues and strong participation, Europe follows with sustainability-focused exhibitions, Asia Pacific records rapid growth with urbanization, while Latin America and Middle East & Africa expand steadily through cultural and industry-driven events.
- The Exhibition market adapts to shifting consumer expectations, balancing physical engagement with digital platforms to ensure long-term growth, stronger ROI for exhibitors, and value-driven experiences for attendees across industries.
Market Drivers
Growing Role of Global Trade and Networking Opportunities
Global trade expansion drives the demand for exhibitions, offering platforms for business exchange and partnerships. Companies across industries use exhibitions to showcase innovations and reach new markets. Exhibitions act as catalysts for brand visibility, supporting international collaboration. It creates opportunities for firms to interact directly with buyers, suppliers, and distributors. The demand for face-to-face networking remains strong despite digitalization. Exhibitions also provide measurable results in terms of sales leads and customer engagement. The Exhibition market benefits from its ability to foster trust and long-term business relationships.
- For instance, the India International Jewellery Show (IIJS) Premiere in 2024 featured more than 2,100 exhibitors across over 3,600 booths, drawing 50,000 trade visitors from 800+ Indian cities
Advancing Demand for Product Showcasing and Launch Platforms
Exhibitions serve as primary venues for product launches, offering firms a stage to demonstrate innovation. Attendees experience products firsthand, which strengthens purchasing decisions. Companies in sectors like automotive, electronics, and fashion rely on exhibitions to attract attention during launches. It boosts competition and accelerates adoption of emerging solutions. Exhibitions enhance consumer awareness by providing immersive experiences and detailed product insights. Exhibitors also use live demonstrations to highlight product features and usability. The Exhibition market grows as firms prioritize impactful launch events to differentiate their offerings.
- For instance, SEMICON Taiwan in 2024 hosted over 1,100 exhibitors, spanned 3,600 booths, and attracted 85,000 visitors.
Rising Influence of Urbanization and Infrastructure Development
Urbanization supports the development of modern exhibition centers and venues. Governments invest in large-scale facilities to attract global events and tourism. It stimulates local economies by creating opportunities for hotels, airlines, and services. Cities hosting exhibitions gain recognition as international business hubs. Exhibition organizers capitalize on advanced infrastructure, which allows larger gatherings and diverse event formats. Growing visitor convenience increases event participation and repeat attendance. The Exhibition market strengthens with the expansion of urban economies and improved accessibility.
Technological Integration and Digital Support Systems
Exhibitions evolve through the integration of digital technologies, enhancing visitor experiences and operational efficiency. Virtual tools, apps, and data analytics support attendee engagement before, during, and after events. It improves lead generation, matchmaking, and targeted marketing. Exhibitors use augmented reality, interactive screens, and IoT solutions to create engaging displays. Hybrid event models extend reach by connecting physical and virtual audiences. Technology adoption also ensures smoother operations and better return on investment. The Exhibition market adapts to the digital shift, ensuring sustained relevance and growth.
Market Trends
Adoption of Hybrid Event Models and Virtual Extensions
Hybrid formats are transforming exhibitions by combining physical and digital platforms. Organizers integrate live streaming, virtual booths, and online networking tools to extend audience reach. It allows exhibitors to engage participants who cannot attend in person. Hybrid models also improve accessibility, enabling global participation and data-driven insights. Exhibitors benefit from higher engagement levels and longer event lifecycles. The Exhibition market strengthens with the integration of virtual platforms that complement traditional setups.
- For instance, the virtual component of Cisco Live, then called “Networkers Virtual,” drew over 4,000 virtual attendees, while the live event had over 12,000 registered participants.
Emphasis on Sustainability and Green Practices
Sustainability has emerged as a defining trend in exhibitions, driven by global climate goals. Organizers adopt eco-friendly materials, energy-efficient lighting, and waste reduction programs. It reduces environmental impact while aligning events with corporate responsibility values. Exhibitors increasingly demand venues with green certifications and carbon-neutral strategies. Sustainable practices also appeal to environmentally conscious attendees. The Exhibition market evolves as stakeholders prioritize responsible operations and long-term environmental commitments.
- For instance, the i Light Marina Bay festival in 2012 featured 31 sustainable light installations, achieved energy savings of over 200,000 kWh through coordinated “Switch Off, Turn Up” efforts.
Personalization and Data-Driven Attendee Experiences
Exhibitions are shifting toward personalized experiences through advanced analytics and AI solutions. Organizers use data to predict attendee interests and tailor event schedules. It improves visitor satisfaction and encourages repeat participation. Exhibitors implement targeted campaigns based on visitor profiles and preferences. Personalization enhances networking by matching attendees with relevant business contacts. The Exhibition market expands with rising focus on delivering customized, value-driven experiences for both visitors and exhibitors.
Technological Innovation and Immersive Experiences
Emerging technologies are redefining how exhibitions attract and retain participants. Augmented reality, virtual reality, and interactive displays create immersive engagement opportunities. It enhances product demonstrations and captures audience attention more effectively. IoT integration supports smart navigation, visitor tracking, and seamless event management. Exhibitors deploy digital touchpoints to maximize brand exposure and recall. The Exhibition market adapts to innovation by embedding cutting-edge technologies that transform engagement strategies.
Market Challenges Analysis
High Operational Costs and Resource Constraints
Exhibitions demand significant investments in venue rentals, logistics, and infrastructure. Rising costs for transportation, manpower, and equipment limit participation for smaller companies. It creates barriers for startups and regional firms competing against global players. Organizers face pressure to balance costs while ensuring high-quality experiences. Economic uncertainties also impact budgets for both exhibitors and attendees. Cost constraints often restrict innovation in event formats and technologies. The Exhibition market continues to face challenges in maintaining affordability and inclusivity.
Uncertainty in Attendance and External Disruptions
Exhibition success depends heavily on consistent visitor turnout, which remains vulnerable to external factors. Travel restrictions, health crises, or geopolitical instability reduce international participation. It impacts exhibitor returns and weakens sponsorship interest. Fluctuating attendance also makes it difficult to forecast revenue and plan resource allocation. Organizers must invest in risk management strategies to address unpredictable disruptions. Limited flexibility in adapting to sudden changes increases vulnerability for large-scale events. The Exhibition market encounters long-term challenges in sustaining stable attendance and resilience.
Market Opportunities
Expansion in Emerging Markets and New Industry Verticals
Emerging economies offer strong growth potential for exhibitions due to industrial expansion and urban development. Countries in Asia, Latin America, and the Middle East are investing in modern exhibition centers. It opens opportunities for global organizers to host events across diverse sectors such as technology, healthcare, and renewable energy. Rising middle-class populations increase demand for consumer-focused exhibitions, creating new revenue streams. Governments also support exhibitions to promote trade and attract foreign investment. Expanding into new verticals enhances the reach and relevance of the Exhibition market across regions.
Integration of Advanced Technology and Enhanced Engagement Models
Technology adoption offers opportunities to deliver more engaging and efficient exhibition experiences. Digital platforms extend event visibility, allowing year-round interactions between exhibitors and attendees. It enables continuous networking beyond physical event days. Artificial intelligence, augmented reality, and data analytics improve personalization and create immersive showcases. Exhibitors gain opportunities to generate measurable results through predictive insights and targeted engagement. The Exhibition market benefits from technological innovation that strengthens exhibitor ROI and visitor satisfaction.
Market Segmentation Analysis:
By Type:
Trade shows form the largest segment, driven by strong demand from B2B industries seeking global exposure. Companies use these platforms to launch products, sign partnerships, and explore new markets. Consumer shows also hold significant share, attracting end-users in retail, lifestyle, and entertainment sectors. It creates opportunities for brands to enhance visibility and drive direct sales. Art and culture exhibitions remain vital for showcasing creative works and attracting tourism, supported by galleries and cultural institutions. Other formats, including niche and specialized exhibitions, continue to grow, addressing industry-specific needs with targeted audiences. The Exhibition market strengthens by diversifying formats that serve both commercial and cultural goals.
- For instance, CES 2025 hosted over 4,500 exhibitors, with 141,000 attendees from more than 150 countries
By Enterprise Size:
Large enterprises dominate exhibitions with substantial budgets, global reach, and frequent participation. These firms rely on exhibitions to maintain brand presence and connect with buyers across regions. It supports continuous innovation and competitive positioning. SMEs also play a crucial role, leveraging exhibitions to enter new markets and build networks. Their participation brings diversity and innovation to exhibition platforms. Limited resources push SMEs toward selective participation, but support from governments and trade bodies boosts their presence. Both segments ensure exhibitions maintain balanced representation across scales of enterprise.
- For instance, at CES 2025, Eureka Park housed 1,400 startup exhibitors, giving SMEs impactful visibility alongside global brands
By Industry:
Technology exhibitions remain at the forefront, driven by digital transformation, innovation, and demand for global exposure. Automotive exhibitions showcase next-generation vehicles, mobility solutions, and sustainability-focused innovations. It provides automakers with a platform to engage with consumers and industry partners. Healthcare exhibitions grow rapidly, focusing on medical devices, pharmaceuticals, and digital health solutions. Consumer goods exhibitions continue to thrive, featuring lifestyle, fashion, and electronics that draw large audiences. Other industries, including energy, education, and tourism, use exhibitions to connect with international buyers and drive sector-specific growth. The Exhibition market broadens its scope by serving multiple industries with tailored formats.
Segments:
Based on Type:
- Trade shows
- Consumer shows
- Art and culture exhibitions
- Others
Based on Enterprise Size:
Based on Industry:
- Technology
- Automotive
- Healthcare
- Consumer goods
- Others
Based on the Geography:
- North America
- Europe
- UK
- France
- Germany
- Italy
- Spain
- Russia
- Belgium
- Netherlands
- Austria
- Sweden
- Poland
- Denmark
- Switzerland
- Rest of Europe
- Asia Pacific
- China
- Japan
- South Korea
- India
- Australia
- Thailand
- Indonesia
- Vietnam
- Malaysia
- Philippines
- Taiwan
- Rest of Asia Pacific
- Latin America
- Brazil
- Argentina
- Peru
- Chile
- Colombia
- Rest of Latin America
- Middle East
- UAE
- KSA
- Israel
- Turkey
- Iran
- Rest of Middle East
- Africa
- Egypt
- Nigeria
- Algeria
- Morocco
- Rest of Africa
Regional Analysis
North America
North America holds a market share of 36%, supported by its advanced infrastructure and strong corporate participation. The United States leads the region, with major cities such as Las Vegas, Chicago, and Orlando serving as global exhibition hubs. It benefits from well-established convention centers and frequent large-scale events across technology, healthcare, and automotive sectors. Canada also contributes with exhibitions that support industrial growth, innovation, and cross-border trade. High investment in digital integration and hybrid formats further strengthens exhibitor and visitor engagement. The region’s ability to attract global participants maintains its dominance, while the Exhibition market here thrives on strong government and private sector collaboration.
Europe
Europe accounts for 28% of the market, driven by its cultural diversity and strong emphasis on sustainability. Germany, France, and the United Kingdom lead with world-class venues and globally recognized exhibitions. It benefits from strong demand in technology, art, fashion, and consumer goods sectors. European organizers adopt eco-friendly practices such as energy-efficient venues and reduced carbon footprints, aligning with regional policies. Cross-border mobility within the EU increases attendance from neighboring countries, strengthening participation. The Exhibition market in Europe thrives on a mix of traditional formats and growing adoption of hybrid events that combine physical and digital platforms.
Asia Pacific
Asia Pacific captures 24% of the market, recording rapid growth due to urbanization and rising disposable incomes. China, Japan, and India lead in hosting large-scale exhibitions across technology, consumer goods, and automotive industries. It benefits from government-backed initiatives to promote trade and regional investment. The region also witnesses growing demand for exhibitions in healthcare and education. Rising middle-class participation boosts consumer-focused shows, while corporate demand drives trade exhibitions. Asia Pacific continues to emerge as a major hub, with new facilities and increasing foreign exhibitor interest reinforcing the Exhibition market in this region.
Latin America
Latin America holds a market share of 7%, supported by expanding urban economies and cultural events. Brazil and Mexico lead the region with exhibitions focusing on consumer goods, fashion, and industrial growth. It faces challenges from economic volatility, but strong domestic participation sustains growth. Government-backed trade fairs encourage collaboration across industries, attracting international exhibitors. Rising interest in creative industries and tourism-driven exhibitions adds to regional diversity. The Exhibition market in Latin America benefits from strong community participation and gradual infrastructure improvements that enable larger-scale events.
Middle East & Africa
Middle East & Africa accounts for 5% of the market, driven by rising investment in infrastructure and tourism. The UAE and Saudi Arabia lead with global exhibitions that highlight technology, energy, and cultural sectors. It leverages strategic geographic location to attract participants from Europe, Asia, and Africa. Africa contributes through emerging exhibitions in South Africa and Nigeria, focusing on mining, agriculture, and healthcare. Limited infrastructure in some parts of the region poses challenges, but rising investment continues to expand opportunities. The Exhibition market in Middle East & Africa gains momentum as new projects and government-backed initiatives create international appeal.
Shape Your Report to Specific Countries or Regions & Enjoy 30% Off!
Key Player Analysis
Competitive Analysis
The Exhibition market features strong competition among leading players such as Reed Exhibitions, Informa Markets, GL Events, Ascential plc, MCH Group, Emerald Expositions, Messe München, Clarion Events, Fiera Milano SpA, and NürnbergMesse. These companies dominate the global landscape by leveraging established portfolios, extensive networks, and advanced event management capabilities. Their strategies focus on expanding geographical reach, introducing hybrid event models, and diversifying sector-specific exhibitions. Strong presence in industries such as technology, healthcare, automotive, and consumer goods enhances their ability to attract global participants. Market leaders continue to invest in digital integration to improve visitor engagement and provide data-driven insights for exhibitors. They emphasize sustainability by adopting eco-friendly practices and aligning events with international environmental standards. Large-scale venues, established partnerships, and government collaborations support their ability to deliver world-class exhibitions. Innovation in exhibition formats, increased use of AR and VR, and the adoption of smart technologies strengthen competitive differentiation. Companies also focus on expanding into emerging markets where urbanization and industrial growth create strong demand for exhibitions. By maintaining operational excellence and adapting to evolving customer needs, these players reinforce their leadership and sustain growth in the global Exhibition market.
Recent Developments
- In March 2025, Informa unveiled new features for Vitafoods Europe 2025 in Barcelona, including a new theatre and enhanced networking options
- In 2025, Emerald acquired the Plant Based World Expo, signaling expansion into the plant‑based sector
- In February 2024, Ascential completed the sale of its WGSN business, marking a strategic shift in focus
Report Coverage
The research report offers an in-depth analysis based on Type, Enterprise Size, Industry and Geography. It details leading market players, providing an overview of their business, product offerings, investments, revenue streams, and key applications. Additionally, the report includes insights into the competitive environment, SWOT analysis, current market trends, as well as the primary drivers and constraints. Furthermore, it discusses various factors that have driven market expansion in recent years. The report also explores market dynamics, regulatory scenarios, and technological advancements that are shaping the industry. It assesses the impact of external factors and global economic changes on market growth. Lastly, it provides strategic recommendations for new entrants and established companies to navigate the complexities of the market.
Future Outlook
- Hybrid exhibitions will expand further with stronger integration of digital platforms.
- Sustainability practices will become central to venue design and event management.
- Technology adoption such as AR and VR will enhance visitor engagement.
- Data-driven personalization will guide exhibitor strategies and visitor experiences.
- Emerging markets will host more international exhibitions with modern infrastructure.
- Industry-specific exhibitions will rise, targeting niche professional audiences.
- Governments will increase support to promote exhibitions as trade growth drivers.
- Large enterprises will continue to dominate while SMEs gain more participation support.
- Cultural and art exhibitions will grow alongside consumer-focused events.
- The Exhibition market will adapt faster to disruptions with flexible event models.


