
Market overview
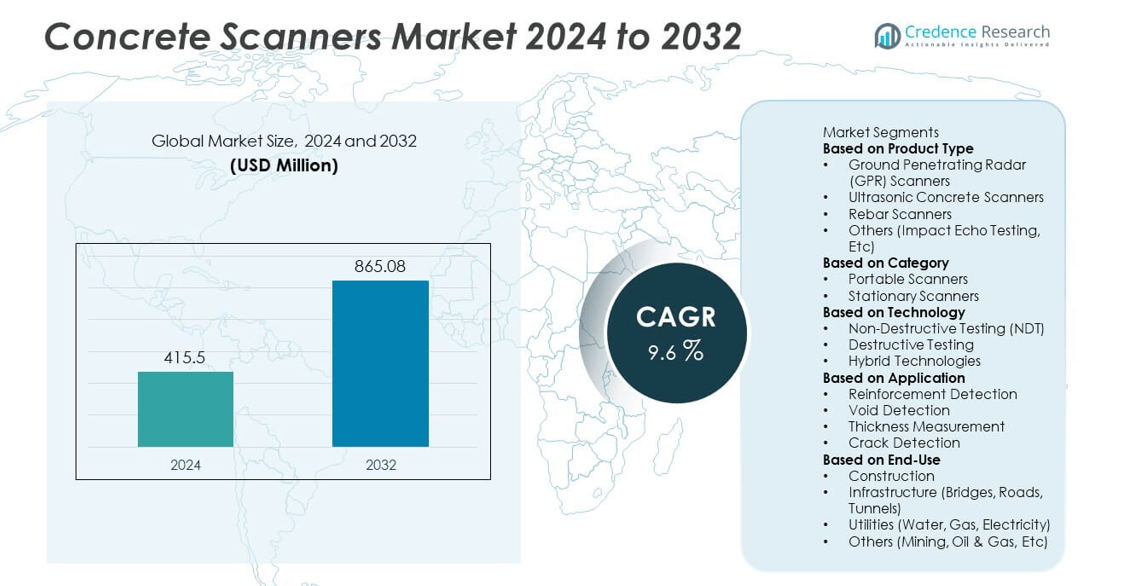
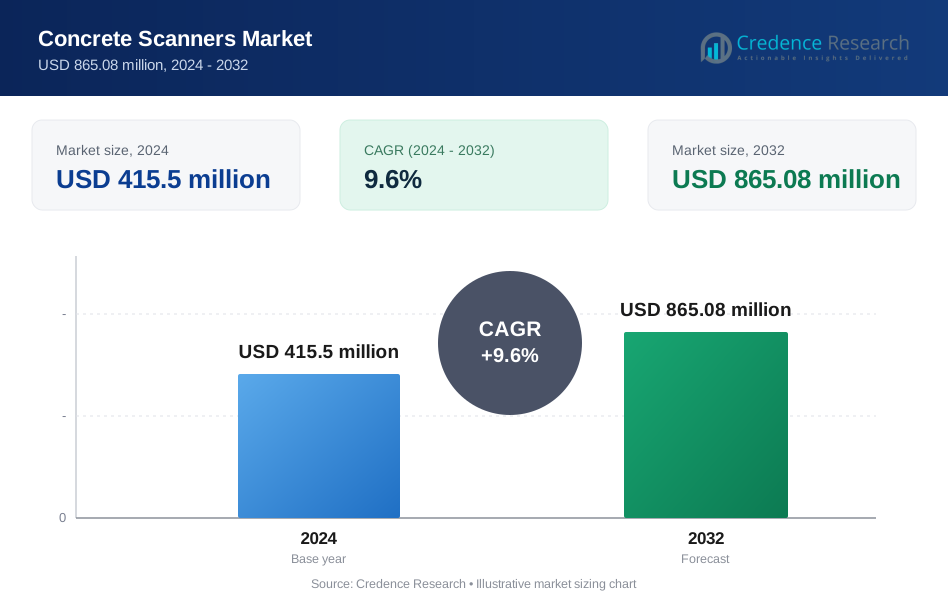
The Concrete Scanners market was valued at USD 415.5 million in 2024 and is expected to reach USD 865.08 million by 2032, growing at a CAGR of 9.6% during the forecast period.
| REPORT ATTRIBUTE | DETAILS |
|---|---|
| Historical Period | 2020-2023 |
| Base Year | 2024 |
| Forecast Period | 2025-2032 |
| Concrete Scanners Market Size 2024 | USD 415.5 million |
| Concrete Scanners Market, CAGR | 9.6% |
| Concrete Scanners Market Size 2032 | USD 865.08 million |
The concrete scanners market is driven by major players including Leica Geosystems (Part of Hexagon), Bosch Professional, GSSI (Geophysical Survey Systems, Inc.), Hilti Corporation, Mala Geoscience, Nikon Metrology, GeoModel, Inc., C-Thru GPR, Magnetics, and Geosense. These companies focus on non-destructive testing innovations, advanced imaging systems, and AI-integrated analysis to enhance detection accuracy. North America led the market in 2024 with a 34% share, supported by high infrastructure renovation and strict safety standards. Asia-Pacific followed with a 29% share, driven by rapid construction growth and modernization projects, while Europe held a 27% share backed by regulatory compliance and strong adoption of digital inspection technologies.
Market Insights
- The concrete scanners market was valued at USD 415.5 million in 2024 and is projected to reach USD 865.08 million by 2032, growing at a CAGR of 9.6% during the forecast period.
- Growing focus on structural safety, non-destructive testing adoption, and infrastructure modernization are driving market expansion across commercial, industrial, and public construction sectors.
- Advancements in GPR and hybrid scanning technologies, integration of AI-based analysis, and rising demand for portable, wireless scanners are key trends shaping market growth.
- Leading companies such as Leica Geosystems, Bosch Professional, and Hilti Corporation focus on innovation, digital visualization, and regional expansion to strengthen competitiveness.
- North America holds 34%, Asia-Pacific 29%, and Europe 27% market share, while the GPR scanner segment dominates with 42%, supported by high demand for accurate and non-invasive subsurface detection across infrastructure inspection and renovation projects.
Market Segmentation Analysis:
By Product Type
Ground Penetrating Radar (GPR) scanners dominated the concrete scanners market in 2024 with a 42% share. Their ability to provide accurate, non-invasive subsurface imaging makes them ideal for detecting rebar, voids, and post-tension cables. GPR scanners are widely used in construction and infrastructure renovation due to their superior depth penetration and real-time imaging capabilities. Growing demand for safety compliance and structural assessment in both new and existing concrete structures drives the adoption of GPR technology. Ultrasonic and rebar scanners follow, supported by increasing application in quality assurance and maintenance inspections.
- For instance, GSSI (Geophysical Survey Systems, Inc.) developed the StructureScan Mini XT, a handheld GPR unit equipped with a 2.7 GHz antenna capable of scanning depths up to 20 inches. The system features a 6.5-inch touchscreen and delivers real-time 3D imaging, enabling engineers to accurately map rebar, conduits, and voids within reinforced concrete structures.
By Category
Portable scanners held the largest share of 63% in 2024, driven by their mobility, compact design, and ease of use in on-site inspections. These devices allow quick data acquisition and scanning across varied surfaces, supporting field-based concrete evaluation without heavy equipment. Contractors and engineers prefer portable models for bridge decks, walls, and floor analysis where accessibility is limited. The rising trend toward compact, battery-operated systems with wireless data transfer capabilities continues to boost this segment. Stationary scanners, though less prevalent, are used in laboratory-based or large-scale industrial evaluations.
- For instance, Hilti Corporation offers the PS 85 Wall Scanner for detecting embedded objects up to 85 mm deep, featuring an onboard display for immediate analysis and the ability to export scan data via SD card.
By Technology and Application
Non-Destructive Testing (NDT) technologies led the market with a 71% share in 2024, as they enable structural assessment without damaging the material. Their effectiveness in evaluating reinforcement layout, cracks, and thickness supports strong demand in construction quality assurance. Within applications, reinforcement detection accounted for 39% of the total share, driven by the growing need to locate embedded structures before drilling or coring operations. The integration of hybrid technologies combining GPR and ultrasonic methods enhances detection accuracy, meeting rising infrastructure safety standards and reducing costly project delays.
Key Growth Drivers
Increasing Focus on Structural Safety and Compliance
Rising concern over structural integrity and safety standards is a major driver of the concrete scanners market. Governments and contractors increasingly rely on scanning technologies to ensure compliance with building codes and prevent costly structural failures. These systems help detect rebar, voids, and cracks before renovation or drilling, reducing risks of accidents. Growing demand for preventive maintenance and restoration in aging infrastructure further fuels adoption, particularly across bridges, tunnels, and high-rise structures where safety verification is critical.
- For instance, Leica Geosystems introduced the C-Thrue concrete scanner, equipped with dual-polarization antennas capable of detecting embedded objects at depths up to 31.5 inches. The device provides high-resolution 3D visualization for mapping rebar, tendons, and voids, enabling engineers to comply with EN 1992 structural inspection standards in complex reinforced concrete environments.
Expanding Infrastructure Development Worldwide
Rapid urbanization and expanding infrastructure investments are accelerating the demand for concrete scanning solutions. Nations in Asia-Pacific, the Middle East, and North America are investing heavily in roads, bridges, and commercial buildings. Concrete scanners play a vital role in ensuring precision during construction and renovation, minimizing damage to embedded components. Their integration in infrastructure development supports project accuracy, safety, and longevity. As infrastructure budgets grow globally, adoption of advanced scanning technologies continues to rise across public and private sectors.
- For instance, GSSI launched its StructureScan Pro Series featuring a 1600 MHz antenna that delivers penetration depths up to 18 inches with centimeter-scale accuracy. The system supports real-time mapping of reinforcement grids in bridge decks and tunnel linings, helping contractors verify concrete thickness and subsurface integrity during major infrastructure construction projects.
Technological Advancements in Scanning Equipment
Innovations in imaging technology, data processing, and wireless connectivity are driving market growth. Modern scanners now feature AI-based data interpretation, 3D visualization, and enhanced signal penetration, improving inspection accuracy. Lightweight, battery-powered models with Bluetooth-enabled data sharing support on-site mobility. These advancements enable faster detection and reduce downtime in construction and maintenance operations. The development of hybrid scanners that combine GPR and ultrasonic techniques further enhances resolution and reliability, making them ideal for complex structural analysis and large-scale infrastructure projects.
Key Trends and Opportunities
Integration of AI and 3D Mapping
Artificial intelligence and 3D visualization are transforming how concrete structures are analyzed. AI algorithms enable automatic interpretation of scanned data, reducing human error and speeding up assessments. 3D mapping provides detailed subsurface models, aiding engineers in precise decision-making during repair or retrofitting. These technologies improve efficiency and documentation in large construction projects. Companies investing in AI-driven solutions are gaining a competitive advantage, as automation and digital modeling become essential for modern infrastructure management and predictive maintenance applications.
- For instance, Hexagon’s Leica Geosystems integrated AI-based image reconstruction into its C-Thrue concrete scanner, enabling real-time 3D subsurface modeling with millimeter-level accuracy.
Growing Adoption in Renovation and Retrofitting Projects
The rise in renovation and retrofitting of old infrastructure presents a strong opportunity for market expansion. Concrete scanners are increasingly used to assess reinforcement layouts and detect defects before upgrades or drilling. Governments worldwide are prioritizing the maintenance of bridges, tunnels, and heritage structures to extend their lifespan. This surge in restoration activities, especially in mature economies like North America and Europe, boosts demand for non-destructive scanning technologies. The trend aligns with sustainability goals by reducing waste and minimizing structural damage during renovation.
- For instance, Mala Geoscience introduced the CX12 concrete imaging radar, featuring a 1.2 GHz antenna and depth capability up to 19 inches for detecting rebar and post-tension cables. The system provides automatic layer separation and 3D visualization of reinforcement grids, allowing engineers to assess deterioration and reinforcement placement accurately during restoration and retrofitting of concrete bridges and tunnels.
Key Challenges
High Equipment and Operational Costs
The high cost of advanced concrete scanning systems remains a key challenge, particularly for small and medium contractors. GPR and hybrid scanners require significant investment in hardware and training, limiting accessibility in cost-sensitive markets. Maintenance and calibration expenses add further financial strain. Additionally, frequent technological upgrades increase replacement costs for users. This pricing pressure restricts adoption across developing economies, where construction budgets are often limited, slowing market penetration despite growing awareness of scanning benefits.
Technical Limitations and Data Interpretation Complexity
Accurate interpretation of scan data remains challenging, especially in dense or high-moisture concrete environments. GPR signals can be distorted by steel density, rebar interference, or surface conditions, leading to ambiguous results. Skilled operators are essential to ensure precise data analysis, yet trained professionals are limited in several regions. Misinterpretation can cause errors in decision-making during construction or repair. Overcoming these technical limitations through improved signal processing and standardized training is essential for maximizing the effectiveness of concrete scanning systems.
Regional Analysis
North America
North America led the concrete scanners market in 2024 with a 34% share, driven by advanced construction practices and strong adoption of non-destructive testing technologies. The United States dominates regional demand due to its extensive use of GPR scanners in infrastructure inspection, renovation, and safety compliance. Ongoing investments in bridge rehabilitation and commercial projects strengthen market growth. Canada also contributes significantly, supported by government-backed infrastructure renewal programs. The region’s high awareness of structural safety standards and early adoption of AI-driven scanning tools continue to enhance its position as a leading market for concrete scanners.
Europe
Europe accounted for a 27% share of the global concrete scanners market in 2024, fueled by strict building regulations and sustainability-driven construction practices. Countries such as Germany, the United Kingdom, and France are key contributors, focusing on modernizing existing infrastructure and ensuring compliance with safety norms. The region’s emphasis on precision-based renovation and digital site monitoring drives the adoption of advanced scanning systems. Growing use of non-destructive testing in historical structure restoration also supports market expansion. Continuous technological innovation and training programs across the EU further reinforce Europe’s strong market position.
Asia-Pacific
Asia-Pacific held a 29% share in 2024 and is expected to experience the fastest growth during the forecast period. Rising urbanization, expanding infrastructure development, and increased public investment in smart cities are driving demand for concrete scanning technologies. China, India, Japan, and South Korea are key contributors, emphasizing quality assurance in large-scale construction projects. Rapid adoption of portable and hybrid scanners supports on-site efficiency. Governments across the region are strengthening construction safety standards, fueling demand for non-destructive inspection tools. The region’s expanding construction sector and focus on modernization make it a major growth hub.
Latin America
Latin America captured a 6% share of the concrete scanners market in 2024, supported by rising infrastructure modernization and commercial construction activities. Brazil and Mexico lead regional growth, driven by government efforts to improve urban infrastructure and transport networks. Increased awareness of structural inspection benefits is encouraging the use of portable GPR scanners in construction projects. However, limited technical expertise and high equipment costs continue to challenge broader adoption. Market participants are focusing on affordable and easy-to-operate solutions to tap into the growing renovation and public works opportunities across the region.
Middle East & Africa
The Middle East & Africa region accounted for a 4% share in 2024, with growth driven by expanding infrastructure investments and smart city initiatives. Countries such as the UAE, Saudi Arabia, and South Africa are adopting advanced scanning solutions to enhance construction precision and safety. Ongoing mega-projects like NEOM and Dubai’s infrastructure upgrades are key demand drivers. Increased adoption of non-destructive testing in oil, gas, and commercial construction sectors also supports market growth. Despite challenges related to cost and skill shortages, the region shows strong potential for technology adoption and modernization.
Market Segmentations:
By Product Type
- Ground Penetrating Radar (GPR) Scanners
- Ultrasonic Concrete Scanners
- Rebar Scanners
- Others (Impact Echo Testing, Etc)
By Category
- Portable Scanners
- Stationary Scanners
By Technology
- Non-Destructive Testing (NDT)
- Destructive Testing
- Hybrid Technologies
By Application
- Reinforcement Detection
- Void Detection
- Thickness Measurement
- Crack Detection
By End-Use
- Construction
- Infrastructure (Bridges, Roads, Tunnels)
- Utilities (Water, Gas, Electricity)
- Others (Mining, Oil & Gas, Etc)
By Geography
- North America
- U.S.
- Canada
- Mexico
- Europe
- Germany
- France
- U.K.
- Italy
- Spain
- Rest of Europe
- Asia Pacific
- China
- Japan
- India
- South Korea
- South-east Asia
- Rest of Asia Pacific
- Latin America
- Brazil
- Argentina
- Rest of Latin America
- Middle East & Africa
- GCC Countries
- South Africa
- Rest of the Middle East and Africa
Competitive Landscape
The competitive landscape of the concrete scanners market features leading players such as Leica Geosystems (Part of Hexagon), Bosch Professional, GSSI (Geophysical Survey Systems, Inc.), GeoModel, Inc., Magnetics, Hilti Corporation, Mala Geoscience, C-Thru GPR, Nikon Metrology, and Geosense. These companies focus on innovation, advanced imaging technologies, and digital data integration to enhance scanning accuracy and field performance. Market leaders are investing in hybrid GPR systems, AI-based data analytics, and wireless connectivity to improve non-destructive inspection capabilities. Strategic collaborations, product launches, and geographic expansion remain core growth strategies. Manufacturers also emphasize developing portable, lightweight scanners with enhanced depth penetration to meet the needs of construction and infrastructure inspection. Continuous advancements in 3D visualization and integration with digital construction workflows strengthen competitive positioning, while increasing demand for precision and safety compliance continues to drive market competition globally.
Key Player Analysis
- Leica Geosystems (Part of Hexagon)
- Bosch Professional
- GSSI (Geophysical Survey Systems, Inc.)
- GeoModel, Inc.
- Magnetics
- Hilti Corporation
- Mala Geoscience
- C-Thru GPR
- Nikon Metrology
- Geosense
Recent Developments
- In January 2024, IDS GeoRadar, a leader in Ground Penetrating Radar (GPR) and Interferometric Radar solutions, launched the C-thrue XS, a compact, handheld GPR scanner specifically designed for easy, high-precision concrete inspection. Featuring dual-polarization technology, the C-thrue XS enables operators to capture detailed subsurface images with enhanced clarity, simplifying complex inspection processes for both new construction and retrofitting projects.
- In 2024, GSSI (Geophysical Survey Systems, Inc.) announced its Flex LT handheld concrete scanning system under its Nexus platform as a more compact, fast scanning tool for contractors.
- In 2024, GSSI continued pushing the Flex NX system which supports pairing with wireless NX antennas for flexible scanning coverage over large areas
Report Coverage
The research report offers an in-depth analysis based on Product Type, Category, Technology, Application, End-Use and Geography. It details leading market players, providing an overview of their business, product offerings, investments, revenue streams, and key applications. Additionally, the report includes insights into the competitive environment, SWOT analysis, current market trends, as well as the primary drivers and constraints. Furthermore, it discusses various factors that have driven market expansion in recent years. The report also explores market dynamics, regulatory scenarios, and technological advancements that are shaping the industry. It assesses the impact of external factors and global economic changes on market growth. Lastly, it provides strategic recommendations for new entrants and established companies to navigate the complexities of the market.
Future Outlook
- Growing adoption of non-destructive testing will continue to drive market expansion across infrastructure projects.
- Integration of AI and machine learning will enhance scan accuracy and automate data interpretation.
- Demand for portable and wireless scanners will increase due to on-site mobility needs.
- Advancements in hybrid GPR and ultrasonic technologies will improve subsurface imaging precision.
- Expansion in renovation and retrofitting projects will boost scanner utilization in aging structures.
- Rising investments in smart city infrastructure will create new opportunities for scanning applications.
- Cloud-based data storage and real-time reporting will improve workflow efficiency for contractors.
- Increasing regulatory emphasis on safety compliance will support scanner deployment in public works.
- Collaboration between equipment makers and construction firms will drive technology standardization.
- Growth in Asia-Pacific construction activity will make the region a major contributor to future demand.
Request a Free Sample
Fill in your details and we'll send you a free sample report.
- Sample data tables & charts
- Research methodology
Need a Custom Version of This Report?
Tailor the scope, geography, or segments to your exact requirements.
- Custom geography or segment scope
- Direct access to our analyst team
Frequently Asked Questions
What is the current market size for the Concrete Scanners market, and what is its projected size in 2032?
At what Compound Annual Growth Rate is the Concrete Scanners market projected to grow between 2025 and 2032?
Which Concrete Scanners market segment held the largest share in 2024?
What are the primary factors fueling the growth of the Concrete Scanners market?
Who are the leading companies in the Concrete Scanners market?
Table of Content
Chapter 1. Report Introduction
- 1.1 Report Description & Purpose
- 1.1.1 Report Title & Market Definition
- 1.1.2 Unique Selling Propositions (USP) & Key Differentiators
- 1.1.3 Value Proposition for Stakeholders
- 1.2 Research Objectives
- 1.2.1 Market Sizing Objectives (Volume & Revenue)
- 1.2.2 Segmentation Objectives
- 1.2.3 Competitive Intelligence Objectives
- 1.2.4 Forecast & Scenario Objectives
- 1.3 Report Scope
- 1.3.1 Concrete Scanners Scope – Types & Subtypes Covered
- 1.3.2 Geographic Scope – Regions & Countries Covered
- 1.3.3 Historical Period, Base Year & Forecast Period (2024; forecast to 2032)
- 1.3.4 Inclusions & Exclusions
- 1.4 HS Code & Classification Framework
- 1.5 Currency, Units & Pricing Basis
- 1.6 Target Stakeholders
- 1.7 Limitations & Assumptions
Chapter 2. Executive Summary
- 2.1 Global Concrete Scanners Market Snapshot
- 2.1.1 Market Size – Historical (2024) & Forecast (2024-2032) (2024: USD 415.5 million → 2032: USD 865.08 million)
- 2.1.2 Volume & Revenue – Global Totals
- 2.1.3 Key Market Highlights – Top Five Facts
- 2.2 Concrete Scanners Market Segmentation Snapshot
- 2.2.1 Market Split by Region – 2024 vs. 2032
- 2.3 Competitive Snapshot
- 2.3.1 Top 10 Players by Revenue Share – 2024
- 2.3.2 Top 10 Players by Volume Share – 2024
- 2.3.3 Recent Strategic Developments (18-Month Summary)
- 2.4 Key Investment Highlights & Strategic Conclusions
Chapter 3. Concrete Scanners Market Dynamics & Industry Analysis
- 3.1 Market Overview & Context
- 3.1.1 Concrete Scanners Market Position in the Broader Automotive Value Chain
- 3.1.2 OEM vs. Replacement Market Dynamics
- 3.1.3 Market Maturity & Development Stage by Region
- 3.2 Concrete Scanners Market Drivers
- 3.3 Concrete Scanners Market Restraints & Challenges
- 3.4 Concrete Scanners Market Opportunities
- 3.5 Porter's Five Forces Analysis
- 3.5.1 Threat of New Entrants
- 3.5.2 Bargaining Power of Suppliers
- 3.5.3 Bargaining Power of Buyers
- 3.5.4 Threat of Substitutes
- 3.5.5 Competitive Rivalry – Intensity Assessment
- 3.6 Concrete Scanners Value Chain Analysis
- 3.6.1 Upstream – Raw Material/Input Suppliers
- 3.6.1.1 Raw Material/Input 1
- 3.6.1.2 Raw Material/Input 2
- 3.6.1.3 Raw Material/Input 3
- 3.6.2 Midstream – Production/Manufacturing/Service Delivery
- 3.6.2.1 Production/Process Overview
- 3.6.2.2 Key Facility Locations & Capacity by Manufacturer
- 3.6.3 Downstream – Distribution & End Consumer
- 3.6.3.1 Primary Channel – B2B/OEM
- 3.6.3.2 Secondary Channels – Dealer, Retail, Online, Direct
- 3.6.4 Value Chain Profitability Analysis
- 3.6.1 Upstream – Raw Material/Input Suppliers
- 3.7 PESTEL Analysis
- 3.7.1 Political Factors
- 3.7.2 Economic Factors
- 3.7.3 Social Factors
- 3.7.4 Technological Factors
- 3.7.5 Environmental Factors
- 3.7.6 Legal Factors
- 3.8 Concrete Scanners Supply Chain Analysis
- 3.8.1 Raw Material/Input Supply Risk Assessment
- 3.8.2 Manufacturing Concentration Risk (Geographic Exposure)
- 3.8.3 Trade Disruption Impact Analysis
- 3.9 Regulatory & Policy Landscape
Note: The regulatory and policy landscape section covers regulations based on their applicability to the market, Concrete Scanners category, geography, and scope of the study. Only regulatory frameworks with a material impact on operations, compliance, trade, sustainability, or market access are analyzed in detail.
Chapter 4. Key Investment Pockets & Opportunity Analysis
- 4.1 Concrete Scanners Market Attractiveness Analysis
- 4.1.1 By Region – Investment Attractiveness Matrix (Volume × CAGR)
- 4.2 Absolute Revenue Growth Opportunity
- 4.2.1 By Region – Absolute USD Growth Through 2032
- 4.3 Incremental Volume Opportunity
- 4.3.1 By Region – Incremental Volume Through 2032
- 4.3.2 Segment – Incremental Volume
- 4.4 Emerging Submarket Opportunity Deep Dive (Subject to Applicability)
- 4.5 Emerging Market Opportunity Scorecards
- 4.5.1 United States
- 4.5.2 Europe
- 4.5.3 Asia
- 4.5.4 Middle East & Africa
Note: Emerging Market Opportunity Scorecards will be included based on relevance and strategic importance. Regions listed are indicative and may vary depending on data availability and market dynamics.
Chapter 5. Concrete Scanners Import-Export Analysis & Trade Flows
- 5.1 Global Trade Overview
- 5.1.1 Global Export Value by Country (2024)
- 5.1.2 Global Export Volume by Country (2024)
- 5.1.3 Global Import Value by Country (2024)
- 5.1.4 Global Import Volume by Country (2024)
- 5.1.5 Net Trade Balance by Country (2024)
- 5.2 Export Analysis – Segment
- 5.2.1 Type 1 (HS Code)
- 5.2.2 Type 2 (HS Code)
- 5.2.3 Type 3 (HS Code)
- 5.2.4 Type 4 (HS Code)
- 5.2.5 Type 5 (HS Code)
- 5.3 Import Analysis – Segment
- 5.3.1 Type 1 (HS Code)
- 5.3.2 Type 2 (HS Code)
- 5.3.3 Type 3 (HS Code)
- 5.3.4 Type 4 (HS Code)
- 5.3.5 Type 5 (HS Code)
- 5.4 Average Unit Trade Prices
- 5.4.1 Average Export Price – Segment & Country
- 5.4.2 Average Import Price – Segment & Source Country
- 5.4.3 Price Trends (2024)
- 5.5 Key Trade Route Analysis
- 5.5.1 Trade Route 1
- 5.5.2 Trade Route 2
- 5.5.3 Trade Route 3
- 5.5.4 Trade Route 4
- 5.5.5 Trade Route 5
- 5.6 Trade Policy Impact Assessment
- 5.6.1 US Anti-Dumping & Section 301 Tariffs
- 5.6.2 EU Customs Union Impact
- 5.6.3 Major Free Trade Agreements
- 5.6.4 USMCA Rules of Origin
Note: Trade policy analysis will be included only where relevant to the Concrete Scanners market.
Chapter 6. Competitive Landscape & Company Benchmarking
- 6.1 Concrete Scanners Market Concentration & Structure
- 6.1.1 Herfindahl-Hirschman Index (HHI) – vs. 2024
- 6.1.2 Tier 1, Tier 2 & Tier 3 Market Structure
- 6.1.3 Global, Regional & Local Player Dynamics
- 6.2 Concrete Scanners Market Share Analysis – 2024
- 6.2.1 Global Revenue Share by Company
- 6.2.2 Global Volume Share by Company
- 6.2.3 Regional Revenue Share
- 6.2.4 Market Share Evolution ( vs. 2024)
- 6.2.5 OEM Segment Share by Company
- 6.2.6 Replacement Segment Share by Company
- 6.3 Production/Delivery Capacity & Facility Analysis
- 6.3.1 Global Installed Capacity
- 6.3.2 Capacity Utilization Rates
- 6.3.3 Production/Output Volume
- 6.3.4 Facility Locations & Capacity Map
- 6.3.5 Planned Capacity Additions
- 6.4 Concrete Scanners Competitive Benchmarking Matrix
- 6.4.1 Revenue, Volume, CAGR & Profitability Comparison
- 6.4.2 Channel Revenue Mix
- 6.4.3 Geographic Revenue Exposure
- 6.4.4 R&D Intensity
- 6.4.5 Sustainability Maturity
- 6.5 Strategic Developments in Concrete Scanners (Last 24 Months)
- 6.5.1 Mergers, Acquisitions & Divestments
- 6.5.2 New Concrete Scanners Launches
- 6.5.3 Facility Expansions
- 6.5.4 Strategic Alliances, Joint Ventures & Partnerships
- 6.5.5 Distribution Expansion & Market Entry
- 6.5.6 Sustainability & ESG Initiatives
- 6.6 Competitive Strategy Mapping
- 6.6.1 Leader, Challenger, Follower & Niche Classification
- 6.6.2 Pricing Strategy Comparison
- 6.6.3 Channel Strategy Matrix
Note: Strategic developments are included based on their materiality and the availability of reliable information.
Chapter 7. Global Concrete Scanners Market – By Distribution Channel
- 7.1 Segment Overview
- 7.1.1 Volume & Revenue Split by Channel (2024 & 2032)
- 7.1.2 Channel Mix Evolution (2024-2032)
Chapter 8. Regional Market Analysis – Global Overview
- 8.1 Global Regional Overview
- 8.1.1 Regional Volume Share
- 8.1.2 Regional Revenue Share
- 8.1.3 Regional Volume by Region
- 8.1.4 Regional Revenue by Region
- 8.1.5 Regional Forecast Through 2032
- 8.2 Cross-Regional Segment Analysis
- 8.2.1 By Distribution Channel
- 8.2.2 By Brand/Price Tier
Chapter 9. North America Concrete Scanners Market
- 9.1 United States
- 9.2 Canada
- 9.3 Mexico
Chapter 10. Europe Concrete Scanners Market
- 10.1 Germany
- 10.2 France
- 10.3 Italy
- 10.4 United Kingdom
- 10.5 Spain
- 10.6 Poland
- 10.7 Russia
- 10.8 Netherlands
- 10.9 Belgium
- 10.10 Sweden
- 10.11 Denmark
- 10.12 Norway
- 10.13 Rest of Europe
Chapter 11. Asia Pacific Concrete Scanners Market
- 11.1 China
- 11.2 India
- 11.3 Japan
- 11.4 South Korea
- 11.5 Thailand
- 11.6 Indonesia
- 11.7 Vietnam
- 11.8 Malaysia
- 11.9 Australia
- 11.10 Rest of Asia Pacific
Chapter 12. Latin America Concrete Scanners Market
- 12.1 Brazil
- 12.2 Argentina
- 12.3 Colombia
- 12.4 Chile
- 12.5 Rest of Latin America
Chapter 13. Middle East Concrete Scanners Market
- 13.1 Saudi Arabia
- 13.2 United Arab Emirates
- 13.3 Turkey
- 13.4 Israel
- 13.5 Iran
- 13.6 Rest of the Middle East
Chapter 14. Africa Concrete Scanners Market
- 14.1 South Africa
- 14.2 Egypt
- 14.3 Nigeria
- 14.4 Morocco
- 14.5 Rest of Africa
Chapter 15. Concrete Scanners Company Profiles
- 15.1 [Company 01]
- 15.1.1 Company Overview
- 15.1.2 Key Management Personnel
- 15.1.3 Products & Services Portfolio
- 15.1.4 Financial Performance
- 15.1.5 Key Market Focus & Geographic Presence
- 15.1.6 Recent Developments & Strategic Initiatives
Note: The company profile list is preliminary and may change based on research findings, market developments, data availability, and client requirements.
Chapter 16. Appendices
- Appendix A – List of Abbreviations & Acronyms
- Appendix B – Industry Classification Code Reference – Full Series
- Appendix C – Production & Capacity Data Tables
- Appendix D – End-Use & Demand Base Tables
- Appendix E – Consumption & Replacement Rate Assumptions
- Appendix F – ASP Reference Tables
- Appendix G – Manufacturing & Facility Database
- Appendix H – Import-Export Data Tables
- Appendix I – Regulatory Summary Tables
- Appendix J – Primary Research Participant List (Anonymized)
- Appendix K – Primary Research Questionnaire Framework
- Appendix L – Data Sources & Bibliography
- Appendix M – Market Size Divergence & Source Comparison
Chapter 17. Research Methodology
- 17.1 Research Framework & Philosophy
- 17.2 Secondary Research – Sources, Hierarchy & Data Extraction
- 17.3 Data Modeling – Bottom-Up & Top-Down Market Sizing
- 17.4 Primary Research – Stakeholder Framework, LOI & Sample Sizes
- 17.5 Forecast Methodology – Regression, Scenario & Sensitivity Analysis
- 17.6 Quality Control – Four-Layer Validation Framework
- 17.7 Limitations & Standard Assumptions
- 17.8 Disclaimer
