Market overview
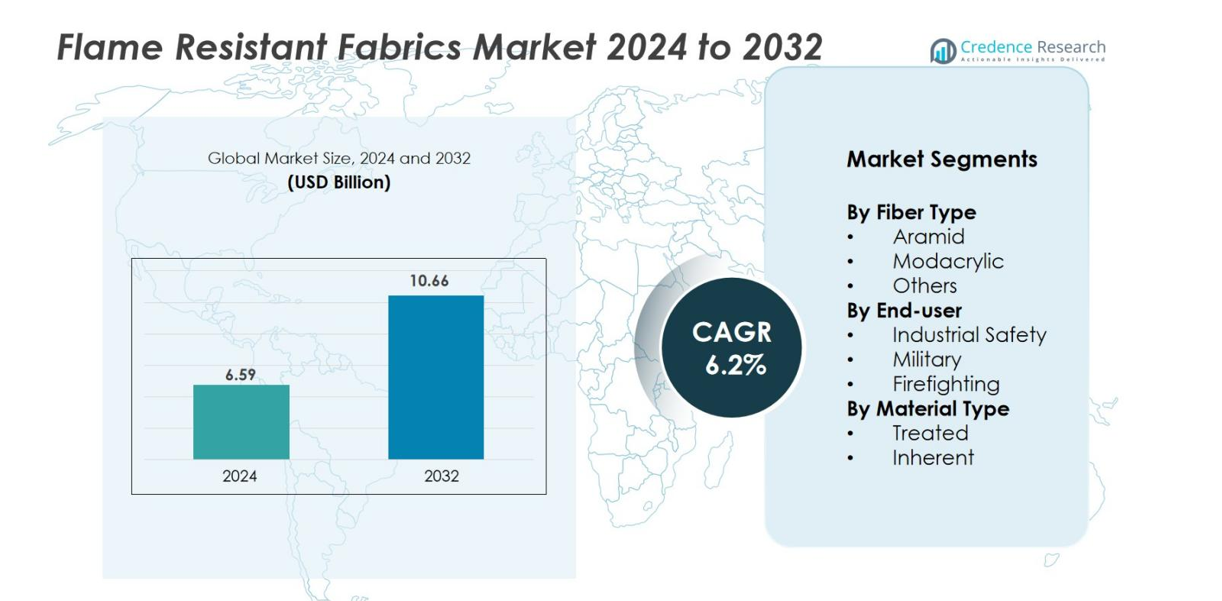
The Flame-Resistant Fabrics market size was valued at USD 6.59 billion in 2024 and is anticipated to reach USD 10.66 billion by 2032, at a CAGR of 6.2% during the forecast period.
| REPORT ATTRIBUTE |
DETAILS |
| Historical Period |
2020-2023 |
| Base Year |
2024 |
| Forecast Period |
2025-2032 |
| Flame Resistant Fabrics Market Size 2024 |
USD 6.59 billion |
| Flame Resistant Fabrics Market, CAGR |
6.2% |
| Flame Resistant Fabrics Market Size 2032 |
USD 10.66 billion |
The Flame-Resistant Fabrics market remains highly competitive and is led by established companies such as DuPont de Nemours, Inc., Milliken & Company, Nam Liong Global Corporation, and Klopman International, each leveraging advanced material technologies, global distribution capabilities and strong regulatory compliance. Regionally, North America leads the market with approximately 35% share of global revenue, driven by its mature industrial and defence sectors. In parallel, the Asia‑Pacific region emerges as the fastest‑growing market, commanding roughly 46% of the global share, fueled by rapid industrialisation, construction growth and increasing worker‑safety mandates.
Market Insights
- The Flame-Resistant Fabrics market was valued at USD 6.59 billion in 2024 and is expected to reach USD 10.66 billion by 2032, growing at a CAGR of 6.2% during the forecast period.
- Key market drivers include stringent safety regulations across industries, growing industrialization in emerging economies, and advancements in fabric technology, such as the development of lightweight and durable materials.
- Increasing demand for eco-friendly flame-resistant fabrics and the expansion of safety requirements in emerging markets present significant growth opportunities for manufacturers.
- The market is highly competitive, with major players such as DuPont, Milliken & Company, and Nam Liong Global Corporation focusing on product innovation, strategic mergers, and regional expansions to strengthen their positions.
- Regionally, North America holds 35% of the market share, while Asia-Pacific leads with 46%, driven by growing industrial and construction sectors, particularly in China and India.
Access crucial information at unmatched prices!
Request your sample report today & start making informed decisions powered by Credence Research Inc.!
Download Sample
Market Segmentation Analysis
By Fiber Type
The Flame-Resistant Fabrics market is significantly segmented by fiber type, with Aramid, Modacrylic, and other fibers being key categories. Aramid fibers dominate this segment, holding the largest market share of 50% due to their excellent heat resistance and strength, making them the preferred choice for protective clothing in high-risk industries. Aramid-based fabrics are widely used in industrial safety and military applications. The growing demand for lightweight yet durable protective wear, coupled with stringent safety regulations, is driving the market for Aramid fibers, which is expected to grow at a substantial rate in the coming years.
- For instance, DuPont’s Nomex®, a meta-aramid fiber, forms a protective barrier when exposed to flame by swelling and thickening, providing firefighters crucial extra seconds to escape.
By End-User
The end-user segment of the Flame Resistant Fabrics market includes industrial safety, military, and firefighting sectors. Among these, industrial safety holds the dominant share, accounting for 45% of the market. This is primarily driven by the increasing awareness of worker safety and the implementation of stricter workplace safety regulations. The military and firefighting sectors also contribute significantly to the market, accounting for 30% and 25% respectively. The consistent rise in industrial activities and hazardous work environments is expected to further fuel growth in this segment.
- For instance, the firefighting sector also relies heavily on advanced flame-resistant fabrics, with manufacturers like DuPont providing Nomex® suits that enhance protection and durability for firefighters in extreme conditions.
By Material Type
Flame-resistant fabrics are divided into treated and inherent materials, with treated fabrics currently holding a larger market share of 60%. Treated fabrics are more affordable and offer enhanced flame resistance through chemical treatments, making them a popular choice for industries with lower budgets. In contrast, inherent fabrics, which make up the remaining 40%, are naturally flame-resistant and are expected to grow in demand due to their superior performance and durability. The preference for higher-quality, long-lasting protective clothing is driving the shift towards inherent materials, particularly in safety-conscious sectors like firefighting and military.
Key Growth Drivers
Stringent Safety Regulations
One of the primary growth drivers for the Flame Resistant Fabrics market is the increasing implementation of stringent safety regulations across industries. Governments and regulatory bodies are enforcing stricter safety standards to protect workers in hazardous environments such as manufacturing, oil & gas, and construction. These regulations mandate the use of flame-resistant clothing, thereby increasing the demand for protective fabrics. As industries continue to prioritize worker safety, companies are compelled to invest in flame-resistant fabrics to comply with safety norms. Additionally, rising awareness about the importance of personal protective equipment (PPE) further contributes to the market’s growth.
- For instance, in the United States, NFPA 2112 and NFPA 70E standards mandate flame-resistant clothing for workers in oil refineries, chemical plants, and electrical work, requiring garments to self-extinguish and resist melting even after multiple washes.
Growing Industrialization and Urbanization
The global trend toward industrialization and urbanization is significantly driving the Flame Resistant Fabrics market. As industrial activities expand in sectors like oil & gas, construction, and manufacturing, the need for protective clothing is rising. Urbanization is also contributing to the growth of industries in emerging economies, where workers face heightened exposure to risks such as fires and heat. These workers require high-performance flame-resistant clothing to ensure their safety. The global push for infrastructure development, particularly in developing nations, coupled with the increasing number of industrial projects, is expected to lead to a surge in demand for flame-resistant fabrics.
- For instance, TenCate Protective Fabrics has launched innovations like Tecasafe 360+, an inherently flame-resistant stretch fabric combining mobility and safety, targeting expanding industrial sectors and infrastructure projects globally.
Advancements in Fabric Technology
Advancements in fabric technology have become a significant driver for the Flame Resistant Fabrics market. Innovations in textile manufacturing, such as the development of lightweight, breathable, and more durable flame-resistant materials, are increasing the comfort and effectiveness of protective clothing. Technologies like the incorporation of nano-coatings or hybrid fibers are enhancing the performance of flame-resistant fabrics, offering better resistance to heat and flames while maintaining comfort for wearers. Furthermore, new manufacturing processes are enabling the production of more cost-effective flame-resistant materials, making them more accessible to various industries.
Key Trends & Opportunities
Demand for Eco-friendly Flame Resistant Fabrics
As sustainability becomes a growing concern globally, the demand for eco-friendly flame-resistant fabrics is rising. Manufacturers are increasingly adopting sustainable practices by developing flame-resistant materials made from natural fibers or recycled content. The demand for biodegradable and non-toxic flame-resistant fabrics is growing, driven by both environmental consciousness and regulations regarding the use of harmful chemicals in textiles. These fabrics not only provide the necessary protective qualities but also address consumer preferences for sustainable and eco-friendly products. This trend presents significant opportunities for companies to tap into the green market while fulfilling safety and compliance requirements.
- For instance, innovations like SaFR flame-retardant viscose by Birla Cellulose provide sustainable fibers with inherent flame resistance without post-production chemicals, maintaining performance and comfort over time.
Expansion in Emerging Markets
Emerging markets, particularly in Asia-Pacific, Latin America, and Africa, are presenting new opportunities for the Flame Resistant Fabrics market. These regions are undergoing rapid industrialization and urbanization, which is increasing the demand for worker safety equipment, including flame-resistant clothing. Countries like China, India, and Brazil, with their expanding industrial sectors, are key growth areas for protective fabric manufacturers. As safety regulations in these regions evolve and improve, the demand for flame-resistant fabrics is expected to grow exponentially. Manufacturers are increasingly focusing on these emerging markets to capitalize on their growing industrial base and rising awareness of workplace safety.
- For instance, Milliken & Company supplies tailored flame-resistant solutions in India and Brazil, emphasizing sustainable product lines that meet both performance and ecological demands.
Key Challenges
High Production Costs
A significant challenge facing the Flame Resistant Fabrics market is the high production costs associated with manufacturing advanced protective fabrics. The raw materials used in flame-resistant textiles, such as aramid fibers and high-performance chemicals, can be expensive. Additionally, the specialized manufacturing processes required to ensure the durability and effectiveness of flame-resistant fabrics add to production costs. For many companies, especially smaller or regional manufacturers, these costs can limit their ability to compete with larger, well-established players in the market. The need for continuous research and development to improve fabric performance while controlling costs is an ongoing challenge.
Limited Awareness in Developing Regions
In many developing regions, there is limited awareness of the importance of flame-resistant fabrics and protective gear, which is a key challenge for market growth. Workers in industries such as construction, mining, and manufacturing may not fully understand the risks associated with fire hazards or may not prioritize safety equipment due to budget constraints. This lack of awareness, combined with lower enforcement of safety regulations in some regions, hinders the adoption of flame-resistant fabrics. To overcome this challenge, market players must invest in educational campaigns, increase awareness of the importance of protective clothing, and work with local governments to enforce safety standards.
Regional Analysis
Asia-Pacific (APAC)
The Asia-Pacific region holds the largest share in the flame-resistant fabrics market holds 46% and is also the fastest-growing region. Rapid industrialization, large-scale infrastructure projects, and expanding oil & gas, construction, and manufacturing sectors in countries such as China and India drive demand. Workplace safety regulations and rising awareness of fire hazards intensify the uptake of flame-resistant protective textiles. Lower production costs and local manufacturing bases further support this region’s dominance and growth trajectory.
North America
North America commands a substantial market share captures 35% in the flame-resistant fabrics market. Strong industrial safety frameworks, mature defense spending, and stringent regulatory oversight (for example, in workplaces across the U.S. and Canada) underpin demand. Large manufacturing, oil & gas, utility, and transport sectors require high-performance FR fabrics for worker protection. Technological innovation and higher disposable income also contribute to sustained demand in this region.
Europe
Europe accounts for a significant portion of the market, estimated at more than 30% in some assessments. Compliance with stringent EU fire and safety regulations, strong demand from the transport and defense segments, and emphasis on sustainable and high-quality protective textiles drive growth. Countries such as Germany and the UK serve as notable hubs, with expanding need in automotive, construction, and industrial safety applications. Additionally, continuous innovation in technical textiles and increasing adoption of advanced protective gear across manufacturing sectors further strengthen the region’s overall market position.
Middle East & Africa (MEA)
The Middle East & Africa region represents an emerging but important segment, with 20% share of the global market in some estimates. Growth is fueled by large-scale oil & gas developments, refining infrastructure, and heightened worker-safety mandates in hazardous environments. However, variable regulation enforcement and economic fluctuations moderate the pace of expansion compared with mature regions. Rising investments in large industrial projects, along with gradual adoption of global safety standards, are enhancing long-term demand for flame-resistant fabrics across diverse industries.
Latin America
Latin America is estimated to contribute 10% or slightly under of the global flame-resistant fabrics market. The region’s opportunity lies in growing industrial, mining, oil & gas, and construction activities, paired with increasing awareness around protective clothing. While regulatory frameworks are less mature than in developed regions, rising safety consciousness and infrastructure growth point to steady future expansion. Emerging government initiatives supporting worker protection and increased spending by private firms on high-performance PPE are further accelerating the region’s adoption of flame-resistant materials.
Market Segmentations
By Fiber Type
By End-user
- Industrial Safety
- Military
- Firefighting
By Material Type
By Geography
- North America
- Europe
- Germany
- France
- U.K.
- Italy
- Spain
- Rest of Europe
- Asia Pacific
- China
- Japan
- India
- South Korea
- South-east Asia
- Rest of Asia Pacific
- Latin America
- Brazil
- Argentina
- Rest of Latin America
- Middle East & Africa
- GCC Countries
- South Africa
- Rest of the Middle East and Africa
Competitive Landscape
The competitive landscape of the flame resistant fabrics market is marked by the presence of well-established global players who drive innovation, set safety standards, and secure long‑term contracts across critical sectors. Companies such as U-Long High-Tech Textile Co., Ltd., Inc. and TenCate Protective Fabrics lead in advanced fiber technology such as meta‑aramids and high‑performance inherent flame‑resistant materials while firms like Milliken & Company and Indorama Ventures leverage scale, global reach, and diversified fabric portfolios. Regional specialists such as Nam Liong Global Corporation, Klopman International and SIKOR‑TEX cater to local demand dynamics and supply chains in Asia‑Pacific and emerging markets. These players compete on the basis of product performance, regulatory compliance, sustainability credentials and cost‑effectiveness. Mergers, acquisitions, technology licensing, and regional manufacturing expansions remain key strategic moves to consolidate market positions and gain first‑mover advantage in emerging applications and geographies.
Shape Your Report to Specific Countries or Regions & Enjoy 30% Off!
Key Player Analysis
Recent Developments
- In January 2024, Henan Zhuoer Protective Technology Co., Ltd. launched premium-quality flame-resistant fabric (260gsm FR cotton flame-resistant uniforms) that is composed of 98% cotton and 2% antistatic materials.
- In January 2023, Milliken & Company announced the elimination of all PFAS from its textile fibres and finishes portfolio, including its flame-resistant fabric lines.
- In June 2022, DuPont de Nemours, Inc. launched Nomex® Comfort with EcoForce™ technology, a flame-resistant fabric with a bio-based chemical-repellent finish.
Report Coverage
The research report offers an in-depth analysis based on Fiber Type, End-User, Material Type and Geography. It details leading market players, providing an overview of their business, product offerings, investments, revenue streams, and key applications. Additionally, the report includes insights into the competitive environment, SWOT analysis, current market trends, as well as the primary drivers and constraints. Furthermore, it discusses various factors that have driven market expansion in recent years. The report also explores market dynamics, regulatory scenarios, and technological advancements that are shaping the industry. It assesses the impact of external factors and global economic changes on market growth. Lastly, it provides strategic recommendations for new entrants and established companies to navigate the complexities of the market.
Future Outlook
- Growth will continue driven by increasing safety regulations across industrial, military and firefighting sectors, with high-performance fabrics becoming mandatory in many regions.
- Demand for inherently flame‑resistant fibers (such as aramids) will rise as users seek longer‑lasting, maintenance‑free protection rather than treated fabrics.
- Manufacturers will invest in sustainable flame‑resistant materials and eco‑friendly chemical treatments to meet environmental and regulatory pressures.
- Emerging markets in Asia‑Pacific, Latin America and Africa will offer significant growth opportunities as industrialisation, infrastructure development and worker‑safety awareness increase.
- Fabric innovations will focus on lightweight, breathable, multi‑functional textiles that combine flame resistance with cut resistance, chemical protection or high‑visibility features.
- Smart textiles and integrated sensor technologies may become part of flame‑resistant garments, enabling real‑time monitoring of hazard exposure and fabric performance.
- Supply chain localization and regional manufacturing expansion will help reduce lead times and costs, particularly for end‑users in remote or regulated markets.
- Price sensitivity and cost pressures will push manufacturers to optimise raw‑material sourcing and production efficiency, particularly in the treated‑fabric segment.
- End‑users will increasingly prefer certified and traceable flame‑resistant materials, driving transparency, standardisation and digital tagging in the value chain.
- While growth is solid, fabric producers will need to navigate raw‑material volatility, regulatory changes and competition from substitute technologies to sustain margins.


