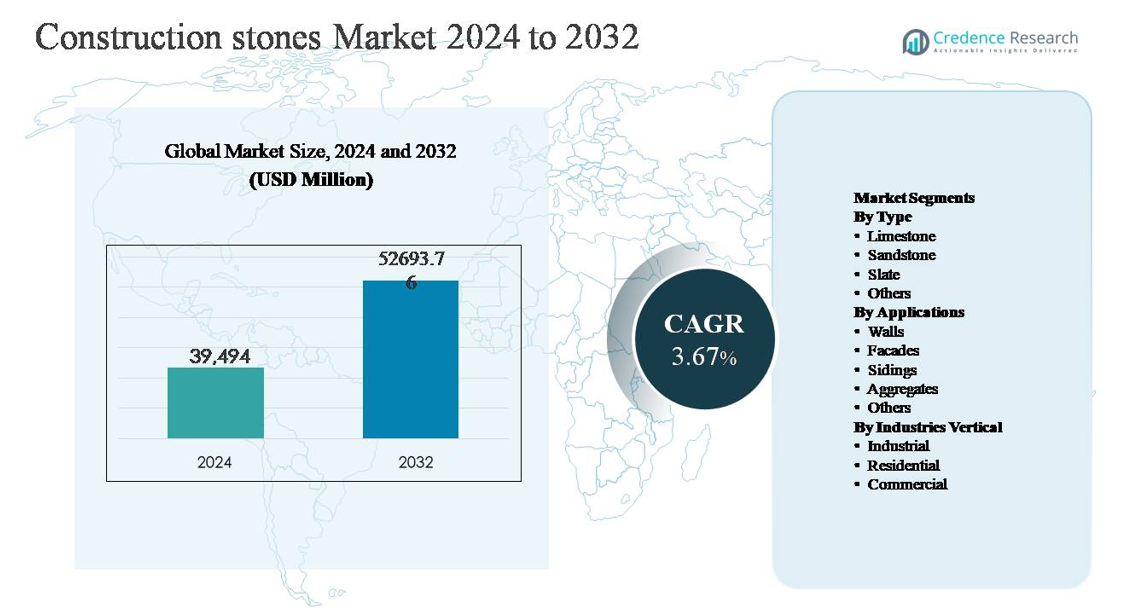
Home » Advanced Materials » Construction Stones Market

Construction Stones Market By Type of Stone (Granite, Marble, Limestone, Sandstone, Slate, Travertine); By End-Use Applications (Residential Construction, Commercial Construction, Monuments and Memorials, Landscaping, Infrastructure Projects); By Product Forms (Blocks, Slabs, Tiles, Cobbles and Pebbles); By Quality and Grade (First Grade, Second Grade, Third Grade); By Size and Dimensions (Standard Sizes, Custom Sizes); By Color and Appearance (White and Light-Colored Stones, Dark-Colored Stones); By Sustainability and Certification (Sustainable Stones, Certified Stones); By Installation and Maintenance Services (Stones with Installation Services, Maintenance Services); By Region – Growth, Future Prospects & Competitive Analysis, 2023 – 2030

Price: $4999

Published: | Report ID: 32108 | Report Format : PDF

Market Insights

  • The global demand for construction stones was valued at USD 38451.2 million in 2022 and is expected to reach USD 72231.72 million in 2030, growing at a CAGR of 8.20% between 2023 and 2030.
  • Granite is the leading segment by type of stone. Marble, on the other hand, is expected to grow at a strong CAGR.
  • The leading end-use application segment is residential construction.
  • The CAGR for the tiles is expected to be the highest during the projection period.
  • During the forecast time frame, the first-grade category will likely have the highest CAGR.
  • Custom sizes are estimated to have the greatest CAGR during the forecast period.
  • The white and light-coloured stones segment will likely have the highest CAGR during the prediction period.
  • The most significant category of sustainability and certification is sustainable stones.
  • The stones with installation services segment CAGR will be at the top during the anticipated period.
  • Asia Pacific dominated the construction stones market.
  • The second-largest market for construction stones is expected to be found in Europe.
  • North America is anticipated to grow at the fastest rate in the market for construction stones.
  • The factors propelling the growth of the global market are the increasing use of stones in the construction of public and residential structures and in the construction of walls, columns, dams, abutments, and bridges.
  • Opportunities for the global construction stone market are being created by the growing use of stones as aggregate for concrete and in the manufacturing of cement and sand.

Construction Stones Market

Design Element 2

Access crucial information at unmatched prices!

Request your free sample report today & start making informed decisions powered by Credence Research!

Download Free Sample
CTA Design Element 3

Executive Summary

Market Definition

Natural rocks or minerals that are utilized in construction are called construction stones. They provide both structural and aesthetic functions. Many types of stones, including slate, gneiss, granite, quartzite, travertine, marble, limestone, sandstone, basalt, and laterite, can be used for construction. Building stones should be sturdy, hard, and free of any defects that may weaken and shorten their lifespan, such as soft patches, cracks, or other imperfections.

Market Overview

The market for construction stones has been expanding steadily in recent years, and between 2023 and 2030, it is anticipated to rise at a CAGR of 8.20%. The market was estimated to be worth USD 38451.2 million in 2022, and it is anticipated to be worth USD 72231.72 million in 2030.

The market for construction stones is expanding due to the easy and plentiful supply of marble. All across the world, there are plenty of marble quarries. The demand for high-quality marble stone for residential, commercial, and industrial infrastructures is met globally by the vast and superior marble quarries in the U.S., Italy, Turkey, and Spain. There are large marble quarries in every nation, making marble easily accessible and streamlined for final product processing. Marble is taken out of open-pit mines, which can be modest or large. Marble mining is a capital-intensive process, but because there are many quarries worldwide, transportation and logistical costs are minimal.

Outdoor spaces, such as a backyard, offer architects and construction specialists a chance to leave their imprint on any building project. This is where using natural stones to achieve this goal is beneficial. Any outdoor space that includes natural stone can be transformed into a fashionable, comfortable area where people can gather and unwind. The stone adds the same degree of visual appeal to the outside as it does to the inside. Natural stone installations in gardens, patios, balconies, and walkways are easily noticeable, whether on a home or business site. This trend is expected to drive the growth of the global construction stones market.

Segmentation by Type of Stone

  • Granite is the market leader by type of stone. Granite is typically used to build monuments, gravestones, and temples. Granite carving took time before electric tools and equipment were invented. It was also a lot of work. Stone was thus reserved for significant undertakings.
  • The marble category will exhibit a sizable CAGR during the projected period. Marble is mostly used for novelty, interior design, statues, table tops, buildings, and monuments. Their most crucial characteristics are colour and look.
  • Other stones, such as limestone, sandstone, slate, and travertine, also contribute to the demand for construction stones.

Segmentation by End-Use Applications

  • The main end-use application category is residential construction. The process of building a new house or other place meant to be utilized for residential purposes is known as residential construction. With many steps and parties involved, residential development may be complicated.
  • The commercial construction category will likely register a significant CAGR during forecasting. Constructing buildings and other structures for business usage is known as commercial construction. It consists of manufacturers, warehouses, retail establishments, and office buildings.
  • Other end-use applications, such as monuments and memorials, landscaping, and infrastructure projects, also contribute to the demand for construction stones.

Segmentation by Product Forms

  • The tiles category is expected to grow fastest during the projected period. Tiles are frequently utilized as dining room tabletops and flooring in kitchens, baths, parking lots, and rooftops. Materials such as ceramic, porcelain, glass, stone, or metal are used to make tiles.
  • Other product forms, such as blocks, slabs, cobbles, and pebbles, also contribute to the demand for construction stones.

Segmentation by Quality and Grade

  • First grade is anticipated to have the highest compound annual growth rate (CAGR) during the forecast timeframe. This is due to the rising demand for first-grade construction stones from the commercial construction industry.
  • Other qualities and grades, such as second and third grades, also contribute to the demand for construction stones.

Segmentation by Size and Dimensions

  • Custom-sized stones will be expected to have the foremost CAGR during the prediction period. Residential construction sectors are utilizing custom-sized stones in large quantities. Because of this, the need for these stones is increasing.
  • Other sizes and dimensions, such as standard sizes, also contribute to the demand for construction stones.

Segmentation by Color and Appearance

  • Throughout the forecast duration, the white and light-coloured stones category is anticipated to have the greatest CAGR. White-coloured limestone is a naturally occurring stone. It is frequently utilized in architectural and construction applications because of its calcium carbonate composition. Limestone is a highly popular option for floors, countertops, and other surfaces around the house.
  • The need for construction stones is also influenced by stones’ other colours and appearances, such as dark-coloured stones.

Segmentation by Sustainability and Certification

  • The highest CAGR is anticipated for sustainable stones throughout estimation. The sustainable levels of landscaping, interior design, building, restoration, and architecture are all enhanced by using limestone, sandstone, marble, granite, travertine, or slate.
  • Other sustainability and certification, such as certified stones, also contribute to the demand for construction stones.

Segmentation by Installation and Maintenance Services

  • Over the estimation period, stones with installation services are expected to have the greatest CAGR. This is due to the growing demand for the installation services of construction stones from various industries.
  • Other installation and maintenance services, such as maintenance services, impact the demand for construction stones.

Segmentation by Region

  • Asia Pacific leads the construction stones market. The need for construction stones is rising throughout Asia Pacific, particularly in South Korea, China, India, and other nations.
  • Europe is estimated to rank second in market size for construction stones.
  • North America will witness the most rapid growth in the construction stones market.
  • The demand for remaining construction stones is met by regions of the world such as Africa, the Middle East, and Latin America.

Construction Stones Market Research

The importance of using natural stones in construction seems to increase since architects are developing new and creative ways to showcase these stones’ beauty in various architectural contexts. Granite manufacturers worldwide have been developing fresh products and finishes in response to the evolving needs for granite and other natural stones. This has enabled architects to find new applications for granite.

During forecasting, Asia Pacific will probably rule the construction stones market. In terms of market share globally, the area occupied a leading position. China leads India in market share within the region, driven by increased demand from the construction stone industry. Globally, the top producers of construction stones are China and India. The majority of these nations’ exports go to all major consumer nations. Because the government and private sector are spending a lot of money on residential and commercial projects, there is an increase in the demand for construction stones.

The North American area is projected to grow fastest throughout the forecast. Stones are utilized across North America for building retaining walls, harbours, lighthouses, piers, lintels, columns, arches, foundations and bridge abutments. Good-looking stones are utilized in architectural and ornamental structures in North America. For face works, polished marble and granite are frequently utilized.

In the U.S., stones are used to pave roadways, walkways, and open areas surrounding buildings. In American landscaping, sandstone is utilized for garden walls and pathways and is also a favourite material among sculptors. These are the key factors that boost the growth of the construction stones market.

Key Highlights of the Report

The global construction stones market is segmented by type of stone, end-use applications, product forms, quality and grade, size and dimensions, colour and appearance, sustainability and certification, installation and maintenance services, and region. As far as the type of stone is concerned, granite is the market spearhead. Residential construction is the top end-use application segment. The tiles are expected to grow at the highest CAGR during the forecast period. Sustainable stones are anticipated to experience the highest CAGR during the forecast period. The construction stone market is expanding mostly in Asia Pacific.

The construction industry’s growing emphasis on sustainability drives the adoption of natural building materials. Customers are prepared to spend extra for real stone and marble with a lasting appearance. Premium customers’ desire for pricey natural stones, such as White Statuario marble, is also growing. The stone business is still experiencing tremendous growth due to kitchens and baths. These are the spaces where homeowners frequently request unusual and flashy designs. For these areas, natural stones make the perfect surface since they may offer a watertight installation with patterns that range from elegantly straightforward to strikingly complex. Furthermore, it is anticipated that the outdoor uses of these stones, such as pavement and cladding, would generate a need for natural stones that are appropriate for these uses. These factors support the growth of the construction stones market.

However, according to forecasts, Asia Pacific will hold the largest market share for construction stones globally. The Asia Pacific region’s expansion can be attributed to the growing usage of construction stone in residential and non-residential sectors. The Asia Pacific region is expanding mostly due to the desire to build green structures. The North American region is also assumed to have the market’s sharpest growth. The market is expanding due to non-residential development activities, such as the building of public safety, accommodation, and office buildings in North America.

Which Key Factors Are Driving The Global Construction Stones Market?

The market for construction stones is expanding due to several factors, including the growing use of stones for hollow blocks, cladding work, and civil engineering applications; also, limestone is being used more often to make cement and lime.

What Are The Key Challenges In The Global Market For Construction Stones?

Several obstacles prevent the construction stone industry from expanding, such as poor communication, a lack of labour and skilled workers, and high prices.

What Market Opportunities Exist For Construction Stones Globally?

There is much opportunity for expansion in the construction stone industry because stones are increasingly utilized for pool construction, river alternatives, artwork, and blast furnace emissions.

Market Drivers

Several factors influence the market for construction stones globally. The main factors influencing the market for construction stones globally are as follows:

Growing Inclination Towards Natural Stones And Building Endeavours

The increased demand for sustainable construction procedures reflects the growing preference for natural stones. There’s a growing emphasis on adopting materials with a lower carbon footprint and that are environmentally friendly as people grow more environmentally conscious. Natural stones are an environmentally friendly option to help achieve LEED certification and other green building requirements. In general, it is anticipated that consumers will continue to desire premium, eco-friendly, and visually appealing materials for their construction projects, driving the trend towards natural stones in the industry.

Market Restraints

Several challenges could prevent the expansion of the global market for construction stones. Among them are the following:

The Use of Engineered Stone in Place of Construction Stone

Adopting engineered stone instead of construction stone may hamper the market’s expansion. Engineered stone is used in many different interior areas of homes, including the living room, kitchen and bathroom. In addition, engineered stone is a great option for business settings like restaurants and doctor’s offices due to its nonporous nature and antifungal and antibacterial qualities. In addition, engineered stones are very strong and robust, which makes them a popular choice for commercial buildings like malls and offices. Due to these factors, the market for construction stone is declining as engineered stone replaces construction stone more often.

Opportunities

The global market for construction stones presents significant potential opportunities. The following is an example of these:

High Application Demand

In residential, commercial, and industrial settings, construction stones are used for various purposes. Because limestone has alkaline qualities similar to calcium carbonate, it can be utilized in the manufacturing and agricultural sectors. Additionally, construction stones are used to build various structures, including houses, roads, canals, dams, bridges, facades, and other similar constructions. Portland cement, which may be used with aggregate to create concrete, is made from crushed construction stones. Additionally, the design of walls and floors is mostly accomplished with construction stones like granite and marble. Pavements, walkways, and covered roofs are primarily built of slate and limestone. Construction stones have extensive application in walls, columns, damp-proof courses, lintels, foundations, and other structures. The building components, including walls, footings, columns, retaining walls, and others, use polished, cut, and shaped construction stones as decorative elements. Construction stone is primarily utilized as a building material because of its exceptional porosity and absorption, strength, and durability.

Competitive Landscape

Construction Stones Market Report

Shape Your Report to Specific Countries or Regions & Enjoy 30% Off!

Key Players

The global market for construction stones is very competitive, with many powerful players. Some of the leading market participants and their corresponding market shares are listed below:

  • JSC Stone & ALPS Stone
  • Levantina y Asociados de Minerales, S.A.
  • Benchmark Building Supplies Limited
  • Xiamen Yeyang Stone Group
  • Precision Countertops, Inc.
  • Regatta Universal Exports
  • Others

These companies prioritize mergers and acquisitions, expanding their distribution network, and developing new products to remain competitive.

The leading competitors in the global market for construction stones are constantly looking for ways to get an advantage by releasing new items and advancements.

In January 2023, Holcim purchased Chrono Chape, a prominent independent French supplier of self-levelling screeds for on-site applications. Builders can install floor finishes like tile or carpet on top of the smooth base these fluid processes provide. A strong alliance of efficiency and innovation is created by the company’s widespread presence in the French ready-mix concrete sector.

In June 2022, Barrette Outdoor Living, Inc., the top residential fencing and railing solutions provider in North America, was acquired by CRH plc, the world’s largest construction material manufacturer, for USD 1.9 billion from TorQuest Partners and Caisse de dépôt et placement du Québec (CDPQ). The purpose of this acquisition is to efficiently allocate and reallocate capital to maximize shareholder value.

Summary of Key Findings

  • Growing interest in natural stones and building projects is driving the growth of the construction stone industry.
  • The market is segmented by type of stone, end-use applications, product forms, quality and grade, size and dimensions, colour and appearance, sustainability and certification, installation and maintenance services, and region.
  • Granite is the most often used stone in the market.
  • The most ubiquitous end-use application fragment is residential construction.
  • Regarding CAGR, the white and light-coloured stones are expected to grow fastest during the forecast period.
  • The category for sustainable stones will likely see the highest CAGR during the anticipated time frame.
  • Asia Pacific is leading market development; the market is highly competitive with key players including JSC Stone & ALPS Stone, Levantina y Asociados de Minerales, S.A., Benchmark Building Supplies Limited, Xiamen Yeyang Stone Group, Precision Countertops, Inc., Regatta Universal Exports, and others.

Future Outlook

  • Optimistic viewpoint for the global construction stones market with noteworthy growth potential in the Asia Pacific region.
  • The high application requirement is one of the main drivers of the construction stones market’s expansion.
  • A major obstacle to the market’s growth may arise during the anticipated period from the substitution of engineered stone for construction stone.
  • Foremost companies must concentrate on product innovation, expanding their market reach, and maintaining competitive pricing to stay ahead.

How CXOs Can Benefit from the Credence Research Construction Stones Market Report

The Credence Research Construction Stones Market Report provides CXOs with a comprehensive overview of the market, including:

  • Market size and growth forecast: The report provides detailed estimates of the global construction stones market size, segmented by type of stone, end-use applications, product forms, quality and grade, size and dimensions, colour and appearance, sustainability and certification, installation and maintenance services, and region. It also includes forecasts for the market through 2032 based on key trends and drivers.
  • Market segmentation: The report segments the construction stones market by type of stone, end-use applications, product forms, quality and grade, size and dimensions, colour and appearance, sustainability and certification, installation and maintenance services, and region. This segmentation provides CXOs with a granular understanding of the market and the opportunities in each segment.
  • Competitive landscape: The report profiles the key players in the construction stones market and provides insights into their strategies, product offerings, and financial performance. This information can help CXOs to identify and assess their competition.
  • Key trends and drivers: The report identifies and analyzes the key trends and drivers shaping the construction stones market. This information can help CXOs to make informed decisions about their investments and strategies.

CXOs can use the insights from the Credence Research Construction Stones Market Report to:

  • Identify growth opportunities: The report can help CXOs identify new growth opportunities in the construction stones market. For example, the report identifies the growing demand for construction stones from the residential and commercial construction industries as a key opportunity.
  • Make informed investment decisions: The report can help CXOs make informed investment decisions about construction stones. For example, the report provides insights into the key factors to consider when evaluating construction stone providers and selecting solutions.
  • Develop competitive strategies: The report can help CXOs develop competitive strategies for their construction stones businesses. For example, the report identifies the key strategies that construction stone providers are using to differentiate themselves from their competitors.
  • Track market developments: The report can help CXOs track market developments and stay ahead of the curve. For example, the report provides insights into the latest trends and innovations in the construction stones market.

Overall, the Credence Research Construction Stones Market Report is a valuable resource for CXOs who are looking to gain a deeper understanding of the market and identify growth opportunities.

Segmentation

  • By Type of Stone
    • Granite
    • Marble
    • Limestone
    • Sandstone
    • Slate
    • Travertine
  • By End-Use Applications
    • Residential Construction
    • Commercial Construction
    • Monuments and Memorials
    • Landscaping
    • Infrastructure Projects
  • By Product Forms
    • Blocks
    • Slabs
    • Tiles
    • Cobbles and Pebbles
  • By Quality and Grade
    • First Grade
    • Second Grade
    • Third Grade
  • By Size and Dimensions
    • Standard Sizes
    • Custom Sizes
  • By Color and Appearance
    • White and Light-Colored Stones
    • Dark-Colored Stones
  • By Sustainability and Certification
    • Sustainable Stones
    • Certified Stones
  • By Installation and Maintenance Services
    • Stones with Installation Services
    • Maintenance Services
  • By Region
    • North America
      • The U.S.
      • Canada
      • Mexico
    • Europe
      • Germany
      • France
      • The U.K.
      • Italy
      • Spain
      • Rest of Europe
    • Asia Pacific
      • China
      • Japan
      • India
      • South Korea
      • South-east Asia
      • Rest of Asia Pacific
    • Latin America
      • Brazil
      • Argentina
      • Rest of Latin America
    • Middle East & Africa
      • GCC Countries
      • South Africa
      • Rest of the Middle East and Africa

Table of Content
1. Preface
1.1. Report Description
1.1.1. Purpose of the Report
1.1.2. Target Audience
1.1.3. USP and Key Offerings
1.2. Research Scope
1.3. Market Introduction
2. Executive Summary
2.1. Market Snapshot: Global Construction Stones Market
2.1.1. Global Construction Stones Market, By Type of Stone
2.1.2. Global Construction Stones Market, By End-Use Applications
2.1.3. Global Construction Stones Market, By Product Forms
2.1.4. Global Construction Stones Market, By Quality and Grade
2.1.5. Global Construction Stones Market, By Size and Dimensions
2.1.6. Global Construction Stones Market, By Color and Appearance
2.1.7. Global Construction Stones Market, By Sustainability and Certification
2.1.8. Global Construction Stones Market, By Installation and Maintenance Services
2.1.9. Global Construction Stones Market, By Region
2.2. Insights from Primary Respondents
3. Market Dynamics & Factors Analysis
3.1. Introduction
3.1.1. Global Construction Stones Market Value, 2017-2030, (US$ Mn)
3.1.2. Y-o-Y Growth Trend Analysis
3.2. Market Dynamics
3.2.1. Construction Stones Market Drivers
3.2.2. Construction Stones Market Restraints
3.2.3. Construction Stones Market Opportunities
3.2.4. Major Construction Stones Industry Challenges
3.3. Growth and Development Patterns
3.4. Investment Feasibility Analysis
3.5. Market Opportunity Analysis
3.5.1. Type of Stone
3.5.2. End-Use Applications
3.5.3. Product Forms
3.5.4. Quality and Grade
3.5.5. Size and Dimensions
3.5.6. Color and Appearance
3.5.7. Sustainability and Certification
3.5.8. Installation and Maintenance Services
3.5.9. Geography
4. Market Competitive Landscape Analysis
4.1. Company Market Share Analysis, 2022
4.1.1. Global Construction Stones Market: Company Market Share, Value 2022
4.1.2. Global Construction Stones Market: Top 6 Company Market Share, Value 2022
4.1.3. Global Construction Stones Market: Top 3 Company Market Share, Value 2022
4.2. Global Construction Stones Market: Company Revenue Share Analysis, 2022
4.3. Company Assessment Metrics, 2022
4.3.1. Stars
4.3.2. Emerging Leaders
4.3.3. Pervasive Players
4.3.4. Participants
4.4. Startups/ SMEs Assessment Metrics, 2022
4.4.1. Progressive Companies
4.4.2. Responsive Companies
4.4.3. Dynamic Companies
4.4.4. Starting Blocks
4.5. Strategic Development
4.5.1. Acquisition and Mergers
4.5.2. New Product Launch
4.5.3. Regional Expansion
4.5.4. Partnerships
4.6. Key Player Product Matrix
4.7. Potential for New Players in the Global Construction Stones Market
5. Premium Insights
5.1. STAR (Situation, Task, Action, Results) Analysis
5.2. Porter’s Five Forces Analysis
5.2.1. Threat of New Entrants
5.2.2. Bargaining Power of Buyers/Consumers
5.2.3. Bargaining Power of Suppliers
5.2.4. Threat of Substitute Types
5.2.5. Intensity of Competitive Rivalry
5.3. PESTEL Analysis
5.3.1. Political Factors
5.3.2. Economic Factors
5.3.3. Social Factors
5.3.4. Technological Factors
5.3.5. Environmental Factors
5.3.6. Legal Factors
5.4. Key Market Trends
5.4.1. Demand Side Trends
5.4.2. Supply Side Trends
5.5. Value Chain Analysis
5.6. Technology Analysis
5.6.1. Research and development in the global market
5.6.2. Patent Analysis
5.6.3. Emerging technologies and their potential disruption to the market
5.7. Consumer Behaviour Analysis
5.7.1. Consumer Preferences and Expectations
5.7.2. Factors Influencing Consumer Buying Decisions
5.7.2.1. North America
5.7.2.2. Europe
5.7.2.3. Asia Pacific
5.7.2.4. Latin America
5.7.2.5. Middle East and Africa
5.7.3. Consumer Pain Points
5.8. Analysis and Recommendations
5.9. Adjacent Market Analysis
6. Market Positioning of Key Players, 2022
6.1. Company market share of key players, 2022
6.2. Competitive Benchmarking
6.3. Market Positioning of Key Vendors
6.4. Geographical Presence Analysis
6.5. Major Strategies Adopted by Key Players
6.5.1. Key Strategies Analysis
6.5.2. Mergers and Acquisitions
6.5.3. Partnerships
6.5.4. Product Launch
6.5.5. Geographical Expansion
6.5.6. Others
7. Impact Analysis of COVID 19 and Russia – Ukraine War on Construction Stones Market
7.1. Ukraine-Russia War Impact
7.1.1. Uncertainty and Economic Instability
7.1.2. Supply chain disruptions
7.1.3. Regional market shifts
7.1.4. Shift in government priorities
7.2. COVID-19 Impact Analysis
7.2.1. Supply Chain Disruptions
7.2.2. Demand Fluctuations
7.2.3. Shift in Product Mix
7.2.4. Reduced Industrial Activity
7.2.5. Regional Impact Analysis
7.2.5.1. North America
7.2.5.2. Europe
7.2.5.3. Asia Pacific
7.2.5.4. Latin America
7.2.5.5. Middle East and Africa
8. Global Construction Stones Market, By Type of Stone
8.1. Global Construction Stones Market Overview, by Type of Stone
8.1.1. Global Construction Stones Market Revenue Share, By Type of Stone, 2022 Vs 2030 (in %)
8.2. Granite
8.2.1. Global Construction Stones Market, By Granite, By Region, 2017-2030 (US$ Mn)
8.2.2. Market Dynamics for Granite
8.2.2.1. Drivers
8.2.2.2. Restraints
8.2.2.3. Opportunities
8.2.2.4. Trends
8.3. Marble
8.3.1. Global Construction Stones Market, By Marble, By Region, 2017-2030 (US$ Mn)
8.3.2. Market Dynamics for Marble
8.3.2.1. Drivers
8.3.2.2. Restraints
8.3.2.3. Opportunities
8.3.2.4. Trends
8.4. Limestone
8.4.1. Global Construction Stones Market, By Limestone, By Region, 2017-2030 (US$ Mn)
8.4.2. Market Dynamics for Limestone
8.4.2.1. Drivers
8.4.2.2. Restraints
8.4.2.3. Opportunities
8.4.2.4. Trends
8.5. Sandstone
8.5.1. Global Construction Stones Market, By Sandstone, By Region, 2017-2030 (US$ Mn)
8.5.2. Market Dynamics for Sandstone
8.5.2.1. Drivers
8.5.2.2. Restraints
8.5.2.3. Opportunities
8.5.2.4. Trends
8.6. Slate
8.6.1. Global Construction Stones Market, By Slate, By Region, 2017-2030 (US$ Mn)
8.6.2. Market Dynamics for Slate
8.6.2.1. Drivers
8.6.2.2. Restraints
8.6.2.3. Opportunities
8.6.2.4. Trends
8.7. Travertine
8.7.1. Global Construction Stones Market, By Travertine, By Region, 2017-2030 (US$ Mn)
8.7.2. Market Dynamics for Travertine
8.7.2.1. Drivers
8.7.2.2. Restraints
8.7.2.3. Opportunities
8.7.2.4. Trends
9. Global Construction Stones Market, By End-Use Applications
9.1. Global Construction Stones Market Overview, by End-Use Applications
9.1.1. Global Construction Stones Market Revenue Share, By End-Use Applications, 2022 Vs 2030 (in %)
9.2. Residential Construction
9.2.1. Global Construction Stones Market, By Residential Construction, By Region, 2017-2030 (US$ Mn)
9.2.2. Market Dynamics for Residential Construction
9.2.2.1. Drivers
9.2.2.2. Restraints
9.2.2.3. Opportunities
9.2.2.4. Trends
9.3. Commercial Construction
9.3.1. Global Construction Stones Market, By Commercial Construction, By Region, 2017-2030 (US$ Mn)
9.3.2. Market Dynamics for Commercial Construction
9.3.2.1. Drivers
9.3.2.2. Restraints
9.3.2.3. Opportunities
9.3.2.4. Trends
9.4. Monuments and Memorials
9.4.1. Global Construction Stones Market, By Monuments and Memorials, By Region, 2017-2030 (US$ Mn)
9.4.2. Market Dynamics for Monuments and Memorials
9.4.2.1. Drivers
9.4.2.2. Restraints
9.4.2.3. Opportunities
9.4.2.4. Trends
9.5. Landscaping
9.5.1. Global Construction Stones Market, By Landscaping, By Region, 2017-2030 (US$ Mn)
9.5.2. Market Dynamics for Landscaping
9.5.2.1. Drivers
9.5.2.2. Restraints
9.5.2.3. Opportunities
9.5.2.4. Trends
9.6. Infrastructure Projects
9.6.1. Global Construction Stones Market, By Infrastructure Projects, By Region, 2017-2030 (US$ Mn)
9.6.2. Market Dynamics for Infrastructure Projects
9.6.2.1. Drivers
9.6.2.2. Restraints
9.6.2.3. Opportunities
9.6.2.4. Trends
10. Global Construction Stones Market, By Product Forms
10.1. Global Construction Stones Market Overview, by Product Forms
10.1.1. Global Construction Stones Market Revenue Share, By Product Forms, 2022 Vs 2030 (in %)
10.2. Blocks
10.2.1. Global Construction Stones Market, By Blocks, By Region, 2017-2030 (US$ Mn)
10.2.2. Market Dynamics for Blocks
10.2.2.1. Drivers
10.2.2.2. Restraints
10.2.2.3. Opportunities
10.2.2.4. Trends
10.3. Slabs
10.3.1. Global Construction Stones Market, By Slabs, By Region, 2017-2030 (US$ Mn)
10.3.2. Market Dynamics for Slabs
10.3.2.1. Drivers
10.3.2.2. Restraints
10.3.2.3. Opportunities
10.3.2.4. Trends
10.4. Tiles
10.4.1. Global Construction Stones Market, By Tiles, By Region, 2017-2030 (US$ Mn)
10.4.2. Market Dynamics for Tiles
10.4.2.1. Drivers
10.4.2.2. Restraints
10.4.2.3. Opportunities
10.4.2.4. Trends
10.5. Cobbles and Pebbles
10.5.1. Global Construction Stones Market, By Cobbles and Pebbles, By Region, 2017-2030 (US$ Mn)
10.5.2. Market Dynamics for Cobbles and Pebbles
10.5.2.1. Drivers
10.5.2.2. Restraints
10.5.2.3. Opportunities
10.5.2.4. Trends
11. Global Construction Stones Market, By Quality and Grade
11.1. Global Construction Stones Market Overview, by Quality and Grade
11.1.1. Global Construction Stones Market Revenue Share, By Quality and Grade, 2022 Vs 2030 (in %)
11.2. First Grade
11.2.1. Global Construction Stones Market, By First Grade, By Region, 2017-2030 (US$ Mn)
11.2.2. Market Dynamics for First Grade
11.2.2.1. Drivers
11.2.2.2. Restraints
11.2.2.3. Opportunities
11.2.2.4. Trends
11.3. Second Grade
11.3.1. Global Construction Stones Market, By Second Grade, By Region, 2017-2030 (US$ Mn)
11.3.2. Market Dynamics for Second Grade
11.3.2.1. Drivers
11.3.2.2. Restraints
11.3.2.3. Opportunities
11.3.2.4. Trends
11.4. Third Grade
11.4.1. Global Construction Stones Market, By Third Grade, By Region, 2017-2030 (US$ Mn)
11.4.2. Market Dynamics for Third Grade
11.4.2.1. Drivers
11.4.2.2. Restraints
11.4.2.3. Opportunities
11.4.2.4. Trends
12. Global Construction Stones Market, By Size and Dimensions
12.1. Global Construction Stones Market Overview, by Size and Dimensions
12.1.1. Global Construction Stones Market Revenue Share, By Size and Dimensions, 2022 Vs 2030 (in %)
12.2. Standard Sizes
12.2.1. Global Construction Stones Market, By Standard Sizes, By Region, 2017-2030 (US$ Mn)
12.2.2. Market Dynamics for Standard Sizes
12.2.2.1. Drivers
12.2.2.2. Restraints
12.2.2.3. Opportunities
12.2.2.4. Trends
12.3. Custom Sizes
12.3.1. Global Construction Stones Market, By Custom Sizes, By Region, 2017-2030 (US$ Mn)
12.3.2. Market Dynamics for Custom Sizes
12.3.2.1. Drivers
12.3.2.2. Restraints
12.3.2.3. Opportunities
12.3.2.4. Trends
13. Global Construction Stones Market, By Color and Appearance
13.1. Global Construction Stones Market Overview, by Color and Appearance
13.1.1. Global Construction Stones Market Revenue Share, By Color and Appearance, 2022 Vs 2030 (in %)
13.2. White and Light-Colored Stones
13.2.1. Global Construction Stones Market, By White and Light-Colored Stones, By Region, 2017-2030 (US$ Mn)
13.2.2. Market Dynamics for White and Light-Colored Stones
13.2.2.1. Drivers
13.2.2.2. Restraints
13.2.2.3. Opportunities
13.2.2.4. Trends
13.3. Dark-Colored Stones
13.3.1. Global Construction Stones Market, By Dark-Colored Stones, By Region, 2017-2030 (US$ Mn)
13.3.2. Market Dynamics for Dark-Colored Stones
13.3.2.1. Drivers
13.3.2.2. Restraints
13.3.2.3. Opportunities
13.3.2.4. Trends
14. Global Construction Stones Market, By Sustainability and Certification
14.1. Global Construction Stones Market Overview, by Sustainability and Certification
14.1.1. Global Construction Stones Market Revenue Share, By Sustainability and Certification, 2022 Vs 2030 (in %)
14.2. Sustainable Stones
14.2.1. Global Construction Stones Market, By Sustainable Stones, By Region, 2017-2030 (US$ Mn)
14.2.2. Market Dynamics for Sustainable Stones
14.2.2.1. Drivers
14.2.2.2. Restraints
14.2.2.3. Opportunities
14.2.2.4. Trends
14.3. Certified Stones
14.3.1. Global Construction Stones Market, By Certified Stones, By Region, 2017-2030 (US$ Mn)
14.3.2. Market Dynamics for Certified Stones
14.3.2.1. Drivers
14.3.2.2. Restraints
14.3.2.3. Opportunities
14.3.2.4. Trends
15. Global Construction Stones Market, By Installation and Maintenance Services
15.1. Global Construction Stones Market Overview, by Installation and Maintenance Services
15.1.1. Global Construction Stones Market Revenue Share, By Installation and Maintenance Services, 2022 Vs 2030 (in %)
15.2. Stones with Installation Services
15.2.1. Global Construction Stones Market, By Stones with Installation Services, By Region, 2017-2030 (US$ Mn)
15.2.2. Market Dynamics for Stones with Installation Services
15.2.2.1. Drivers
15.2.2.2. Restraints
15.2.2.3. Opportunities
15.2.2.4. Trends
15.3. Maintenance Services
15.3.1. Global Construction Stones Market, By Maintenance Services, By Region, 2017-2030 (US$ Mn)
15.3.2. Market Dynamics for Maintenance Services
15.3.2.1. Drivers
15.3.2.2. Restraints
15.3.2.3. Opportunities
15.3.2.4. Trends
16. Global Construction Stones Market, By Region
16.1. Global Construction Stones Market Overview, by Region
16.1.1. Global Construction Stones Market, By Region, 2022 vs 2030 (in%)
16.2. Type of Stone
16.2.1. Global Construction Stones Market, By Type of Stone, 2017-2030 (US$ Mn)
16.3. End-Use Applications
16.3.1. Global Construction Stones Market, By End-Use Applications, 2017-2030 (US$ Mn)
16.4. Product Forms
16.4.1. Global Construction Stones Market, By Product Forms, 2017-2030 (US$ Mn)
16.5. Quality and Grade
16.5.1. Global Construction Stones Market, By Quality and Grade, 2017-2030 (US$ Mn)
16.6. Size and Dimensions
16.6.1. Global Construction Stones Market, By Size and Dimensions, 2017-2030 (US$ Mn)
16.7. Color and Appearance
16.7.1. Global Construction Stones Market, By Color and Appearance, 2017-2030 (US$ Mn)
16.8. Sustainability and Certification
16.8.1. Global Construction Stones Market, By Sustainability and Certification, 2017-2030 (US$ Mn)
16.9. Installation and Maintenance Services
16.9.1. Global Construction Stones Market, By Installation and Maintenance Services, 2017-2030 (US$ Mn)
17. North America Construction Stones Market Analysis
17.1. Overview
17.1.1. Market Dynamics for North America
17.1.1.1. Drivers
17.1.1.2. Restraints
17.1.1.3. Opportunities
17.1.1.4. Trends
17.2. North America Construction Stones Market, by Type of Stone, 2017-2030(US$ Mn)
17.2.1. Overview
17.2.2. SRC Analysis
17.3. North America Construction Stones Market, by End-Use Applications, 2017-2030(US$ Mn)
17.3.1. Overview
17.3.2. SRC Analysis
17.4. North America Construction Stones Market, by Product Forms, 2017-2030(US$ Mn)
17.4.1. Overview
17.4.2. SRC Analysis
17.5. North America Construction Stones Market, by Quality and Grade, 2017-2030(US$ Mn)
17.5.1. Overview
17.5.2. SRC Analysis
17.6. North America Construction Stones Market, by Size and Dimensions, 2017-2030(US$ Mn)
17.6.1. Overview
17.6.2. SRC Analysis
17.7. North America Construction Stones Market, by Color and Appearance, 2017-2030(US$ Mn)
17.7.1. Overview
17.7.2. SRC Analysis
17.8. North America Construction Stones Market, by Sustainability and Certification, 2017-2030(US$ Mn)
17.8.1. Overview
17.8.2. SRC Analysis
17.9. North America Construction Stones Market, by Installation and Maintenance Services, 2017-2030(US$ Mn)
17.9.1. Overview
17.9.2. SRC Analysis
17.10. North America Construction Stones Market, by Country, 2017-2030 (US$ Mn)
17.10.1. North America Construction Stones Market, by Country, 2022 Vs 2030 (in%)
17.10.2. U.S.
17.10.3. Canada
17.10.4. Mexico
18. Europe Construction Stones Market Analysis
18.1. Overview
18.1.1. Market Dynamics for Europe
18.1.1.1. Drivers
18.1.1.2. Restraints
18.1.1.3. Opportunities
18.1.1.4. Trends
18.2. Europe Construction Stones Market, by Type of Stone, 2017-2030(US$ Mn)
18.2.1. Overview
18.2.2. SRC Analysis
18.3. Europe Construction Stones Market, by End-Use Applications, 2017-2030(US$ Mn)
18.3.1. Overview
18.3.2. SRC Analysis
18.4. Europe Construction Stones Market, by Product Forms, 2017-2030(US$ Mn)
18.4.1. Overview
18.4.2. SRC Analysis
18.5. Europe Construction Stones Market, by Quality and Grade, 2017-2030(US$ Mn)
18.5.1. Overview
18.5.2. SRC Analysis
18.6. Europe Construction Stones Market, by Size and Dimensions, 2017-2030(US$ Mn)
18.6.1. Overview
18.6.2. SRC Analysis
18.7. Europe Construction Stones Market, by Color and Appearance, 2017-2030(US$ Mn)
18.7.1. Overview
18.7.2. SRC Analysis
18.8. Europe Construction Stones Market, by Sustainability and Certification, 2017-2030(US$ Mn)
18.8.1. Overview
18.8.2. SRC Analysis
18.9. Europe Construction Stones Market, by Installation and Maintenance Services, 2017-2030(US$ Mn)
18.9.1. Overview
18.9.2. SRC Analysis
18.10. Europe Construction Stones Market, by Country, 2017-2030 (US$ Mn)
18.10.1. Europe Construction Stones Market, by Country, 2022 Vs 2030 (in%)
18.10.2. UK
18.10.3. France
18.10.4. Germany
18.10.5. Italy
18.10.6. Spain
18.10.7. Benelux
18.10.8. Russia
18.10.9. Rest of Europe
19. Asia Pacific Construction Stones Market Analysis
19.1. Overview
19.1.1. Market Dynamics for Asia Pacific
19.1.1.1. Drivers
19.1.1.2. Restraints
19.1.1.3. Opportunities
19.1.1.4. Trends
19.2. Asia Pacific Construction Stones Market, by Type of Stone, 2017-2030(US$ Mn)
19.2.1. Overview
19.2.2. SRC Analysis
19.3. Asia Pacific Construction Stones Market, by End-Use Applications, 2017-2030(US$ Mn)
19.3.1. Overview
19.3.2. SRC Analysis
19.4. Asia Pacific Construction Stones Market, by Product Forms, 2017-2030(US$ Mn)
19.4.1. Overview
19.4.2. SRC Analysis
19.5. Asia Pacific Construction Stones Market, by Quality and Grade, 2017-2030(US$ Mn)
19.5.1. Overview
19.5.2. SRC Analysis
19.6. Asia Pacific Construction Stones Market, by Size and Dimensions, 2017-2030(US$ Mn)
19.6.1. Overview
19.6.2. SRC Analysis
19.7. Asia Pacific Construction Stones Market, by Color and Appearance, 2017-2030(US$ Mn)
19.7.1. Overview
19.7.2. SRC Analysis
19.8. Asia Pacific Construction Stones Market, by Sustainability and Certification, 2017-2030(US$ Mn)
19.8.1. Overview
19.8.2. SRC Analysis
19.9. Asia Pacific Construction Stones Market, by Installation and Maintenance Services, 2017-2030(US$ Mn)
19.9.1. Overview
19.9.2. SRC Analysis
19.10. Asia Pacific Construction Stones Market, by Country, 2017-2030 (US$ Mn)
19.10.1. Asia Pacific Construction Stones Market, by Country, 2022 Vs 2030 (in%)
19.10.2. China
19.10.3. Japan
19.10.4. India
19.10.5. South Korea
19.10.6. South East Asia
19.10.7. Rest of Asia Pacific
20. Latin America Construction Stones Market Analysis
20.1. Overview
20.1.1. Market Dynamics for Latin America
20.1.1.1. Drivers
20.1.1.2. Restraints
20.1.1.3. Opportunities
20.1.1.4. Trends
20.2. Latin America Construction Stones Market, by Type of Stone, 2017-2030(US$ Mn)
20.2.1. Overview
20.2.2. SRC Analysis
20.3. Latin America Construction Stones Market, by End-Use Applications, 2017-2030(US$ Mn)
20.3.1. Overview
20.3.2. SRC Analysis
20.4. Latin America Construction Stones Market, by Product Forms, 2017-2030(US$ Mn)
20.4.1. Overview
20.4.2. SRC Analysis
20.5. Latin America Construction Stones Market, by Quality and Grade, 2017-2030(US$ Mn)
20.5.1. Overview
20.5.2. SRC Analysis
20.6. Latin America Construction Stones Market, by Size and Dimensions, 2017-2030(US$ Mn)
20.6.1. Overview
20.6.2. SRC Analysis
20.7. Latin America Construction Stones Market, by Color and Appearance, 2017-2030(US$ Mn)
20.7.1. Overview
20.7.2. SRC Analysis
20.8. Latin America Construction Stones Market, by Sustainability and Certification, 2017-2030(US$ Mn)
20.8.1. Overview
20.8.2. SRC Analysis
20.9. Latin America Construction Stones Market, by Installation and Maintenance Services, 2017-2030(US$ Mn)
20.9.1. Overview
20.9.2. SRC Analysis
20.10. Latin America Construction Stones Market, by Country, 2017-2030 (US$ Mn)
20.10.1. Latin America Construction Stones Market, by Country, 2022 Vs 2030 (in%)
20.10.2. Brazil
20.10.3. Argentina
20.10.4. Rest of Latin America
21. Middle East Construction Stones Market Analysis
21.1. Overview
21.1.1. Market Dynamics for Middle East
21.1.1.1. Drivers
21.1.1.2. Restraints
21.1.1.3. Opportunities
21.1.1.4. Trends
21.2. Middle East Construction Stones Market, by Type of Stone, 2017-2030(US$ Mn)
21.2.1. Overview
21.2.2. SRC Analysis
21.3. Middle East Construction Stones Market, by End-Use Applications, 2017-2030(US$ Mn)
21.3.1. Overview
21.3.2. SRC Analysis
21.4. Middle East Construction Stones Market, by Product Forms, 2017-2030(US$ Mn)
21.4.1. Overview
21.4.2. SRC Analysis
21.5. Middle East Construction Stones Market, by Quality and Grade, 2017-2030(US$ Mn)
21.5.1. Overview
21.5.2. SRC Analysis
21.6. Middle East Construction Stones Market, by Size and Dimensions, 2017-2030(US$ Mn)
21.6.1. Overview
21.6.2. SRC Analysis
21.7. Middle East Construction Stones Market, by Color and Appearance, 2017-2030(US$ Mn)
21.7.1. Overview
21.7.2. SRC Analysis
21.8. Middle East Construction Stones Market, by Sustainability and Certification, 2017-2030(US$ Mn)
21.8.1. Overview
21.8.2. SRC Analysis
21.9. Middle East Construction Stones Market, by Installation and Maintenance Services, 2017-2030(US$ Mn)
21.9.1. Overview
21.9.2. SRC Analysis
21.10. Middle East Construction Stones Market, by Country, 2017-2030 (US$ Mn)
21.10.1. Middle East Construction Stones Market, by Country, 2022 Vs 2030 (in%)
21.10.2. UAE
21.10.3. Saudi Arabia
21.10.4. Rest of Middle East
22. Africa Construction Stones Market Analysis
22.1. Overview
22.1.1. Market Dynamics for Africa
22.1.1.1. Drivers
22.1.1.2. Restraints
22.1.1.3. Opportunities
22.1.1.4. Trends
22.2. Africa Construction Stones Market, by Type of Stone, 2017-2030(US$ Mn)
22.2.1. Overview
22.2.2. SRC Analysis
22.3. Africa Construction Stones Market, by End-Use Applications, 2017-2030(US$ Mn)
22.3.1. Overview
22.3.2. SRC Analysis
22.4. Africa Construction Stones Market, by Product Forms, 2017-2030(US$ Mn)
22.4.1. Overview
22.4.2. SRC Analysis
22.5. Africa Construction Stones Market, by Quality and Grade, 2017-2030(US$ Mn)
22.5.1. Overview
22.5.2. SRC Analysis
22.6. Africa Construction Stones Market, by Size and Dimensions, 2017-2030(US$ Mn)
22.6.1. Overview
22.6.2. SRC Analysis
22.7. Africa Construction Stones Market, by Color and Appearance, 2017-2030(US$ Mn)
22.7.1. Overview
22.7.2. SRC Analysis
22.8. Africa Construction Stones Market, by Sustainability and Certification, 2017-2030(US$ Mn)
22.8.1. Overview
22.8.2. SRC Analysis
22.9. Africa Construction Stones Market, by Installation and Maintenance Services, 2017-2030(US$ Mn)
22.9.1. Overview
22.9.2. SRC Analysis
22.10. Africa Construction Stones Market, by Country, 2017-2030 (US$ Mn)
22.10.1. Africa Construction Stones Market, by Country, 2022 Vs 2030 (in%)
22.10.2. South Africa
22.10.3. Egypt
22.10.4. Rest of Africa
23. Company Profiles
23.1. JSC Stone & ALPS Stone
23.1.1. Company Overview
23.1.2. Products/Services Portfolio
23.1.3. Geographical Presence
23.1.4. SWOT Analysis
23.1.5. Financial Summary
23.1.5.1. Market Revenue and Net Profit (2019-2022)
23.1.5.2. Business Segment Revenue Analysis
23.1.5.3. Geographical Revenue Analysis
23.2. Levantina y Asociados de Minerales, S.A.
23.3. Benchmark Building Supplies Limited
23.4. Xiamen Yeyang Stone Group
23.5. Precision Countertops, Inc.
23.6. Regatta Universal Exports
23.7. Others
24. Research Methodology
24.1. Research Methodology
24.2. Phase I – Secondary Research
24.3. Phase II – Data Modelling
24.3.1. Company Share Analysis Model
24.3.2. Revenue Based Modelling
24.4. Phase III – Primary Research
24.5. Research Limitations
24.5.1. Assumptions

List of Figures
FIG. 1 Global Construction Stones Market: Research Methodology
FIG. 2 Market Size Estimation – Top Down & Bottom up Approach
FIG. 3 Global Construction Stones Market Segmentation
FIG. 4 Global Construction Stones Market, by Type of Stone, 2022 (US$ Mn)
FIG. 5 Global Construction Stones Market, by End-Use Applications, 2022 (US$ Mn)
FIG. 6 Global Construction Stones Market, by Product Forms, 2022 (US$ Mn)
FIG. 7 Global Construction Stones Market, by Quality and Grade, 2022 (US$ Mn)
FIG. 8 Global Construction Stones Market, by Size and Dimensions, 2022 (US$ Mn)
FIG. 9 Global Construction Stones Market, by Color and Appearance, 2022 (US$ Mn)
FIG. 10 Global Construction Stones Market, by Sustainability and Certification, 2022 (US$ Mn)
FIG. 11 Global Construction Stones Market, by Installation and Maintenance Services, 2022 (US$ Mn)
FIG. 12 Global Construction Stones Market, by Geography, 2022 (US$ Mn)
FIG. 13 Attractive Investment Proposition, by Type of Stone, 2022
FIG. 14 Attractive Investment Proposition, by End-Use Applications, 2022
FIG. 15 Attractive Investment Proposition, by Product Forms, 2022
FIG. 16 Attractive Investment Proposition, by Quality and Grade, 2022
FIG. 17 Attractive Investment Proposition, by Size and Dimensions, 2022
FIG. 18 Attractive Investment Proposition, by Color and Appearance, 2022
FIG. 19 Attractive Investment Proposition, by Sustainability and Certification, 2022
FIG. 20 Attractive Investment Proposition, by Installation and Maintenance Services, 2022
FIG. 21 Attractive Investment Proposition, by Geography, 2022
FIG. 22 Global Market Share Analysis of Key Construction Stones Market Manufacturers, 2022
FIG. 23 Global Market Positioning of Key Construction Stones Market Manufacturers, 2022
FIG. 24 Global Construction Stones Market Value Contribution, By Type of Stone, 2022 & 2030 (Value %)
FIG. 25 Global Construction Stones Market, by Granite, Value, 2017-2030 (US$ Mn)
FIG. 26 Global Construction Stones Market, by Marble, Value, 2017-2030 (US$ Mn)
FIG. 27 Global Construction Stones Market, by Limestone, Value, 2017-2030 (US$ Mn)
FIG. 28 Global Construction Stones Market, by Sandstone, Value, 2017-2030 (US$ Mn)
FIG. 29 Global Construction Stones Market, by Slate, Value, 2017-2030 (US$ Mn)
FIG. 30 Global Construction Stones Market, by Travertine, Value, 2017-2030 (US$ Mn)
FIG. 31 Global Construction Stones Market Value Contribution, By End-Use Applications, 2022 & 2030 (Value %)
FIG. 32 Global Construction Stones Market, by Residential Construction, Value, 2017-2030 (US$ Mn)
FIG. 33 Global Construction Stones Market, by Commercial Construction, Value, 2017-2030 (US$ Mn)
FIG. 34 Global Construction Stones Market, by Monuments and Memorials, Value, 2017-2030 (US$ Mn)
FIG. 35 Global Construction Stones Market, by Landscaping, Value, 2017-2030 (US$ Mn)
FIG. 36 Global Construction Stones Market, by Infrastructure Projects, Value, 2017-2030 (US$ Mn)
FIG. 37 Global Construction Stones Market Value Contribution, By Product Forms, 2022 & 2030 (Value %)
FIG. 38 Global Construction Stones Market, by Blocks, Value, 2017-2030 (US$ Mn)
FIG. 39 Global Construction Stones Market, by Slabs, Value, 2017-2030 (US$ Mn)
FIG. 40 Global Construction Stones Market, by Tiles, Value, 2017-2030 (US$ Mn)
FIG. 41 Global Construction Stones Market, by Cobbles and Pebbles, Value, 2017-2030 (US$ Mn)
FIG. 42 Global Construction Stones Market Value Contribution, By Quality and Grade, 2022 & 2030 (Value %)
FIG. 43 Global Construction Stones Market, by First Grade, Value, 2017-2030 (US$ Mn)
FIG. 44 Global Construction Stones Market, by Second Grade, Value, 2017-2030 (US$ Mn)
FIG. 45 Global Construction Stones Market, by Third Grade, Value, 2017-2030 (US$ Mn)
FIG. 46 Global Construction Stones Market Value Contribution, By Size and Dimensions, 2022 & 2030 (Value %)
FIG. 47 Global Construction Stones Market, by Standard Sizes, Value, 2017-2030 (US$ Mn)
FIG. 48 Global Construction Stones Market, by Custom Sizes, Value, 2017-2030 (US$ Mn)
FIG. 49 Global Construction Stones Market Value Contribution, By Color and Appearance, 2022 & 2030 (Value %)
FIG. 50 Global Construction Stones Market, by White and Light-Colored Stones, Value, 2017-2030 (US$ Mn)
FIG. 51 Global Construction Stones Market, by Dark-Colored Stones, Value, 2017-2030 (US$ Mn)
FIG. 52 Global Construction Stones Market Value Contribution, By Sustainability and Certification, 2022 & 2030 (Value %)
FIG. 53 Global Construction Stones Market, by Sustainable Stones, Value, 2017-2030 (US$ Mn)
FIG. 54 Global Construction Stones Market, by Certified Stones, Value, 2017-2030 (US$ Mn)
FIG. 55 Global Construction Stones Market Value Contribution, By Installation and Maintenance Services, 2022 & 2030 (Value %)
FIG. 56 Global Construction Stones Market, by Stones with Installation Services, Value, 2017-2030 (US$ Mn)
FIG. 57 Global Construction Stones Market, by Maintenance Services, Value, 2017-2030 (US$ Mn)
FIG. 58 North America Construction Stones Market, 2017-2030 (US$ Mn)
FIG. 59 U.S. Construction Stones Market, 2017-2030 (US$ Mn)
FIG. 60 Canada Construction Stones Market, 2017-2030 (US$ Mn)
FIG. 61 Mexico Construction Stones Market, 2017-2030 (US$ Mn)
FIG. 62 Europe Construction Stones Market, 2017-2030 (US$ Mn)
FIG. 63 Germany Construction Stones Market, 2017-2030 (US$ Mn)
FIG. 64 France Construction Stones Market, 2017-2030 (US$ Mn)
FIG. 65 U.K. Construction Stones Market, 2017-2030 (US$ Mn)
FIG. 66 Italy Construction Stones Market, 2017-2030 (US$ Mn)
FIG. 67 Spain Construction Stones Market, 2017-2030 (US$ Mn)
FIG. 68 Benelux Construction Stones Market, 2017-2030 (US$ Mn)
FIG. 69 Russia Construction Stones Market, 2017-2030 (US$ Mn)
FIG. 70 Rest of Europe Construction Stones Market, 2017-2030 (US$ Mn)
FIG. 71 Asia Pacific Construction Stones Market, 2017-2030 (US$ Mn)
FIG. 72 China Construction Stones Market, 2017-2030 (US$ Mn)
FIG. 73 Japan Construction Stones Market, 2017-2030 (US$ Mn)
FIG. 74 India Construction Stones Market, 2017-2030 (US$ Mn)
FIG. 75 South Korea Construction Stones Market, 2017-2030 (US$ Mn)
FIG. 76 South-East Asia Construction Stones Market, 2017-2030 (US$ Mn)
FIG. 77 Rest of Asia Pacific Construction Stones Market, 2017-2030 (US$ Mn)
FIG. 78 Latin America Construction Stones Market, 2017-2030 (US$ Mn)
FIG. 79 Brazil Construction Stones Market, 2017-2030 (US$ Mn)
FIG. 80 Argentina Construction Stones Market, 2017-2030 (US$ Mn)
FIG. 81 Rest of Latin America Construction Stones Market, 2017-2030 (US$ Mn)
FIG. 82 Middle East Construction Stones Market, 2017-2030 (US$ Mn)
FIG. 83 UAE Construction Stones Market, 2017-2030 (US$ Mn)
FIG. 84 Saudi Arabia Construction Stones Market, 2017-2030 (US$ Mn)
FIG. 85 Rest of Middle East Construction Stones Market, 2017-2030 (US$ Mn)
FIG. 86 Africa Construction Stones Market, 2017-2030 (US$ Mn)
FIG. 87 South Africa Construction Stones Market, 2017-2030 (US$ Mn)
FIG. 88 Egypt Construction Stones Market, 2017-2030 (US$ Mn)
FIG. 89 Rest of Africa Construction Stones Market, 2017-2030 (US$ Mn)

List of Tables
TABLE 1 Market Snapshot: Global Construction Stones Market
TABLE 2 Global Construction Stones Market: Market Drivers Impact Analysis
TABLE 3 Global Construction Stones Market: Market Restraints Impact Analysis
TABLE 4 Global Construction Stones Market, by Competitive Benchmarking, 2022
TABLE 5 Global Construction Stones Market, by Geographical Presence Analysis, 2022
TABLE 6 Global Construction Stones Market, by Key Strategies Analysis, 2022
TABLE 7 Global Construction Stones Market, by Granite, By Region, 2017-2022 (US$ Mn)
TABLE 8 Global Construction Stones Market, by Granite, By Region, 2023-2030 (US$ Mn)
TABLE 9 Global Construction Stones Market, by Marble, By Region, 2017-2022 (US$ Mn)
TABLE 10 Global Construction Stones Market, by Marble, By Region, 2023-2030 (US$ Mn)
TABLE 11 Global Construction Stones Market, by Limestone, By Region, 2017-2022 (US$ Mn)
TABLE 12 Global Construction Stones Market, by Limestone, By Region, 2023-2030 (US$ Mn)
TABLE 13 Global Construction Stones Market, by Sandstone, By Region, 2017-2022 (US$ Mn)
TABLE 14 Global Construction Stones Market, by Sandstone, By Region, 2023-2030 (US$ Mn)
TABLE 15 Global Construction Stones Market, by Slate, By Region, 2017-2022 (US$ Mn)
TABLE 16 Global Construction Stones Market, by Slate, By Region, 2023-2030 (US$ Mn)
TABLE 17 Global Construction Stones Market, by Travertine, By Region, 2017-2022 (US$ Mn)
TABLE 18 Global Construction Stones Market, by Travertine, By Region, 2023-2030 (US$ Mn)
TABLE 19 Global Construction Stones Market, by Residential Construction, By Region, 2017-2022 (US$ Mn)
TABLE 20 Global Construction Stones Market, by Residential Construction, By Region, 2023-2030 (US$ Mn)
TABLE 21 Global Construction Stones Market, by Commercial Construction, By Region, 2017-2022 (US$ Mn)
TABLE 22 Global Construction Stones Market, by Commercial Construction, By Region, 2023-2030 (US$ Mn)
TABLE 23 Global Construction Stones Market, by Monuments and Memorials, By Region, 2017-2022 (US$ Mn)
TABLE 24 Global Construction Stones Market, by Monuments and Memorials, By Region, 2023-2030 (US$ Mn)
TABLE 25 Global Construction Stones Market, by Landscaping, By Region, 2017-2022 (US$ Mn)
TABLE 26 Global Construction Stones Market, by Landscaping, By Region, 2023-2030 (US$ Mn)
TABLE 27 Global Construction Stones Market, by Infrastructure Projects, By Region, 2017-2022 (US$ Mn)
TABLE 28 Global Construction Stones Market, by Infrastructure Projects, By Region, 2023-2030 (US$ Mn)
TABLE 29 Global Construction Stones Market, by Blocks, By Region, 2017-2022 (US$ Mn)
TABLE 30 Global Construction Stones Market, by Blocks, By Region, 2023-2030 (US$ Mn)
TABLE 31 Global Construction Stones Market, by Slabs, By Region, 2017-2022 (US$ Mn)
TABLE 32 Global Construction Stones Market, by Slabs, By Region, 2023-2030 (US$ Mn)
TABLE 33 Global Construction Stones Market, by Tiles, By Region, 2017-2022 (US$ Mn)
TABLE 34 Global Construction Stones Market, by Tiles, By Region, 2023-2030 (US$ Mn)
TABLE 35 Global Construction Stones Market, by Cobbles and Pebbles, By Region, 2017-2022 (US$ Mn)
TABLE 36 Global Construction Stones Market, by Cobbles and Pebbles, By Region, 2023-2030 (US$ Mn)
TABLE 37 Global Construction Stones Market, by First Grade, By Region, 2017-2022 (US$ Mn)
TABLE 38 Global Construction Stones Market, by First Grade, By Region, 2023-2030 (US$ Mn)
TABLE 39 Global Construction Stones Market, by Second Grade, By Region, 2017-2022 (US$ Mn)
TABLE 40 Global Construction Stones Market, by Second Grade, By Region, 2023-2030 (US$ Mn)
TABLE 41 Global Construction Stones Market, by Third Grade, By Region, 2017-2022 (US$ Mn)
TABLE 42 Global Construction Stones Market, by Third Grade, By Region, 2023-2030 (US$ Mn)
TABLE 43 Global Construction Stones Market, by Standard Sizes, By Region, 2017-2022 (US$ Mn)
TABLE 44 Global Construction Stones Market, by Standard Sizes, By Region, 2023-2030 (US$ Mn)
TABLE 45 Global Construction Stones Market, by Custom Sizes, By Region, 2017-2022 (US$ Mn)
TABLE 46 Global Construction Stones Market, by Custom Sizes, By Region, 2023-2030 (US$ Mn)
TABLE 47 Global Construction Stones Market, by White and Light-Colored Stones, By Region, 2017-2022 (US$ Mn)
TABLE 48 Global Construction Stones Market, by White and Light-Colored Stones, By Region, 2023-2030 (US$ Mn)
TABLE 49 Global Construction Stones Market, by Dark-Colored Stones, By Region, 2017-2022 (US$ Mn)
TABLE 50 Global Construction Stones Market, by Dark-Colored Stones, By Region, 2023-2030 (US$ Mn)
TABLE 51 Global Construction Stones Market, by Sustainable Stones, By Region, 2017-2022 (US$ Mn)
TABLE 52 Global Construction Stones Market, by Sustainable Stones, By Region, 2023-2030 (US$ Mn)
TABLE 53 Global Construction Stones Market, by Certified Stones, By Region, 2017-2022 (US$ Mn)
TABLE 54 Global Construction Stones Market, by Certified Stones, By Region, 2023-2030 (US$ Mn)
TABLE 55 Global Construction Stones Market, by Stones with Installation Services, By Region, 2017-2022 (US$ Mn)
TABLE 56 Global Construction Stones Market, by Stones with Installation Services, By Region, 2023-2030 (US$ Mn)
TABLE 57 Global Construction Stones Market, by Maintenance Services, By Region, 2017-2022 (US$ Mn)
TABLE 58 Global Construction Stones Market, by Maintenance Services, By Region, 2023-2030 (US$ Mn)
TABLE 59 Global Construction Stones Market, by Type of Stone, 2017-2022 (US$ Mn)
TABLE 60 Global Construction Stones Market, by Type of Stone, 2023-2030 (US$ Mn)
TABLE 61 Global Construction Stones Market, by End-Use Applications, 2017-2022 (US$ Mn)
TABLE 62 Global Construction Stones Market, by End-Use Applications, 2023-2030 (US$ Mn)
TABLE 63 Global Construction Stones Market, by Product Forms, 2017-2022 (US$ Mn)
TABLE 64 Global Construction Stones Market, by Product Forms, 2023-2030 (US$ Mn)
TABLE 65 Global Construction Stones Market, by Quality and Grade, 2017-2022 (US$ Mn)
TABLE 66 Global Construction Stones Market, by Quality and Grade, 2023-2030 (US$ Mn)
TABLE 67 Global Construction Stones Market, by Size and Dimensions, 2017-2022 (US$ Mn)
TABLE 68 Global Construction Stones Market, by Size and Dimensions, 2023-2030 (US$ Mn)
TABLE 69 Global Construction Stones Market, by Color and Appearance, 2017-2022 (US$ Mn)
TABLE 70 Global Construction Stones Market, by Color and Appearance, 2023-2030 (US$ Mn)
TABLE 71 Global Construction Stones Market, by Sustainability and Certification, 2017-2022 (US$ Mn)
TABLE 72 Global Construction Stones Market, by Sustainability and Certification, 2023-2030 (US$ Mn)
TABLE 73 Global Construction Stones Market, by Installation and Maintenance Services, 2017-2022 (US$ Mn)
TABLE 74 Global Construction Stones Market, by Installation and Maintenance Services, 2023-2030 (US$ Mn)
TABLE 75 Global Construction Stones Market, by Region, 2017-2022 (US$ Mn)
TABLE 76 Global Construction Stones Market, by Region, 2023-2030 (US$ Mn)
TABLE 77 North America Construction Stones Market, by Type of Stone, 2017-2022 (US$ Mn)
TABLE 78 North America Construction Stones Market, by Type of Stone, 2023-2030 (US$ Mn)
TABLE 79 North America Construction Stones Market, by End-Use Applications, 2017-2022 (US$ Mn)
TABLE 80 North America Construction Stones Market, by End-Use Applications, 2023-2030 (US$ Mn)
TABLE 81 North America Construction Stones Market, by Product Forms, 2017-2022 (US$ Mn)
TABLE 82 North America Construction Stones Market, by Product Forms, 2023-2030 (US$ Mn)
TABLE 83 North America Construction Stones Market, by Quality and Grade, 2017-2022 (US$ Mn)
TABLE 84 North America Construction Stones Market, by Quality and Grade, 2023-2030 (US$ Mn)
TABLE 85 North America Construction Stones Market, by Size and Dimensions, 2017-2022 (US$ Mn)
TABLE 86 North America Construction Stones Market, by Size and Dimensions, 2023-2030 (US$ Mn)
TABLE 87 North America Construction Stones Market, by Color and Appearance, 2017-2022 (US$ Mn)
TABLE 88 North America Construction Stones Market, by Color and Appearance, 2023-2030 (US$ Mn)
TABLE 89 North America Construction Stones Market, by Sustainability and Certification, 2017-2022 (US$ Mn)
TABLE 90 North America Construction Stones Market, by Sustainability and Certification, 2023-2030 (US$ Mn)
TABLE 91 North America Construction Stones Market, by Installation and Maintenance Services, 2017-2022 (US$ Mn)
TABLE 92 North America Construction Stones Market, by Installation and Maintenance Services, 2023-2030 (US$ Mn)
TABLE 93 North America Construction Stones Market, by Country, 2017-2022 (US$ Mn)
TABLE 94 North America Construction Stones Market, by Country, 2023-2030 (US$ Mn)
TABLE 95 United States Construction Stones Market, by Type of Stone, 2017-2022 (US$ Mn)
TABLE 96 United States Construction Stones Market, by Type of Stone, 2023-2030 (US$ Mn)
TABLE 97 United States Construction Stones Market, by End-Use Applications, 2017-2022 (US$ Mn)
TABLE 98 United States Construction Stones Market, by End-Use Applications, 2023-2030 (US$ Mn)
TABLE 99 United States Construction Stones Market, by Product Forms, 2017-2022 (US$ Mn)
TABLE 100 United States Construction Stones Market, by Product Forms, 2023-2030 (US$ Mn)
TABLE 101 United States Construction Stones Market, by Quality and Grade, 2017-2022 (US$ Mn)
TABLE 102 United States Construction Stones Market, by Quality and Grade, 2023-2030 (US$ Mn)
TABLE 103 United States Construction Stones Market, by Size and Dimensions, 2017-2022 (US$ Mn)
TABLE 104 United States Construction Stones Market, by Size and Dimensions, 2023-2030 (US$ Mn)
TABLE 105 United States Construction Stones Market, by Color and Appearance, 2017-2022 (US$ Mn)
TABLE 106 United States Construction Stones Market, by Color and Appearance, 2023-2030 (US$ Mn)
TABLE 107 United States Construction Stones Market, by Sustainability and Certification, 2017-2022 (US$ Mn)
TABLE 108 United States Construction Stones Market, by Sustainability and Certification, 2023-2030 (US$ Mn)
TABLE 109 United States Construction Stones Market, by Installation and Maintenance Services, 2017-2022 (US$ Mn)
TABLE 110 United States Construction Stones Market, by Installation and Maintenance Services, 2023-2030 (US$ Mn)
TABLE 111 Canada Construction Stones Market, by Type of Stone, 2017-2022 (US$ Mn)
TABLE 112 Canada Construction Stones Market, by Type of Stone, 2023-2030 (US$ Mn)
TABLE 113 Canada Construction Stones Market, by End-Use Applications, 2017-2022 (US$ Mn)
TABLE 114 Canada Construction Stones Market, by End-Use Applications, 2023-2030 (US$ Mn)
TABLE 115 Canada Construction Stones Market, by Product Forms, 2017-2022 (US$ Mn)
TABLE 116 Canada Construction Stones Market, by Product Forms, 2023-2030 (US$ Mn)
TABLE 117 Canada Construction Stones Market, by Quality and Grade, 2017-2022 (US$ Mn)
TABLE 118 Canada Construction Stones Market, by Quality and Grade, 2023-2030 (US$ Mn)
TABLE 119 Canada Construction Stones Market, by Size and Dimensions, 2017-2022 (US$ Mn)
TABLE 120 Canada Construction Stones Market, by Size and Dimensions, 2023-2030 (US$ Mn)
TABLE 121 Canada Construction Stones Market, by Color and Appearance, 2017-2022 (US$ Mn)
TABLE 122 Canada Construction Stones Market, by Color and Appearance, 2023-2030 (US$ Mn)
TABLE 123 Canada Construction Stones Market, by Sustainability and Certification, 2017-2022 (US$ Mn)
TABLE 124 Canada Construction Stones Market, by Sustainability and Certification, 2023-2030 (US$ Mn)
TABLE 125 Canada Construction Stones Market, by Installation and Maintenance Services, 2017-2022 (US$ Mn)
TABLE 126 Canada Construction Stones Market, by Installation and Maintenance Services, 2023-2030 (US$ Mn)
TABLE 127 Mexico Construction Stones Market, by Type of Stone, 2017-2022 (US$ Mn)
TABLE 128 Mexico Construction Stones Market, by Type of Stone, 2023-2030 (US$ Mn)
TABLE 129 Mexico Construction Stones Market, by End-Use Applications, 2017-2022 (US$ Mn)
TABLE 130 Mexico Construction Stones Market, by End-Use Applications, 2023-2030 (US$ Mn)
TABLE 131 Mexico Construction Stones Market, by Product Forms, 2017-2022 (US$ Mn)
TABLE 132 Mexico Construction Stones Market, by Product Forms, 2023-2030 (US$ Mn)
TABLE 133 Mexico Construction Stones Market, by Quality and Grade, 2017-2022 (US$ Mn)
TABLE 134 Mexico Construction Stones Market, by Quality and Grade, 2023-2030 (US$ Mn)
TABLE 135 Mexico Construction Stones Market, by Size and Dimensions, 2017-2022 (US$ Mn)
TABLE 136 Mexico Construction Stones Market, by Size and Dimensions, 2023-2030 (US$ Mn)
TABLE 137 Mexico Construction Stones Market, by Color and Appearance, 2017-2022 (US$ Mn)
TABLE 138 Mexico Construction Stones Market, by Color and Appearance, 2023-2030 (US$ Mn)
TABLE 139 Mexico Construction Stones Market, by Sustainability and Certification, 2017-2022 (US$ Mn)
TABLE 140 Mexico Construction Stones Market, by Sustainability and Certification, 2023-2030 (US$ Mn)
TABLE 141 Mexico Construction Stones Market, by Installation and Maintenance Services, 2017-2022 (US$ Mn)
TABLE 142 Mexico Construction Stones Market, by Installation and Maintenance Services, 2023-2030 (US$ Mn)
TABLE 143 Europe Construction Stones Market, by Type of Stone, 2017-2022 (US$ Mn)
TABLE 144 Europe Construction Stones Market, by Type of Stone, 2023-2030 (US$ Mn)
TABLE 145 Europe Construction Stones Market, by End-Use Applications, 2017-2022 (US$ Mn)
TABLE 146 Europe Construction Stones Market, by End-Use Applications, 2023-2030 (US$ Mn)
TABLE 147 Europe Construction Stones Market, by Product Forms, 2017-2022 (US$ Mn)
TABLE 148 Europe Construction Stones Market, by Product Forms, 2023-2030 (US$ Mn)
TABLE 149 Europe Construction Stones Market, by Quality and Grade, 2017-2022 (US$ Mn)
TABLE 150 Europe Construction Stones Market, by Quality and Grade, 2023-2030 (US$ Mn)
TABLE 151 Europe Construction Stones Market, by Size and Dimensions, 2017-2022 (US$ Mn)
TABLE 152 Europe Construction Stones Market, by Size and Dimensions, 2023-2030 (US$ Mn)
TABLE 153 Europe Construction Stones Market, by Color and Appearance, 2017-2022 (US$ Mn)
TABLE 154 Europe Construction Stones Market, by Color and Appearance, 2023-2030 (US$ Mn)
TABLE 155 Europe Construction Stones Market, by Sustainability and Certification, 2017-2022 (US$ Mn)
TABLE 156 Europe Construction Stones Market, by Sustainability and Certification, 2023-2030 (US$ Mn)
TABLE 157 Europe Construction Stones Market, by Installation and Maintenance Services, 2017-2022 (US$ Mn)
TABLE 158 Europe Construction Stones Market, by Installation and Maintenance Services, 2023-2030 (US$ Mn)
TABLE 159 Europe Construction Stones Market, by Country, 2017-2022 (US$ Mn)
TABLE 160 Europe Construction Stones Market, by Country, 2023-2030 (US$ Mn)
TABLE 161 Germany Construction Stones Market, by Type of Stone, 2017-2022 (US$ Mn)
TABLE 162 Germany Construction Stones Market, by Type of Stone, 2023-2030 (US$ Mn)
TABLE 163 Germany Construction Stones Market, by End-Use Applications, 2017-2022 (US$ Mn)
TABLE 164 Germany Construction Stones Market, by End-Use Applications, 2023-2030 (US$ Mn)
TABLE 165 Germany Construction Stones Market, by Product Forms, 2017-2022 (US$ Mn)
TABLE 166 Germany Construction Stones Market, by Product Forms, 2023-2030 (US$ Mn)
TABLE 167 Germany Construction Stones Market, by Quality and Grade, 2017-2022 (US$ Mn)
TABLE 168 Germany Construction Stones Market, by Quality and Grade, 2023-2030 (US$ Mn)
TABLE 169 Germany Construction Stones Market, by Size and Dimensions, 2017-2022 (US$ Mn)
TABLE 170 Germany Construction Stones Market, by Size and Dimensions, 2023-2030 (US$ Mn)
TABLE 171 Germany Construction Stones Market, by Color and Appearance, 2017-2022 (US$ Mn)
TABLE 172 Germany Construction Stones Market, by Color and Appearance, 2023-2030 (US$ Mn)
TABLE 173 Germany Construction Stones Market, by Sustainability and Certification, 2017-2022 (US$ Mn)
TABLE 174 Germany Construction Stones Market, by Sustainability and Certification, 2023-2030 (US$ Mn)
TABLE 175 Germany Construction Stones Market, by Installation and Maintenance Services, 2017-2022 (US$ Mn)
TABLE 176 Germany Construction Stones Market, by Installation and Maintenance Services, 2023-2030 (US$ Mn)
TABLE 177 France Construction Stones Market, by Type of Stone, 2017-2022 (US$ Mn)
TABLE 178 France Construction Stones Market, by Type of Stone, 2023-2030 (US$ Mn)
TABLE 179 France Construction Stones Market, by End-Use Applications, 2017-2022 (US$ Mn)
TABLE 180 France Construction Stones Market, by End-Use Applications, 2023-2030 (US$ Mn)
TABLE 181 France Construction Stones Market, by Product Forms, 2017-2022 (US$ Mn)
TABLE 182 France Construction Stones Market, by Product Forms, 2023-2030 (US$ Mn)
TABLE 183 France Construction Stones Market, by Quality and Grade, 2017-2022 (US$ Mn)
TABLE 184 France Construction Stones Market, by Quality and Grade, 2023-2030 (US$ Mn)
TABLE 185 France Construction Stones Market, by Size and Dimensions, 2017-2022 (US$ Mn)
TABLE 186 France Construction Stones Market, by Size and Dimensions, 2023-2030 (US$ Mn)
TABLE 187 France Construction Stones Market, by Color and Appearance, 2017-2022 (US$ Mn)
TABLE 188 France Construction Stones Market, by Color and Appearance, 2023-2030 (US$ Mn)
TABLE 189 France Construction Stones Market, by Sustainability and Certification, 2017-2022 (US$ Mn)
TABLE 190 France Construction Stones Market, by Sustainability and Certification, 2023-2030 (US$ Mn)
TABLE 191 France Construction Stones Market, by Installation and Maintenance Services, 2017-2022 (US$ Mn)
TABLE 192 France Construction Stones Market, by Installation and Maintenance Services, 2023-2030 (US$ Mn)
TABLE 193 United Kingdom Construction Stones Market, by Type of Stone, 2017-2022 (US$ Mn)
TABLE 194 United Kingdom Construction Stones Market, by Type of Stone, 2023-2030 (US$ Mn)
TABLE 195 United Kingdom Construction Stones Market, by End-Use Applications, 2017-2022 (US$ Mn)
TABLE 196 United Kingdom Construction Stones Market, by End-Use Applications, 2023-2030 (US$ Mn)
TABLE 197 United Kingdom Construction Stones Market, by Product Forms, 2017-2022 (US$ Mn)
TABLE 198 United Kingdom Construction Stones Market, by Product Forms, 2023-2030 (US$ Mn)
TABLE 199 United Kingdom Construction Stones Market, by Quality and Grade, 2017-2022 (US$ Mn)
TABLE 200 United Kingdom Construction Stones Market, by Quality and Grade, 2023-2030 (US$ Mn)
TABLE 201 United Kingdom Construction Stones Market, by Size and Dimensions, 2017-2022 (US$ Mn)
TABLE 202 United Kingdom Construction Stones Market, by Size and Dimensions, 2023-2030 (US$ Mn)
TABLE 203 United Kingdom Construction Stones Market, by Color and Appearance, 2017-2022 (US$ Mn)
TABLE 204 United Kingdom Construction Stones Market, by Color and Appearance, 2023-2030 (US$ Mn)
TABLE 205 United Kingdom Construction Stones Market, by Sustainability and Certification, 2017-2022 (US$ Mn)
TABLE 206 United Kingdom Construction Stones Market, by Sustainability and Certification, 2023-2030 (US$ Mn)
TABLE 207 United Kingdom Construction Stones Market, by Installation and Maintenance Services, 2017-2022 (US$ Mn)
TABLE 208 United Kingdom Construction Stones Market, by Installation and Maintenance Services, 2023-2030 (US$ Mn)
TABLE 209 Italy Construction Stones Market, by Type of Stone, 2017-2022 (US$ Mn)
TABLE 210 Italy Construction Stones Market, by Type of Stone, 2023-2030 (US$ Mn)
TABLE 211 Italy Construction Stones Market, by End-Use Applications, 2017-2022 (US$ Mn)
TABLE 212 Italy Construction Stones Market, by End-Use Applications, 2023-2030 (US$ Mn)
TABLE 213 Italy Construction Stones Market, by Product Forms, 2017-2022 (US$ Mn)
TABLE 214 Italy Construction Stones Market, by Product Forms, 2023-2030 (US$ Mn)
TABLE 215 Italy Construction Stones Market, by Quality and Grade, 2017-2022 (US$ Mn)
TABLE 216 Italy Construction Stones Market, by Quality and Grade, 2023-2030 (US$ Mn)
TABLE 217 Italy Construction Stones Market, by Size and Dimensions, 2017-2022 (US$ Mn)
TABLE 218 Italy Construction Stones Market, by Size and Dimensions, 2023-2030 (US$ Mn)
TABLE 219 Italy Construction Stones Market, by Color and Appearance, 2017-2022 (US$ Mn)
TABLE 220 Italy Construction Stones Market, by Color and Appearance, 2023-2030 (US$ Mn)
TABLE 221 Italy Construction Stones Market, by Sustainability and Certification, 2017-2022 (US$ Mn)
TABLE 222 Italy Construction Stones Market, by Sustainability and Certification, 2023-2030 (US$ Mn)
TABLE 223 Italy Construction Stones Market, by Installation and Maintenance Services, 2017-2022 (US$ Mn)
TABLE 224 Italy Construction Stones Market, by Installation and Maintenance Services, 2023-2030 (US$ Mn)
TABLE 225 Spain Construction Stones Market, by Type of Stone, 2017-2022 (US$ Mn)
TABLE 226 Spain Construction Stones Market, by Type of Stone, 2023-2030 (US$ Mn)
TABLE 227 Spain Construction Stones Market, by End-Use Applications, 2017-2022 (US$ Mn)
TABLE 228 Spain Construction Stones Market, by End-Use Applications, 2023-2030 (US$ Mn)
TABLE 229 Spain Construction Stones Market, by Product Forms, 2017-2022 (US$ Mn)
TABLE 230 Spain Construction Stones Market, by Product Forms, 2023-2030 (US$ Mn)
TABLE 231 Spain Construction Stones Market, by Quality and Grade, 2017-2022 (US$ Mn)
TABLE 232 Spain Construction Stones Market, by Quality and Grade, 2023-2030 (US$ Mn)
TABLE 233 Spain Construction Stones Market, by Size and Dimensions, 2017-2022 (US$ Mn)
TABLE 234 Spain Construction Stones Market, by Size and Dimensions, 2023-2030 (US$ Mn)
TABLE 235 Spain Construction Stones Market, by Color and Appearance, 2017-2022 (US$ Mn)
TABLE 236 Spain Construction Stones Market, by Color and Appearance, 2023-2030 (US$ Mn)
TABLE 237 Spain Construction Stones Market, by Sustainability and Certification, 2017-2022 (US$ Mn)
TABLE 238 Spain Construction Stones Market, by Sustainability and Certification, 2023-2030 (US$ Mn)
TABLE 239 Spain Construction Stones Market, by Installation and Maintenance Services, 2017-2022 (US$ Mn)
TABLE 240 Spain Construction Stones Market, by Installation and Maintenance Services, 2023-2030 (US$ Mn)
TABLE 241 Benelux Construction Stones Market, by Type of Stone, 2017-2022 (US$ Mn)
TABLE 242 Benelux Construction Stones Market, by Type of Stone, 2023-2030 (US$ Mn)
TABLE 243 Benelux Construction Stones Market, by End-Use Applications, 2017-2022 (US$ Mn)
TABLE 244 Benelux Construction Stones Market, by End-Use Applications, 2023-2030 (US$ Mn)
TABLE 245 Benelux Construction Stones Market, by Product Forms, 2017-2022 (US$ Mn)
TABLE 246 Benelux Construction Stones Market, by Product Forms, 2023-2030 (US$ Mn)
TABLE 247 Benelux Construction Stones Market, by Quality and Grade, 2017-2022 (US$ Mn)
TABLE 248 Benelux Construction Stones Market, by Quality and Grade, 2023-2030 (US$ Mn)
TABLE 249 Benelux Construction Stones Market, by Size and Dimensions, 2017-2022 (US$ Mn)
TABLE 250 Benelux Construction Stones Market, by Size and Dimensions, 2023-2030 (US$ Mn)
TABLE 251 Benelux Construction Stones Market, by Color and Appearance, 2017-2022 (US$ Mn)
TABLE 252 Benelux Construction Stones Market, by Color and Appearance, 2023-2030 (US$ Mn)
TABLE 253 Benelux Construction Stones Market, by Sustainability and Certification, 2017-2022 (US$ Mn)
TABLE 254 Benelux Construction Stones Market, by Sustainability and Certification, 2023-2030 (US$ Mn)
TABLE 255 Benelux Construction Stones Market, by Installation and Maintenance Services, 2017-2022 (US$ Mn)
TABLE 256 Benelux Construction Stones Market, by Installation and Maintenance Services, 2023-2030 (US$ Mn)
TABLE 257 Russia Construction Stones Market, by Type of Stone, 2017-2022 (US$ Mn)
TABLE 258 Russia Construction Stones Market, by Type of Stone, 2023-2030 (US$ Mn)
TABLE 259 Russia Construction Stones Market, by End-Use Applications, 2017-2022 (US$ Mn)
TABLE 260 Russia Construction Stones Market, by End-Use Applications, 2023-2030 (US$ Mn)
TABLE 261 Russia Construction Stones Market, by Product Forms, 2017-2022 (US$ Mn)
TABLE 262 Russia Construction Stones Market, by Product Forms, 2023-2030 (US$ Mn)
TABLE 263 Russia Construction Stones Market, by Quality and Grade, 2017-2022 (US$ Mn)
TABLE 264 Russia Construction Stones Market, by Quality and Grade, 2023-2030 (US$ Mn)
TABLE 265 Russia Construction Stones Market, by Size and Dimensions, 2017-2022 (US$ Mn)
TABLE 266 Russia Construction Stones Market, by Size and Dimensions, 2023-2030 (US$ Mn)
TABLE 267 Russia Construction Stones Market, by Color and Appearance, 2017-2022 (US$ Mn)
TABLE 268 Russia Construction Stones Market, by Color and Appearance, 2023-2030 (US$ Mn)
TABLE 269 Russia Construction Stones Market, by Sustainability and Certification, 2017-2022 (US$ Mn)
TABLE 270 Russia Construction Stones Market, by Sustainability and Certification, 2023-2030 (US$ Mn)
TABLE 271 Russia Construction Stones Market, by Installation and Maintenance Services, 2017-2022 (US$ Mn)
TABLE 272 Russia Construction Stones Market, by Installation and Maintenance Services, 2023-2030 (US$ Mn)
TABLE 273 Rest of Europe Construction Stones Market, by Type of Stone, 2017-2022 (US$ Mn)
TABLE 274 Rest of Europe Construction Stones Market, by Type of Stone, 2023-2030 (US$ Mn)
TABLE 275 Rest of Europe Construction Stones Market, by End-Use Applications, 2017-2022 (US$ Mn)
TABLE 276 Rest of Europe Construction Stones Market, by End-Use Applications, 2023-2030 (US$ Mn)
TABLE 277 Rest of Europe Construction Stones Market, by Product Forms, 2017-2022 (US$ Mn)
TABLE 278 Rest of Europe Construction Stones Market, by Product Forms, 2023-2030 (US$ Mn)
TABLE 279 Rest of Europe Construction Stones Market, by Quality and Grade, 2017-2022 (US$ Mn)
TABLE 280 Rest of Europe Construction Stones Market, by Quality and Grade, 2023-2030 (US$ Mn)
TABLE 281 Rest of Europe Construction Stones Market, by Size and Dimensions, 2017-2022 (US$ Mn)
TABLE 282 Rest of Europe Construction Stones Market, by Size and Dimensions, 2023-2030 (US$ Mn)
TABLE 283 Rest of Europe Construction Stones Market, by Color and Appearance, 2017-2022 (US$ Mn)
TABLE 284 Rest of Europe Construction Stones Market, by Color and Appearance, 2023-2030 (US$ Mn)
TABLE 285 Rest of Europe Construction Stones Market, by Sustainability and Certification, 2017-2022 (US$ Mn)
TABLE 286 Rest of Europe Construction Stones Market, by Sustainability and Certification, 2023-2030 (US$ Mn)
TABLE 287 Rest of Europe Construction Stones Market, by Installation and Maintenance Services, 2017-2022 (US$ Mn)
TABLE 288 Rest of Europe Construction Stones Market, by Installation and Maintenance Services, 2023-2030 (US$ Mn)
TABLE 289 Asia Pacific Construction Stones Market, by Type of Stone, 2017-2022 (US$ Mn)
TABLE 290 Asia Pacific Construction Stones Market, by Type of Stone, 2023-2030 (US$ Mn)
TABLE 291 Asia Pacific Construction Stones Market, by End-Use Applications, 2017-2022 (US$ Mn)
TABLE 292 Asia Pacific Construction Stones Market, by End-Use Applications, 2023-2030 (US$ Mn)
TABLE 293 Asia Pacific Construction Stones Market, by Product Forms, 2017-2022 (US$ Mn)
TABLE 294 Asia Pacific Construction Stones Market, by Product Forms, 2023-2030 (US$ Mn)
TABLE 295 Asia Pacific Construction Stones Market, by Quality and Grade, 2017-2022 (US$ Mn)
TABLE 296 Asia Pacific Construction Stones Market, by Quality and Grade, 2023-2030 (US$ Mn)
TABLE 297 Asia Pacific Construction Stones Market, by Size and Dimensions, 2017-2022 (US$ Mn)
TABLE 298 Asia Pacific Construction Stones Market, by Size and Dimensions, 2023-2030 (US$ Mn)
TABLE 299 Asia Pacific Construction Stones Market, by Color and Appearance, 2017-2022 (US$ Mn)
TABLE 300 Asia Pacific Construction Stones Market, by Color and Appearance, 2023-2030 (US$ Mn)
TABLE 301 Asia Pacific Construction Stones Market, by Sustainability and Certification, 2017-2022 (US$ Mn)
TABLE 302 Asia Pacific Construction Stones Market, by Sustainability and Certification, 2023-2030 (US$ Mn)
TABLE 303 Asia Pacific Construction Stones Market, by Installation and Maintenance Services, 2017-2022 (US$ Mn)
TABLE 304 Asia Pacific Construction Stones Market, by Installation and Maintenance Services, 2023-2030 (US$ Mn)
TABLE 305 China Construction Stones Market, by Type of Stone, 2017-2022 (US$ Mn)
TABLE 306 China Construction Stones Market, by Type of Stone, 2023-2030 (US$ Mn)
TABLE 307 China Construction Stones Market, by End-Use Applications, 2017-2022 (US$ Mn)
TABLE 308 China Construction Stones Market, by End-Use Applications, 2023-2030 (US$ Mn)
TABLE 309 China Construction Stones Market, by Product Forms, 2017-2022 (US$ Mn)
TABLE 310 China Construction Stones Market, by Product Forms, 2023-2030 (US$ Mn)
TABLE 311 China Construction Stones Market, by Quality and Grade, 2017-2022 (US$ Mn)
TABLE 312 China Construction Stones Market, by Quality and Grade, 2023-2030 (US$ Mn)
TABLE 313 China Construction Stones Market, by Size and Dimensions, 2017-2022 (US$ Mn)
TABLE 314 China Construction Stones Market, by Size and Dimensions, 2023-2030 (US$ Mn)
TABLE 315 China Construction Stones Market, by Color and Appearance, 2017-2022 (US$ Mn)
TABLE 316 China Construction Stones Market, by Color and Appearance, 2023-2030 (US$ Mn)
TABLE 317 China Construction Stones Market, by Sustainability and Certification, 2017-2022 (US$ Mn)
TABLE 318 China Construction Stones Market, by Sustainability and Certification, 2023-2030 (US$ Mn)
TABLE 319 China Construction Stones Market, by Installation and Maintenance Services, 2017-2022 (US$ Mn)
TABLE 320 China Construction Stones Market, by Installation and Maintenance Services, 2023-2030 (US$ Mn)
TABLE 321 Japan Construction Stones Market, by Type of Stone, 2017-2022 (US$ Mn)
TABLE 322 Japan Construction Stones Market, by Type of Stone, 2023-2030 (US$ Mn)
TABLE 323 Japan Construction Stones Market, by End-Use Applications, 2017-2022 (US$ Mn)
TABLE 324 Japan Construction Stones Market, by End-Use Applications, 2023-2030 (US$ Mn)
TABLE 325 Japan Construction Stones Market, by Product Forms, 2017-2022 (US$ Mn)
TABLE 326 Japan Construction Stones Market, by Product Forms, 2023-2030 (US$ Mn)
TABLE 327 Japan Construction Stones Market, by Quality and Grade, 2017-2022 (US$ Mn)
TABLE 328 Japan Construction Stones Market, by Quality and Grade, 2023-2030 (US$ Mn)
TABLE 329 Japan Construction Stones Market, by Size and Dimensions, 2017-2022 (US$ Mn)
TABLE 330 Japan Construction Stones Market, by Size and Dimensions, 2023-2030 (US$ Mn)
TABLE 331 Japan Construction Stones Market, by Color and Appearance, 2017-2022 (US$ Mn)
TABLE 332 Japan Construction Stones Market, by Color and Appearance, 2023-2030 (US$ Mn)
TABLE 333 Japan Construction Stones Market, by Sustainability and Certification, 2017-2022 (US$ Mn)
TABLE 334 Japan Construction Stones Market, by Sustainability and Certification, 2023-2030 (US$ Mn)
TABLE 335 Japan Construction Stones Market, by Installation and Maintenance Services, 2017-2022 (US$ Mn)
TABLE 336 Japan Construction Stones Market, by Installation and Maintenance Services, 2023-2030 (US$ Mn)
TABLE 337 India Construction Stones Market, by Type of Stone, 2017-2022 (US$ Mn)
TABLE 338 India Construction Stones Market, by Type of Stone, 2023-2030 (US$ Mn)
TABLE 339 India Construction Stones Market, by End-Use Applications, 2017-2022 (US$ Mn)
TABLE 340 India Construction Stones Market, by End-Use Applications, 2023-2030 (US$ Mn)
TABLE 341 India Construction Stones Market, by Product Forms, 2017-2022 (US$ Mn)
TABLE 342 India Construction Stones Market, by Product Forms, 2023-2030 (US$ Mn)
TABLE 343 India Construction Stones Market, by Quality and Grade, 2017-2022 (US$ Mn)
TABLE 344 India Construction Stones Market, by Quality and Grade, 2023-2030 (US$ Mn)
TABLE 345 India Construction Stones Market, by Size and Dimensions, 2017-2022 (US$ Mn)
TABLE 346 India Construction Stones Market, by Size and Dimensions, 2023-2030 (US$ Mn)
TABLE 347 India Construction Stones Market, by Color and Appearance, 2017-2022 (US$ Mn)
TABLE 348 India Construction Stones Market, by Color and Appearance, 2023-2030 (US$ Mn)
TABLE 349 India Construction Stones Market, by Sustainability and Certification, 2017-2022 (US$ Mn)
TABLE 350 India Construction Stones Market, by Sustainability and Certification, 2023-2030 (US$ Mn)
TABLE 351 India Construction Stones Market, by Installation and Maintenance Services, 2017-2022 (US$ Mn)
TABLE 352 India Construction Stones Market, by Installation and Maintenance Services, 2023-2030 (US$ Mn)
TABLE 353 South Korea Construction Stones Market, by Type of Stone, 2017-2022 (US$ Mn)
TABLE 354 South Korea Construction Stones Market, by Type of Stone, 2023-2030 (US$ Mn)
TABLE 355 South Korea Construction Stones Market, by End-Use Applications, 2017-2022 (US$ Mn)
TABLE 356 South Korea Construction Stones Market, by End-Use Applications, 2023-2030 (US$ Mn)
TABLE 357 South Korea Construction Stones Market, by Product Forms, 2017-2022 (US$ Mn)
TABLE 358 South Korea Construction Stones Market, by Product Forms, 2023-2030 (US$ Mn)
TABLE 359 South Korea Construction Stones Market, by Quality and Grade, 2017-2022 (US$ Mn)
TABLE 360 South Korea Construction Stones Market, by Quality and Grade, 2023-2030 (US$ Mn)
TABLE 361 South Korea Construction Stones Market, by Size and Dimensions, 2017-2022 (US$ Mn)
TABLE 362 South Korea Construction Stones Market, by Size and Dimensions, 2023-2030 (US$ Mn)
TABLE 363 South Korea Construction Stones Market, by Color and Appearance, 2017-2022 (US$ Mn)
TABLE 364 South Korea Construction Stones Market, by Color and Appearance, 2023-2030 (US$ Mn)
TABLE 365 South Korea Construction Stones Market, by Sustainability and Certification, 2017-2022 (US$ Mn)
TABLE 366 South Korea Construction Stones Market, by Sustainability and Certification, 2023-2030 (US$ Mn)
TABLE 367 South Korea Construction Stones Market, by Installation and Maintenance Services, 2017-2022 (US$ Mn)
TABLE 368 South Korea Construction Stones Market, by Installation and Maintenance Services, 2023-2030 (US$ Mn)
TABLE 369 South-East Asia Construction Stones Market, by Type of Stone, 2017-2022 (US$ Mn)
TABLE 370 South-East Asia Construction Stones Market, by Type of Stone, 2023-2030 (US$ Mn)
TABLE 371 South-East Asia Construction Stones Market, by End-Use Applications, 2017-2022 (US$ Mn)
TABLE 372 South-East Asia Construction Stones Market, by End-Use Applications, 2023-2030 (US$ Mn)
TABLE 373 South-East Asia Construction Stones Market, by Product Forms, 2017-2022 (US$ Mn)
TABLE 374 South-East Asia Construction Stones Market, by Product Forms, 2023-2030 (US$ Mn)
TABLE 375 South-East Asia Construction Stones Market, by Quality and Grade, 2017-2022 (US$ Mn)
TABLE 376 South-East Asia Construction Stones Market, by Quality and Grade, 2023-2030 (US$ Mn)
TABLE 377 South-East Asia Construction Stones Market, by Size and Dimensions, 2017-2022 (US$ Mn)
TABLE 378 South-East Asia Construction Stones Market, by Size and Dimensions, 2023-2030 (US$ Mn)
TABLE 379 South-East Asia Construction Stones Market, by Color and Appearance, 2017-2022 (US$ Mn)
TABLE 380 South-East Asia Construction Stones Market, by Color and Appearance, 2023-2030 (US$ Mn)
TABLE 381 South-East Asia Construction Stones Market, by Sustainability and Certification, 2017-2022 (US$ Mn)
TABLE 382 South-East Asia Construction Stones Market, by Sustainability and Certification, 2023-2030 (US$ Mn)
TABLE 383 South-East Asia Construction Stones Market, by Installation and Maintenance Services, 2017-2022 (US$ Mn)
TABLE 384 South-East Asia Construction Stones Market, by Installation and Maintenance Services, 2023-2030 (US$ Mn)
TABLE 385 Rest of Asia Pacific Construction Stones Market, by Type of Stone, 2017-2022 (US$ Mn)
TABLE 386 Rest of Asia Pacific Construction Stones Market, by Type of Stone, 2023-2030 (US$ Mn)
TABLE 387 Rest of Asia Pacific Construction Stones Market, by End-Use Applications, 2017-2022 (US$ Mn)
TABLE 388 Rest of Asia Pacific Construction Stones Market, by End-Use Applications, 2023-2030 (US$ Mn)
TABLE 389 Rest of Asia Pacific Construction Stones Market, by Product Forms, 2017-2022 (US$ Mn)
TABLE 390 Rest of Asia Pacific Construction Stones Market, by Product Forms, 2023-2030 (US$ Mn)
TABLE 391 Rest of Asia Pacific Construction Stones Market, by Quality and Grade, 2017-2022 (US$ Mn)
TABLE 392 Rest of Asia Pacific Construction Stones Market, by Quality and Grade, 2023-2030 (US$ Mn)
TABLE 393 Rest of Asia Pacific Construction Stones Market, by Size and Dimensions, 2017-2022 (US$ Mn)
TABLE 394 Rest of Asia Pacific Construction Stones Market, by Size and Dimensions, 2023-2030 (US$ Mn)
TABLE 395 Rest of Asia Pacific Construction Stones Market, by Color and Appearance, 2017-2022 (US$ Mn)
TABLE 396 Rest of Asia Pacific Construction Stones Market, by Color and Appearance, 2023-2030 (US$ Mn)
TABLE 397 Rest of Asia Pacific Construction Stones Market, by Sustainability and Certification, 2017-2022 (US$ Mn)
TABLE 398 Rest of Asia Pacific Construction Stones Market, by Sustainability and Certification, 2023-2030 (US$ Mn)
TABLE 399 Rest of Asia Pacific Construction Stones Market, by Installation and Maintenance Services, 2017-2022 (US$ Mn)
TABLE 400 Rest of Asia Pacific Construction Stones Market, by Installation and Maintenance Services, 2023-2030 (US$ Mn)
TABLE 401 Latin America Construction Stones Market, by Type of Stone, 2017-2022 (US$ Mn)
TABLE 402 Latin America Construction Stones Market, by Type of Stone, 2023-2030 (US$ Mn)
TABLE 403 Latin America Construction Stones Market, by End-Use Applications, 2017-2022 (US$ Mn)
TABLE 404 Latin America Construction Stones Market, by End-Use Applications, 2023-2030 (US$ Mn)
TABLE 405 Latin America Construction Stones Market, by Product Forms, 2017-2022 (US$ Mn)
TABLE 406 Latin America Construction Stones Market, by Product Forms, 2023-2030 (US$ Mn)
TABLE 407 Latin America Construction Stones Market, by Quality and Grade, 2017-2022 (US$ Mn)
TABLE 408 Latin America Construction Stones Market, by Quality and Grade, 2023-2030 (US$ Mn)
TABLE 409 Latin America Construction Stones Market, by Size and Dimensions, 2017-2022 (US$ Mn)
TABLE 410 Latin America Construction Stones Market, by Size and Dimensions, 2023-2030 (US$ Mn)
TABLE 411 Latin America Construction Stones Market, by Color and Appearance, 2017-2022 (US$ Mn)
TABLE 412 Latin America Construction Stones Market, by Color and Appearance, 2023-2030 (US$ Mn)
TABLE 413 Latin America Construction Stones Market, by Sustainability and Certification, 2017-2022 (US$ Mn)
TABLE 414 Latin America Construction Stones Market, by Sustainability and Certification, 2023-2030 (US$ Mn)
TABLE 415 Latin America Construction Stones Market, by Installation and Maintenance Services, 2017-2022 (US$ Mn)
TABLE 416 Latin America Construction Stones Market, by Installation and Maintenance Services, 2023-2030 (US$ Mn)
TABLE 417 Brazil Construction Stones Market, by Type of Stone, 2017-2022 (US$ Mn)
TABLE 418 Brazil Construction Stones Market, by Type of Stone, 2023-2030 (US$ Mn)
TABLE 419 Brazil Construction Stones Market, by End-Use Applications, 2017-2022 (US$ Mn)
TABLE 420 Brazil Construction Stones Market, by End-Use Applications, 2023-2030 (US$ Mn)
TABLE 421 Brazil Construction Stones Market, by Product Forms, 2017-2022 (US$ Mn)
TABLE 422 Brazil Construction Stones Market, by Product Forms, 2023-2030 (US$ Mn)
TABLE 423 Brazil Construction Stones Market, by Quality and Grade, 2017-2022 (US$ Mn)
TABLE 424 Brazil Construction Stones Market, by Quality and Grade, 2023-2030 (US$ Mn)
TABLE 425 Brazil Construction Stones Market, by Size and Dimensions, 2017-2022 (US$ Mn)
TABLE 426 Brazil Construction Stones Market, by Size and Dimensions, 2023-2030 (US$ Mn)
TABLE 427 Brazil Construction Stones Market, by Color and Appearance, 2017-2022 (US$ Mn)
TABLE 428 Brazil Construction Stones Market, by Color and Appearance, 2023-2030 (US$ Mn)
TABLE 429 Brazil Construction Stones Market, by Sustainability and Certification, 2017-2022 (US$ Mn)
TABLE 430 Brazil Construction Stones Market, by Sustainability and Certification, 2023-2030 (US$ Mn)
TABLE 431 Brazil Construction Stones Market, by Installation and Maintenance Services, 2017-2022 (US$ Mn)
TABLE 432 Brazil Construction Stones Market, by Installation and Maintenance Services, 2023-2030 (US$ Mn)
TABLE 433 Argentina Construction Stones Market, by Type of Stone, 2017-2022 (US$ Mn)
TABLE 434 Argentina Construction Stones Market, by Type of Stone, 2023-2030 (US$ Mn)
TABLE 435 Argentina Construction Stones Market, by End-Use Applications, 2017-2022 (US$ Mn)
TABLE 436 Argentina Construction Stones Market, by End-Use Applications, 2023-2030 (US$ Mn)
TABLE 437 Argentina Construction Stones Market, by Product Forms, 2017-2022 (US$ Mn)
TABLE 438 Argentina Construction Stones Market, by Product Forms, 2023-2030 (US$ Mn)
TABLE 439 Argentina Construction Stones Market, by Quality and Grade, 2017-2022 (US$ Mn)
TABLE 440 Argentina Construction Stones Market, by Quality and Grade, 2023-2030 (US$ Mn)
TABLE 441 Argentina Construction Stones Market, by Size and Dimensions, 2017-2022 (US$ Mn)
TABLE 442 Argentina Construction Stones Market, by Size and Dimensions, 2023-2030 (US$ Mn)
TABLE 443 Argentina Construction Stones Market, by Color and Appearance, 2017-2022 (US$ Mn)
TABLE 444 Argentina Construction Stones Market, by Color and Appearance, 2023-2030 (US$ Mn)
TABLE 445 Argentina Construction Stones Market, by Sustainability and Certification, 2017-2022 (US$ Mn)
TABLE 446 Argentina Construction Stones Market, by Sustainability and Certification, 2023-2030 (US$ Mn)
TABLE 447 Argentina Construction Stones Market, by Installation and Maintenance Services, 2017-2022 (US$ Mn)
TABLE 448 Argentina Construction Stones Market, by Installation and Maintenance Services, 2023-2030 (US$ Mn)
TABLE 449 Rest of Latin America Construction Stones Market, by Type of Stone, 2017-2022 (US$ Mn)
TABLE 450 Rest of Latin America Construction Stones Market, by Type of Stone, 2023-2030 (US$ Mn)
TABLE 451 Rest of Latin America Construction Stones Market, by End-Use Applications, 2017-2022 (US$ Mn)
TABLE 452 Rest of Latin America Construction Stones Market, by End-Use Applications, 2023-2030 (US$ Mn)
TABLE 453 Rest of Latin America Construction Stones Market, by Product Forms, 2017-2022 (US$ Mn)
TABLE 454 Rest of Latin America Construction Stones Market, by Product Forms, 2023-2030 (US$ Mn)
TABLE 455 Rest of Latin America Construction Stones Market, by Quality and Grade, 2017-2022 (US$ Mn)
TABLE 456 Rest of Latin America Construction Stones Market, by Quality and Grade, 2023-2030 (US$ Mn)
TABLE 457 Rest of Latin America Construction Stones Market, by Size and Dimensions, 2017-2022 (US$ Mn)
TABLE 458 Rest of Latin America Construction Stones Market, by Size and Dimensions, 2023-2030 (US$ Mn)
TABLE 459 Rest of Latin America Construction Stones Market, by Color and Appearance, 2017-2022 (US$ Mn)
TABLE 460 Rest of Latin America Construction Stones Market, by Color and Appearance, 2023-2030 (US$ Mn)
TABLE 461 Rest of Latin America Construction Stones Market, by Sustainability and Certification, 2017-2022 (US$ Mn)
TABLE 462 Rest of Latin America Construction Stones Market, by Sustainability and Certification, 2023-2030 (US$ Mn)
TABLE 463 Rest of Latin America Construction Stones Market, by Installation and Maintenance Services, 2017-2022 (US$ Mn)
TABLE 464 Rest of Latin America Construction Stones Market, by Installation and Maintenance Services, 2023-2030 (US$ Mn)
TABLE 465 Middle East Construction Stones Market, by Type of Stone, 2017-2022 (US$ Mn)
TABLE 466 Middle East Construction Stones Market, by Type of Stone, 2023-2030 (US$ Mn)
TABLE 467 Middle East Construction Stones Market, by End-Use Applications, 2017-2022 (US$ Mn)
TABLE 468 Middle East Construction Stones Market, by End-Use Applications, 2023-2030 (US$ Mn)
TABLE 469 Middle East Construction Stones Market, by Product Forms, 2017-2022 (US$ Mn)
TABLE 470 Middle East Construction Stones Market, by Product Forms, 2023-2030 (US$ Mn)
TABLE 471 Middle East Construction Stones Market, by Quality and Grade, 2017-2022 (US$ Mn)
TABLE 472 Middle East Construction Stones Market, by Quality and Grade, 2023-2030 (US$ Mn)
TABLE 473 Middle East Construction Stones Market, by Size and Dimensions, 2017-2022 (US$ Mn)
TABLE 474 Middle East Construction Stones Market, by Size and Dimensions, 2023-2030 (US$ Mn)
TABLE 475 Middle East Construction Stones Market, by Color and Appearance, 2017-2022 (US$ Mn)
TABLE 476 Middle East Construction Stones Market, by Color and Appearance, 2023-2030 (US$ Mn)
TABLE 477 Middle East Construction Stones Market, by Sustainability and Certification, 2017-2022 (US$ Mn)
TABLE 478 Middle East Construction Stones Market, by Sustainability and Certification, 2023-2030 (US$ Mn)
TABLE 479 Middle East Construction Stones Market, by Installation and Maintenance Services, 2017-2022 (US$ Mn)
TABLE 480 Middle East Construction Stones Market, by Installation and Maintenance Services, 2023-2030 (US$ Mn)
TABLE 481 UAE Construction Stones Market, by Type of Stone, 2017-2022 (US$ Mn)
TABLE 482 UAE Construction Stones Market, by Type of Stone, 2023-2030 (US$ Mn)
TABLE 483 UAE Construction Stones Market, by End-Use Applications, 2017-2022 (US$ Mn)
TABLE 484 UAE Construction Stones Market, by End-Use Applications, 2023-2030 (US$ Mn)
TABLE 485 UAE Construction Stones Market, by Product Forms, 2017-2022 (US$ Mn)
TABLE 486 UAE Construction Stones Market, by Product Forms, 2023-2030 (US$ Mn)
TABLE 487 UAE Construction Stones Market, by Quality and Grade, 2017-2022 (US$ Mn)
TABLE 488 UAE Construction Stones Market, by Quality and Grade, 2023-2030 (US$ Mn)
TABLE 489 UAE Construction Stones Market, by Size and Dimensions, 2017-2022 (US$ Mn)
TABLE 490 UAE Construction Stones Market, by Size and Dimensions, 2023-2030 (US$ Mn)
TABLE 491 UAE Construction Stones Market, by Color and Appearance, 2017-2022 (US$ Mn)
TABLE 492 UAE Construction Stones Market, by Color and Appearance, 2023-2030 (US$ Mn)
TABLE 493 UAE Construction Stones Market, by Sustainability and Certification, 2017-2022 (US$ Mn)
TABLE 494 UAE Construction Stones Market, by Sustainability and Certification, 2023-2030 (US$ Mn)
TABLE 495 UAE Construction Stones Market, by Installation and Maintenance Services, 2017-2022 (US$ Mn)
TABLE 496 UAE Construction Stones Market, by Installation and Maintenance Services, 2023-2030 (US$ Mn)
TABLE 497 Saudi Arabia Construction Stones Market, by Type of Stone, 2017-2022 (US$ Mn)
TABLE 498 Saudi Arabia Construction Stones Market, by Type of Stone, 2023-2030 (US$ Mn)
TABLE 499 Saudi Arabia Construction Stones Market, by End-Use Applications, 2017-2022 (US$ Mn)
TABLE 500 Saudi Arabia Construction Stones Market, by End-Use Applications, 2023-2030 (US$ Mn)
TABLE 501 Saudi Arabia Construction Stones Market, by Product Forms, 2017-2022 (US$ Mn)
TABLE 502 Saudi Arabia Construction Stones Market, by Product Forms, 2023-2030 (US$ Mn)
TABLE 503 Saudi Arabia Construction Stones Market, by Quality and Grade, 2017-2022 (US$ Mn)
TABLE 504 Saudi Arabia Construction Stones Market, by Quality and Grade, 2023-2030 (US$ Mn)
TABLE 505 Saudi Arabia Construction Stones Market, by Size and Dimensions, 2017-2022 (US$ Mn)
TABLE 506 Saudi Arabia Construction Stones Market, by Size and Dimensions, 2023-2030 (US$ Mn)
TABLE 507 Saudi Arabia Construction Stones Market, by Color and Appearance, 2017-2022 (US$ Mn)
TABLE 508 Saudi Arabia Construction Stones Market, by Color and Appearance, 2023-2030 (US$ Mn)
TABLE 509 Saudi Arabia Construction Stones Market, by Sustainability and Certification, 2017-2022 (US$ Mn)
TABLE 510 Saudi Arabia Construction Stones Market, by Sustainability and Certification, 2023-2030 (US$ Mn)
TABLE 511 Saudi Arabia Construction Stones Market, by Installation and Maintenance Services, 2017-2022 (US$ Mn)
TABLE 512 Saudi Arabia Construction Stones Market, by Installation and Maintenance Services, 2023-2030 (US$ Mn)
TABLE 513 Rest of Middle East Construction Stones Market, by Type of Stone, 2017-2022 (US$ Mn)
TABLE 514 Rest of Middle East Construction Stones Market, by Type of Stone, 2023-2030 (US$ Mn)
TABLE 515 Rest of Middle East Construction Stones Market, by End-Use Applications, 2017-2022 (US$ Mn)
TABLE 516 Rest of Middle East Construction Stones Market, by End-Use Applications, 2023-2030 (US$ Mn)
TABLE 517 Rest of Middle East Construction Stones Market, by Product Forms, 2017-2022 (US$ Mn)
TABLE 518 Rest of Middle East Construction Stones Market, by Product Forms, 2023-2030 (US$ Mn)
TABLE 519 Rest of Middle East Construction Stones Market, by Quality and Grade, 2017-2022 (US$ Mn)
TABLE 520 Rest of Middle East Construction Stones Market, by Quality and Grade, 2023-2030 (US$ Mn)
TABLE 521 Rest of Middle East Construction Stones Market, by Size and Dimensions, 2017-2022 (US$ Mn)
TABLE 522 Rest of Middle East Construction Stones Market, by Size and Dimensions, 2023-2030 (US$ Mn)
TABLE 523 Rest of Middle East Construction Stones Market, by Color and Appearance, 2017-2022 (US$ Mn)
TABLE 524 Rest of Middle East Construction Stones Market, by Color and Appearance, 2023-2030 (US$ Mn)
TABLE 525 Rest of Middle East Construction Stones Market, by Sustainability and Certification, 2017-2022 (US$ Mn)
TABLE 526 Rest of Middle East Construction Stones Market, by Sustainability and Certification, 2023-2030 (US$ Mn)
TABLE 527 Rest of Middle East Construction Stones Market, by Installation and Maintenance Services, 2017-2022 (US$ Mn)
TABLE 528 Rest of Middle East Construction Stones Market, by Installation and Maintenance Services, 2023-2030 (US$ Mn)
TABLE 529 Africa Construction Stones Market, by Type of Stone, 2017-2022 (US$ Mn)
TABLE 530 Africa Construction Stones Market, by Type of Stone, 2023-2030 (US$ Mn)
TABLE 531 Africa Construction Stones Market, by End-Use Applications, 2017-2022 (US$ Mn)
TABLE 532 Africa Construction Stones Market, by End-Use Applications, 2023-2030 (US$ Mn)
TABLE 533 Africa Construction Stones Market, by Product Forms, 2017-2022 (US$ Mn)
TABLE 534 Africa Construction Stones Market, by Product Forms, 2023-2030 (US$ Mn)
TABLE 535 Africa Construction Stones Market, by Quality and Grade, 2017-2022 (US$ Mn)
TABLE 536 Africa Construction Stones Market, by Quality and Grade, 2023-2030 (US$ Mn)
TABLE 537 Africa Construction Stones Market, by Size and Dimensions, 2017-2022 (US$ Mn)
TABLE 538 Africa Construction Stones Market, by Size and Dimensions, 2023-2030 (US$ Mn)
TABLE 539 Africa Construction Stones Market, by Color and Appearance, 2017-2022 (US$ Mn)
TABLE 540 Africa Construction Stones Market, by Color and Appearance, 2023-2030 (US$ Mn)
TABLE 541 Africa Construction Stones Market, by Sustainability and Certification, 2017-2022 (US$ Mn)
TABLE 542 Africa Construction Stones Market, by Sustainability and Certification, 2023-2030 (US$ Mn)
TABLE 543 Africa Construction Stones Market, by Installation and Maintenance Services, 2017-2022 (US$ Mn)
TABLE 544 Africa Construction Stones Market, by Installation and Maintenance Services, 2023-2030 (US$ Mn)
TABLE 545 South Africa Construction Stones Market, by Type of Stone, 2017-2022 (US$ Mn)
TABLE 546 South Africa Construction Stones Market, by Type of Stone, 2023-2030 (US$ Mn)
TABLE 547 South Africa Construction Stones Market, by End-Use Applications, 2017-2022 (US$ Mn)
TABLE 548 South Africa Construction Stones Market, by End-Use Applications, 2023-2030 (US$ Mn)
TABLE 549 South Africa Construction Stones Market, by Product Forms, 2017-2022 (US$ Mn)
TABLE 550 South Africa Construction Stones Market, by Product Forms, 2023-2030 (US$ Mn)
TABLE 551 South Africa Construction Stones Market, by Quality and Grade, 2017-2022 (US$ Mn)
TABLE 552 South Africa Construction Stones Market, by Quality and Grade, 2023-2030 (US$ Mn)
TABLE 553 South Africa Construction Stones Market, by Size and Dimensions, 2017-2022 (US$ Mn)
TABLE 554 South Africa Construction Stones Market, by Size and Dimensions, 2023-2030 (US$ Mn)
TABLE 555 South Africa Construction Stones Market, by Color and Appearance, 2017-2022 (US$ Mn)
TABLE 556 South Africa Construction Stones Market, by Color and Appearance, 2023-2030 (US$ Mn)
TABLE 557 South Africa Construction Stones Market, by Sustainability and Certification, 2017-2022 (US$ Mn)
TABLE 558 South Africa Construction Stones Market, by Sustainability and Certification, 2023-2030 (US$ Mn)
TABLE 559 South Africa Construction Stones Market, by Installation and Maintenance Services, 2017-2022 (US$ Mn)
TABLE 560 South Africa Construction Stones Market, by Installation and Maintenance Services, 2023-2030 (US$ Mn)
TABLE 561 Egypt Construction Stones Market, by Type of Stone, 2017-2022 (US$ Mn)
TABLE 562 Egypt Construction Stones Market, by Type of Stone, 2023-2030 (US$ Mn)
TABLE 563 Egypt Construction Stones Market, by End-Use Applications, 2017-2022 (US$ Mn)
TABLE 564 Egypt Construction Stones Market, by End-Use Applications, 2023-2030 (US$ Mn)
TABLE 565 Egypt Construction Stones Market, by Product Forms, 2017-2022 (US$ Mn)
TABLE 566 Egypt Construction Stones Market, by Product Forms, 2023-2030 (US$ Mn)
TABLE 567 Egypt Construction Stones Market, by Quality and Grade, 2017-2022 (US$ Mn)
TABLE 568 Egypt Construction Stones Market, by Quality and Grade, 2023-2030 (US$ Mn)
TABLE 569 Egypt Construction Stones Market, by Size and Dimensions, 2017-2022 (US$ Mn)
TABLE 570 Egypt Construction Stones Market, by Size and Dimensions, 2023-2030 (US$ Mn)
TABLE 571 Egypt Construction Stones Market, by Color and Appearance, 2017-2022 (US$ Mn)
TABLE 572 Egypt Construction Stones Market, by Color and Appearance, 2023-2030 (US$ Mn)
TABLE 573 Egypt Construction Stones Market, by Sustainability and Certification, 2017-2022 (US$ Mn)
TABLE 574 Egypt Construction Stones Market, by Sustainability and Certification, 2023-2030 (US$ Mn)
TABLE 575 Egypt Construction Stones Market, by Installation and Maintenance Services, 2017-2022 (US$ Mn)
TABLE 576 Egypt Construction Stones Market, by Installation and Maintenance Services, 2023-2030 (US$ Mn)
TABLE 577 Rest of Africa Construction Stones Market, by Type of Stone, 2017-2022 (US$ Mn)
TABLE 578 Rest of Africa Construction Stones Market, by Type of Stone, 2023-2030 (US$ Mn)
TABLE 579 Rest of Africa Construction Stones Market, by End-Use Applications, 2017-2022 (US$ Mn)
TABLE 580 Rest of Africa Construction Stones Market, by End-Use Applications, 2023-2030 (US$ Mn)
TABLE 581 Rest of Africa Construction Stones Market, by Product Forms, 2017-2022 (US$ Mn)
TABLE 582 Rest of Africa Construction Stones Market, by Product Forms, 2023-2030 (US$ Mn)
TABLE 583 Rest of Africa Construction Stones Market, by Quality and Grade, 2017-2022 (US$ Mn)
TABLE 584 Rest of Africa Construction Stones Market, by Quality and Grade, 2023-2030 (US$ Mn)
TABLE 585 Rest of Africa Construction Stones Market, by Size and Dimensions, 2017-2022 (US$ Mn)
TABLE 586 Rest of Africa Construction Stones Market, by Size and Dimensions, 2023-2030 (US$ Mn)
TABLE 587 Rest of Africa Construction Stones Market, by Color and Appearance, 2017-2022 (US$ Mn)
TABLE 588 Rest of Africa Construction Stones Market, by Color and Appearance, 2023-2030 (US$ Mn)
TABLE 589 Rest of Africa Construction Stones Market, by Sustainability and Certification, 2017-2022 (US$ Mn)
TABLE 590 Rest of Africa Construction Stones Market, by Sustainability and Certification, 2023-2030 (US$ Mn)
TABLE 591 Rest of Africa Construction Stones Market, by Installation and Maintenance Services, 2017-2022 (US$ Mn)
TABLE 592 Rest of Africa Construction Stones Market, by Installation and Maintenance Services, 2023-2030 (US$ Mn)

How big is the global market for construction stones right now?

In 2022, the market for construction stones was estimated to be worth USD 38451.2 million.

What is the construction stones market’s anticipated growth rate from 2023 to 2030?

The market for construction stones is anticipated to increase at a CAGR of 8.20% from 2023 to 2030, reaching USD 72231.72 million in 2030.

Which segment is leading the market in terms of end-use applications?

Residential construction, by end-use applications, is the notable segment.

The tiles are anticipated to exhibit the highest CAGR during the projection period.

In which region is the market for construction stones expanding?

Who are the key participants in the global market for construction stones?

The top players include JSC Stone & ALPS Stone, Levantina y Asociados de Minerales, S.A., Benchmark Building Supplies Limited, Xiamen Yeyang Stone Group, Precision Countertops, Inc., Regatta Universal Exports, and others.

Asia-Pacific Lyocell Fiber Market

Published:
Report ID: 37592

Asia-Pacific Luxury Vinyl Tiles Flooring Market

Published:
Report ID: 37589

Europe Luxury Vinyl Tiles Flooring Market

Published:
Report ID: 37586

Wood Based Panel Market

Published:
Report ID: 37085

Mobile Crushers Market

Published:
Report ID: 37006

Bamboos Market

Published:
Report ID: 36577

Automotive Webbing Market

Published:
Report ID: 36560

Geosynthetics Market

Published:
Report ID: 36207

Laminated Veneer Lumber Market

Published:
Report ID: 35834

Radiation Shielding Materials Market

Published:
Report ID: 15703

Thermochromic Materials Market

Published:
Report ID: 11162

Smart Mirrors Market

Published:
Report ID: 10279

Purchase Options

$2999
Delivery Format: Excel.
$4999
Designed for the individual purchaser.
$6999
Users located at a single corporate site or regional office.
$7999
Allowed for unlimited sharing globally within one company.
Smallform of Sample request

Have a question?

User Profile

Don’t settle for less – trust Mitul to help you find the best solution.

Report delivery within 24 to 48 hours

– Other Info –

What people say?-

User Review

I am very impressed with the information in this report. The author clearly did their research when they came up with this product and it has already given me a lot of ideas.

Jana Schmidt
CEDAR CX Technologies

– Connect with us –

Phone

+91 6232 49 3207


support

24/7 Research Support


sales@credenceresearch.com

– Research Methodology –

Going beyond the basics: advanced techniques in research methodology

– Trusted By –

Pepshi, LG, Nestle
Motorola, Honeywell, Johnson and johnson
LG Chem, SIEMENS, Pfizer
Unilever, Samsonite, QIAGEN