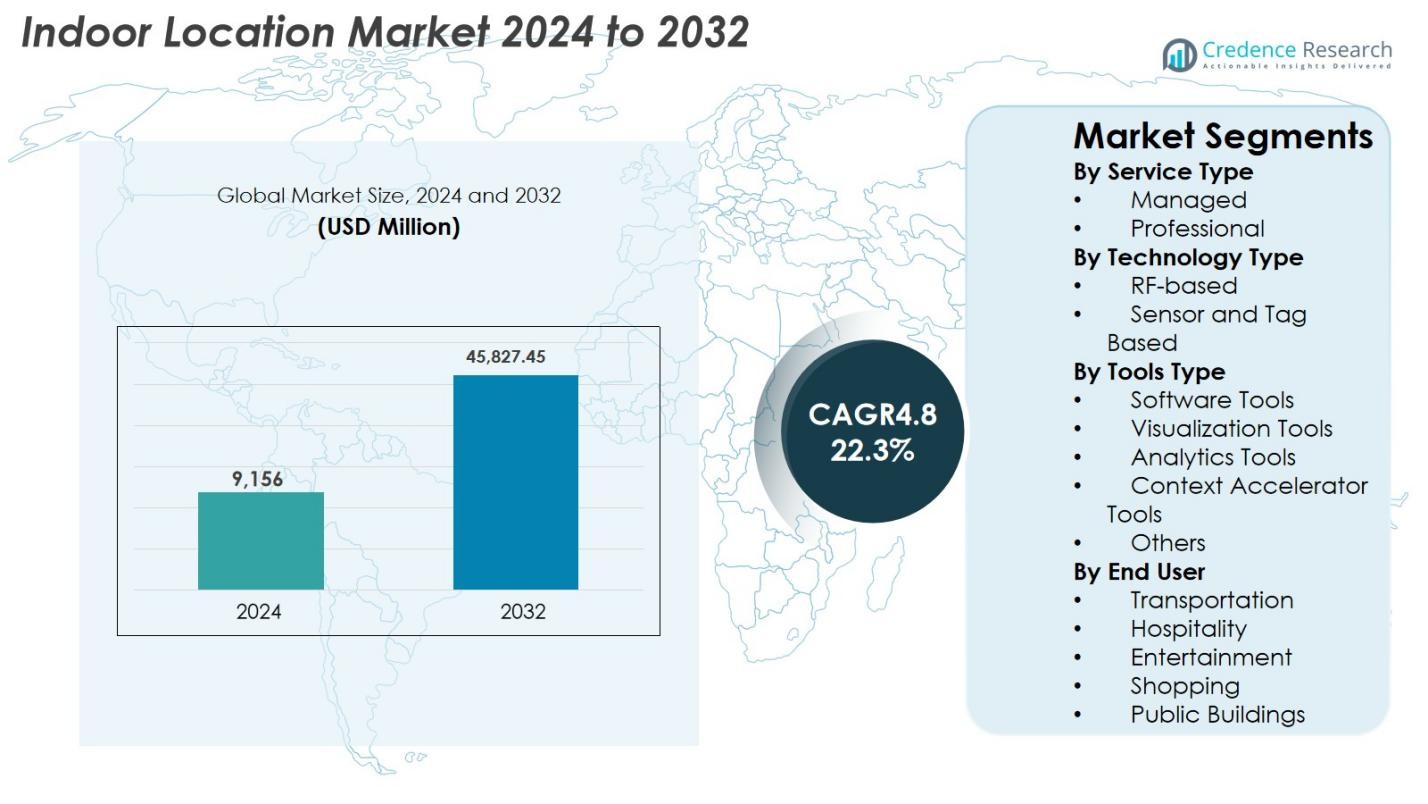
Home » Advanced Materials » Indoor Location Market

Indoor Location Market By Technology Types (Bluetooth Low Energy (BLE) Beacons, Wi-Fi-Based Location Services, Ultra-Wideband (UWB), Infrared (IR) and Ultrasound, Radio-Frequency Identification (RFID), Sensor Fusion, Visible Light Communication (VLC)) By Application (Indoor Navigation and Wayfinding, Asset Tracking and Management, Indoor Mapping and Location-Based Services, Location Analytics and Business Intelligence, Proximity Marketing, Emergency Response and Safety, Manufacturing and Logistics, Retail and E-commerce) By End Users (Retail and E-commerce, Healthcare and Hospitals, Manufacturing and Warehousing, Transportation and Logistics, Corporate Offices and Business Facilities, Education Institutions, Sports and Entertainment Venues, Government and Public Facilities) By Region – Global Growth, Future Prospects & Competitive Analysis, Report 2020 – 2030

Price: $4999

Published: | Report ID: 24094 | Report Format : PDF

Market Definition

The indoor location market refers to a market in which modern technology and sensors are used to simplify the identification and monitoring of inside places. It entails the use of a variety of approaches, including wireless networks, Bluetooth, radio frequencies, and other location-based technologies. The indoor location market’s major goal is to deliver precise and real-time positioning information within indoor locations such as retail malls, airports, hospitals, and corporate buildings. Businesses and organizations can use this technology to improve customer experiences, manage operations, and increase safety and security measures. Businesses can provide individualized services, navigation aid, targeted advertising, and effective resource management by employing indoor positioning systems.

Market Overview

It is anticipated that between 2023 and 2030, the worldwide Indoor Location Market will expand at a compound annual growth rate (CAGR) of 23.50%. From USD 10845.8 million in 2022, the market is projected to be worth USD 58694.4 million by 2030.

The indoor location sector has a bright future. Indoor positioning systems are becoming more popular as technology advances. This market is increasing in a variety of areas, including marketing, financial services, healthcare, and tourism. Indoor positioning systems are becoming more popular in a variety of industries due to their broad range of applications. It improves the customer experience by improving the services provided by businesses.

Indoor Location Market


Design Element 2

Access crucial information at unmatched prices!

Request your free sample report today & start making informed decisions powered by Credence Research!

Download Free Sample
CTA Design Element 3


Market Insights

  • The global demand for indoor location was valued at USD 10845.8 Million in 2022 and is expected to reach USD 58694.4 Million in 2030, growing at a CAGR of 23.50% between 2023 and 2030.
  • Bluetooth Low Energy (BLE) technology is likely to hold the largest market share over the forecast period, while the Wi-Fi-Based Location Services category is expected to grow rapidly.
  • The proximity category is likely to grow at the fastest CAGR over the forecast period, while retail and e-commerce are also dominant segments in the indoor location sector.
  • In 2022, the transportation and logistics category is predicted to maintain a large revenue size in the global market, while the retail and e-commerce section is expected to grow at a faster rate than the total market.
  • Over the forecast period, North America is expected to develop at the fastest CAGR. Between 2022 and 2032, Asia-Pacific is expected to grow substantially.
  • The adoption of smartphones, connected devices, and location-based apps by customers will drive industry growth.
  • Market expansion will be hampered by a lack of uniform standards and interoperability, as well as system incompatibility.

Segmentation by Technology Types

  • During the projected period, Bluetooth Low Energy (BLE) technology is expected to have the biggest market share. The indoor location’s principal technology is Bluetooth Low Energy transmissions from battery-powered beacons. BLE, which is already present on the majority of devices, is one of the most recent technologies to evolve and become a market standard. The bicycles were taken from Michelin, Belgium. To address this issue, Infsoft designed a Bluetooth beacon-based indoor tracking solution based on infsoft Locator Nodes. The solution enabled local law enforcement to recover the bikes, convict the thieves, and reduce the number of thefts.
  • The Wi-Fi-Based Location Services category is expected to increase significantly in the market.

  Segmentation by Application

  • Over the projected period, the proximity category is expected to develop at the quickest CAGR of 17.2%. It enables businesses to present clients with product information based on their location, hence increasing customer interaction. The use of location-based services for geo-targeting is expected to drive market expansion.
  • Indoor Mapping and Location-Based Services are another key segment of the indoor location market. This category entails producing accurate maps of indoor locations as well as delivering location-based services such as locating nearby amenities, locating products in a store, or directing customers to specific points of interest.
  • Retail and E-commerce are another dominant segments in the indoor location sector. This section specializes in offering location-based services and solutions for retail firms and e-commerce platforms. Indoor navigation, personalized recommendations, targeted marketing, and inventory management are all included.

Segmentation by End-Use

  • The transportation and logistics category maintained a big revenue size in the global market in 2022, owing to the extensive need for enhanced mobility support to passengers at airports and railway stations to steer them in the proper direction and right place.
  • The retail and e-commerce segment is expected to increase at a faster rate than the overall market. Factors such as the increased presence of e-commerce transactions in the retail sector to provide exceptional customer experience, as well as the growing focus of e-commerce companies on providing additional benefits for promoting efficiency in business operations, are likely to play a key role in driving global market growth.

Segmentation by Region

  • North America is predicted to grow at the fastest CAGR over the projection period.
  • Asia-Pacific is anticipated to grow rapidly between 2022 and 2032.
  • The rest of the world, including Latin America, the Middle East, and Africa, supplies the remaining demand for Indoor Location.

North America is expected to expand at the fastest CAGR throughout the projection period. Because of increased smartphone penetration and the development of IoT technologies in the region, North America is likely to have a substantial proportion of the Indoor Location market. North America is the world’s second-biggest market for tablets, smartphones, and in-vehicle navigation systems, as well as the world’s largest manufacturer of airplanes and one of the world’s largest manufacturers of aeronautical and maritime navigation equipment. The United States has a considerable market share in almost all end-user industries in North America, particularly in the consumer electronics market. The country has a high rate of smartphone penetration and sales. In addition, the country has a variety of infrastructures, such as equipment manufacturers, satellites, and sponsored research funding, all of which are linked with government help to boost technology penetration and accuracy, which is impacting market growth.

In addition, Asia-Pacific is expected to increase at a high rate between 2022 and 2032. In recent years, Asian countries have undergone the most amazing digital transformation projects across organizations and several industrial sectors. The expansion of companies, particularly the retail, transportation, and communication sectors, is creating a lucrative demand for indoor spaces.

Furthermore, a number of enterprises and institutes are stepping up to reveal complex BLE modules. In 2018, for example, the Tokyo Institute of Technology released a “Bluetooth Low-Energy transceiver” with a low power consumption for use in the popular 2.4 GHz band. This new BLE transmitter marks a significant step forward in the widespread growth of indoor sites in Japan and throughout the Asian region.

Key Highlights of the Report

The global Indoor Location Market is segmented by Technology Types, Application, End-Use, and region. Bluetooth Low Energy (BLE) technology is predicted to dominate the industry. In addition, the proximity category is predicted to grow at the fastest CAGR and In the global market in 2022, the transportation and logistics sector maintained a large revenue size, with North Amerca leading the market growth.

The primary drivers of the market include technological advancements such as IoT and beacon technology, as well as the growing acceptance of indoor location systems in numerous sectors for increased operational efficiency. In addition, the primary market barriers are privacy concerns linked to the gathering and use of location data, technical hurdles in attaining precise and reliable indoor positioning, and high implementation and maintenance costs for indoor location systems.

Nonetheless, North America is predicted to grow at the fastest CAGR over the projection period. Additionally, between 2022 and 2032, Asia-Pacific is predicted to grow rapidly.

 What Elements Are Driving the Global Market for Indoor Location?

The growing need for location-based services and personalized experiences is driving the indoor location industry. People today demand personalized experiences based on their location, whether it’s locating a certain product at a store or receiving targeted promotions. Furthermore, technological improvements such as the Internet of Things (IoT) and beacon technologies have made indoor locating more accurate and accessible. This has fuelled the expansion of indoor locating systems across multiple industries, improving operational efficiency and consumer happiness.

What Are The Main Obstacles That The Global Indoor Location Market Faces?

The indoor location market has various constraints. Concerns concerning privacy in connection with the acquisition and use of location data have sparked concerns about the ethical use and protection of personal information. This has resulted in heightened scrutiny and rules governing the use of location data. Furthermore, due to technical restrictions such as signal interference and complicated indoor surroundings, establishing precise and consistent indoor location might be difficult. Furthermore, the deployment and maintenance expenses of indoor location systems might be prohibitively expensive, particularly for small firms, limiting their general adoption.

What Market Development Prospects Are There For Indoor Location Globally?

The indoor location market offers numerous intriguing options for enterprises and industries. Indoor location applications have a lot of room to grow in industries including healthcare, retail, and transportation. Indoor location systems in healthcare can help improve patient care by allowing real-time tracking of medical equipment and workers. In retail, indoor positioning can improve the consumer experience by delivering personalized recommendations and targeted incentives. Furthermore, the integration of indoor location with future technologies such as augmented reality and artificial intelligence opens up new options for innovation.

Market Drivers

The global Indoor Location Market is driven by several factors. The following are the key drivers of the global Indoor Location Market:

Customers’ Use Of smartphones, Connected Gadgets, And Location-Based Apps

With rising smartphone penetration and evolving consumer mobile purchasing behaviour, startups and established businesses alike are trying to offer location-based services that will engage their indoor consumers. Merchants have been able to improve their customer experiences and provide appropriate navigation for products or places by implementing indoor location technology. Interior location solutions allow businesses to connect people inside large indoor venues with their brands, products, partners, or anything else that helps them increase customer relationships and sales. The proliferation of various technologies, such as Bluetooth Low Energy (BLE) and Wi-Fi, enables users to determine a person’s whereabouts within a specific range. Airlines and airports can utilize beacons to detect a user’s presence inside the airport and determine which floor the user is on using geofencing technology. Knowing the location of a passenger before delivering data provides for more effective and efficient communication.

Market Restraints

The global Indoor Location Marketfaces some challenges that may hinder its growth. These include the following:

Lack Of Uniform Standards And Interoperability, As Well As System Incompatibility

End users must select from a greater range of available solutions; yet, the lack of common standards makes integrating the available solutions difficult. End users are limited by the incompatibility and lack of interoperability of various infrastructures. Companies like as Zebra Technologies, HID Global, and Inpixon offer indoor location systems that support multiple protocols; however, the bulk of market rivals often focus on a single protocol. With the exception of solutions provided by a few vendors, such as Zebra Technologies, which offer multiple indoor location technologies supported by the same middleware, there is no interoperability between different indoor location solutions because different technologies operate on different protocols and frequency bands.

Opportunities

The global Indoor Location Marketoffers significant growth opportunities. These include the following:

RFID Tags are Becoming Increasingly Used In The Retail Industry

The most crucial job for merchants is to address the demands of their customers. If a customer can order a product online and have it sent to a local store, it might be a win-win situation for everyone. If a consumer orders a product and receives notification that it has been dispatched, but the business misplaces it, it can be disastrous for the retailer. RFID tags are used because they are inexpensive. RFID is a technology that can provide retailers, consumers, and brand owners with clear, real-time insights on their inventory and its application in self-checkout, product information, and payment procedures. This technology is expected to spread throughout the retail industry.

For instance, Smartrac Circus Flex NFC tags have been inserted in some of Mammut Sports Group AG’s products. As a result, consumers will be able to get digital material via Mammut Connect, Mammut’s smartphone app.

RFID assists brands and merchants in being more efficient by providing them with new opportunities, insights, additional services, and tailored, defined, and fast information.

Competitive Landscape

        Indoor Location Market Research


Shape Your Report to Specific Countries or Regions & Enjoy 30% Off!


Key Players

The global Indoor Location Market is highly competitive, with several key players. Some of the major players in the market and their market share are as follows:

  • Acuity Brands
  • AiRISTA
  • Apple
  • Azitek
  • CenTrak
  • Cisco
  • Esri
  • Google
  • HERE
  • HID Global
  • HPE
  • Infsoft
  • InnerSpace
  • Inpixon
  • Kontakt.io
  • Mapxus
  • Microsoft
  • Mist
  • Navenio
  • Navigine
  • Oriient
  • Polaris Wireless
  • Pozyx
  • Quuppa
  • SITUM
  • Sonitor
  • STANLEY Healthcare
  • Syook
  • Ubisense
  • Zebra Technologies.

These organizations prioritize Technology Types innovation, Disease Area expansion, and mergers and acquisitions to stay competitive.

The global Indoor Location Market’s key players continually seek to stay ahead by offering new Technology Typess and developments.

In December 2022, Inpixon reported that it has acquired a buy order for its real-time location systems for items from a major multinational supplier of industrial and transportation goods and services; the purchase order is worth more than USD 1 million and is valid for approximately 18 months. RTLS technology will be used in products that provide proximity awareness and collision avoidance for worker safety in industrial processes.

In July 2022,  Esri has released an indoor positioning solution for the facility Wayfinding ArcGIS IPS. ArcGIS IPS, the company’s main indoor mapping and positioning product, provides organizations with access to the geospatial context of their inside settings. Indoor GIS can evaluate space usage trends, help manage indoor assets like damaged desks and pipes, route people to their destinations, and even safely evacuate building residents in an emergency by displaying foot traffic patterns, social distance metrics, and cleaning statistics.

In May 2021, Design Reactor (The CXApp), a well-known SaaS app platform, and its outstanding capital stock have been acquired by Inpixon. Corporate organizations can use the CXApp to create a custom-branded, location-aware employee app aimed at improving the workplace environment and hosting virtual and hybrid events. Revenue and profitability are expected to increase as a result of the purchase.

Summary of Key Findings

  • Customers’ use of smartphones, connected devices, and location-based apps will drive industry growth.
  • Market segmented by Technology Types, Application, End-Use,  and region
  • The proximity category is likely to grow at the fastest CAGR over the forecast period
  • In 2022, the transportation and logistics category is predicted to maintain a large revenue size in the global market
  • The hydraulic system segment is likely to have the largest market share in 2022
  • North America is leading market growth; the market is highly competitive with key players including Acuity Brands, AiRISTA, Apple, Azitek, CenTrak, Cisco, Esri, Google, HERE, HID Global, HPE, Infsoft, InnerSpace, Inpixon, Kontakt.io, Mapxus, Microsoft, Mist, Navenio

Future Outlook

  • Technological advancements
  • Increased demand for indoor positioning systems
  • Growth across various sectors
  • Expanding applications
  • Enhanced customer experience


Indoor Location Market Report


Segmentation

  • By Technology Types:
    • Bluetooth Low Energy (BLE) Beacons
    • Wi-Fi-Based Location Services
    • Ultra-Wideband (UWB)
    • Infrared (IR) and Ultrasound
    • Radio-Frequency Identification (RFID)
    • Sensor Fusion
    • Visible Light Communication (VLC)
  • By Application:
    • Indoor Navigation and Wayfinding
    • Asset Tracking and Management
    • Indoor Mapping and Location-Based Services
    • Location Analytics and Business Intelligence
    • Proximity Marketing
    • Emergency Response and Safety
    • Manufacturing and Logistics
    • Retail and E-commerce
  • By End Users:
    • Retail and E-commerce
    • Healthcare and Hospitals
    • Manufacturing and Warehousing
    • Transportation and Logistics
    • Corporate Offices and Business Facilities
    • Education Institutions
    • Sports and Entertainment Venues
    • Government and Public Facilities
  • By Region
    • North America
      • US
      • Canada
      • Mexico
    • Europe
      • Germany
      • France
      • UK.
      • Italy
      • Spain
      • Rest of Europe
    • Asia Pacific
      • China
      • Japan
      • India
      • South Korea
      • South-east Asia
      • Rest of Asia Pacific
    • Latin America
      • Brazil
      • Argentina
      • Rest of Latin America
    • Middle East & Africa
      • GCC Countries
      • South Africa
      • Rest of Middle East and Africa


Table of Content
1. Preface
1.1. Report Description
1.1.1. Purpose of the Report
1.1.2. Target Audience
1.1.3. USP and Key Offerings
1.2. Research Scope
1.3. Market Introduction

2. Executive Summary
2.1. Market Snapshot: Global Indoor Location Market
2.1.1. Global Indoor Location Market, By Technology Types
2.1.2. Global Indoor Location Market, By Application
2.1.3. Global Indoor Location Market, By End-Use
2.1.4. Global Indoor Location Market, By Region
2.2. Insights from Primary Respondents

3. Market Dynamics & Factors Analysis
3.1. Introduction
3.1.1. Global Indoor Location Market Value, 2017-2030, (US$ Mn)
3.1.2. Y-o-Y Growth Trend Analysis
3.2. Market Dynamics
3.2.1. Indoor Location Market Drivers
3.2.2. Indoor Location Market Restraints
3.2.3. Indoor Location Market Opportunities
3.2.4. MajorIndoor Location Industry Challenges
3.3. Growth and Development Patterns
3.4. Investment Feasibility Analysis
3.5. Market Opportunity Analysis
3.5.1. Technology Types
3.5.2. Application
3.5.3. End-Use
3.5.4. Geography

4. Market Competitive Landscape Analysis
4.1. Company Market Share Analysis, 2022
4.1.1. Global Indoor Location Market: Company Market Share, Value 2022
4.1.2. Global Indoor Location Market: Top 6 Company Market Share, Value 2022
4.1.3. Global Indoor Location Market: Top 3 Company Market Share, Value 2022
4.2. Global Indoor Location Market: Company Revenue Share Analysis, 2022
4.3. Company Assessment Metrics, 2022
4.3.1. Stars
4.3.2. Emerging Leaders
4.3.3. Pervasive Players
4.3.4. Participants
4.4. Startups/ SMEs Assessment Metrics, 2022
4.4.1. Progressive Companies
4.4.2. Responsive Companies
4.4.3. Dynamic Companies
4.4.4. Starting Blocks
4.5. Strategic Development
4.5.1. Acquisition and Mergers
4.5.2. New Technology Types Launch
4.5.3. Regional Expansion
4.5.4. Partnerships
4.6. Key Player Technology Types Matrix
4.7. Potential for New Players in the Global Indoor Location Market

5. Premium Insights
5.1. STAR (Situation, Task, Action, Results) Analysis
5.2. Porter’s Five Forces Analysis
5.2.1. Threat of New Entrants
5.2.2. Bargaining Power of Buyers/Consumers
5.2.3. Bargaining Power of Suppliers
5.2.4. Threat of Substitute Types
5.2.5. Intensity of Competitive Rivalry
5.3. PESTEL Analysis
5.3.1. Political Factors
5.3.2. Economic Factors
5.3.3. Social Factors
5.3.4. Technological Factors
5.3.5. Environmental Factors
5.3.6. Legal Factors
5.4. Key Market Trends
5.4.1. Demand Side Trends
5.4.2. Supply Side Trends
5.5. Value Chain Analysis
5.6. Technology Analysis
5.6.1. Healthcare and Hospitals in the global market
5.6.2. Patent Analysis
5.6.3. Emerging technologies and their potential disruption to the market
5.7. Consumer Behaviour Analysis
5.7.1. Consumer Preferences and Expectations
5.7.2. Factors Influencing Consumer Buying Decisions
5.7.2.1. North America
5.7.2.2. Europe
5.7.2.3. Asia Pacific
5.7.2.4. Latin America
5.7.2.5. Middle East and Africa
5.7.3. Consumer Pain Points
5.8. Analysis and Recommendations
5.9. Adjacent Market Analysis

6. Market Positioning of Key Players, 2022
6.1. Company market share of key players, 2022
6.2. Competitive Benchmarking
6.3. Market Positioning of Key Vendors
6.4. Geographical Presence Analysis
6.5. Major Strategies Adopted by Key Players
6.5.1. Key Strategies Analysis
6.5.2. Mergers and Acquisitions
6.5.3. Partnerships
6.5.4. Technology Types Launch
6.5.5. Geographical Expansion
6.5.6. Radio-Frequency Identification (RFID)

7. Impact Analysis of COVID 19 and Russia – Ukraine War on Indoor Location Market
7.1. Ukraine-Russia War Impact
7.1.1. Uncertainty and Economic Instability
7.1.2. Supply chain disruptions
7.1.3. Regional market shifts
7.1.4. Shift in government priorities
7.2. COVID-19 Impact Analysis
7.2.1. Supply Chain Disruptions
7.2.2. Demand Fluctuations
7.2.3. Shift in Technology Types Mix
7.2.4. Reduced Bluetooth Low Energy (BLE) Beacons Activity
7.2.5. Regional Impact Analysis
7.2.5.1. North America
7.2.5.2. Europe
7.2.5.3. Asia Pacific
7.2.5.4. Latin America
7.2.5.5. Middle East and Africa

8. Global Indoor Location Market, By Technology Types
8.1. Global Indoor Location Market Overview, By Technology Types
8.1.1. Global Indoor Location Market Revenue Share, By Technology Types, 2022 Vs 2030 (in %)
8.2. Bluetooth Low Energy (BLE) Beacons
8.2.1. Global Indoor Location Market, By BLUETOOTH LOW ENERGY (BLE) BEACONS, By Region, 2017-2030 (US$ Mn)
8.2.2. Market Dynamics for BLUETOOTH LOW ENERGY (BLE) BEACONS
8.2.2.1. Drivers
8.2.2.2. Restraints
8.2.2.3. Opportunities
8.2.2.4. Trends
8.3. Wi-Fi-Based Location Services
8.3.1. Global Indoor Location Market, By WI-FI-BASED LOCATION SERVICES, By Region, 2017-2030 (US$ Mn)
8.3.2. Market Dynamics for WI-FI-BASED LOCATION SERVICES
8.3.2.1. Drivers
8.3.2.2. Restraints
8.3.2.3. Opportunities
8.3.2.4. Trends
8.4. Ultra-Wideband (UWB)
8.4.1. Global Indoor Location Market, By Ultra-Wideband (UWB), By Region, 2017-2030 (US$ Mn)
8.4.2. Market Dynamics for Ultra-Wideband (UWB)
8.4.2.1. Drivers
8.4.2.2. Restraints
8.4.2.3. Opportunities
8.4.2.4. Trends
8.5. Infrared (IR) and Ultrasound
8.5.1. Global Indoor Location Market, By Infrared (IR) and Ultrasound, By Region, 2017-2030 (US$ Mn)
8.5.2. Market Dynamics for Infrared (IR) and Ultrasound
8.5.2.1. Drivers
8.5.2.2. Restraints
8.5.2.3. Opportunities
8.5.2.4. Trends
8.6. Radio-Frequency Identification (RFID)
8.6.1. Global Indoor Location Market, By Radio-Frequency Identification (RFID), By Region, 2017-2030 (US$ Mn)
8.6.2. Market Dynamics for Radio-Frequency Identification (RFID)
8.6.2.1. Drivers
8.6.2.2. Restraints
8.6.2.3. Opportunities
8.6.2.4. Trends
8.7. Sensor Fusion
8.7.1. Global Indoor Location Market, By Sensor Fusion, By Region, 2017-2030 (US$ Mn)
8.7.2. Market Dynamics for Sensor Fusion
8.7.2.1. Drivers
8.7.2.2. Restraints
8.7.2.3. Opportunities
8.7.2.4. Trends
8.8. Visible Light Communication (VLC)
8.8.1. Global Indoor Location Market, By Visible Light Communication (VLC), By Region, 2017-2030 (US$ Mn)
8.8.2. Market Dynamics for Visible Light Communication (VLC)
8.8.2.1. Drivers
8.8.2.2. Restraints
8.8.2.3. Opportunities
8.8.2.4. Trends

9. Global Indoor Location Market, By Application
9.1. Global Indoor Location Market Overview, By Application
9.1.1. Global Indoor Location Market Revenue Share, By Application, 2022 Vs 2030 (in %)
9.2. Indoor Navigation and Wayfinding
9.2.1. Global Indoor Location Market, By Indoor Navigation and Wayfinding, By Region, 2017-2030 (US$ Mn)
9.2.2. Market Dynamics for Indoor Navigation and Wayfinding
9.2.2.1. Drivers
9.2.2.2. Restraints
9.2.2.3. Opportunities
9.2.2.4. Trends
9.3. Asset Tracking and Management
9.3.1. Global Indoor Location Market, By Asset Tracking and Management, By Region, 2017-2030 (US$ Mn)
9.3.2. Market Dynamics for Asset Tracking and Management
9.3.2.1. Drivers
9.3.2.2. Restraints
9.3.2.3. Opportunities
9.3.2.4. Trends
9.4. Indoor Mapping and Location-Based Services
9.4.1. Global Indoor Location Market, By Indoor Mapping and Location-Based Services, By Region, 2017-2030 (US$ Mn)
9.4.2. Market Dynamics for Indoor Mapping and Location-Based Services
9.4.2.1. Drivers
9.4.2.2. Restraints
9.4.2.3. Opportunities
9.4.2.4. Trends
9.5. Location Analytics and Business Intelligence
9.5.1. Global Indoor Location Market, By Location Analytics and Business Intelligence, By Region, 2017-2030 (US$ Mn)
9.5.2. Market Dynamics for Location Analytics and Business Intelligence
9.5.2.1. Drivers
9.5.2.2. Restraints
9.5.2.3. Opportunities
9.5.2.4. Trends
9.6. Proximity Marketing
9.6.1. Global Indoor Location Market, By Proximity Marketing, By Region, 2017-2030 (US$ Mn)
9.6.2. Market Dynamics for Proximity Marketing
9.6.2.1. Drivers
9.6.2.2. Restraints
9.6.2.3. Opportunities
9.6.2.4. Trends
9.7. Emergency Response and Safety
9.7.1. Global Indoor Location Market, By Emergency Response and Safety, By Region, 2017-2030 (US$ Mn)
9.7.2. Market Dynamics for Emergency Response and Safety
9.7.2.1. Drivers
9.7.2.2. Restraints
9.7.2.3. Opportunities
9.7.2.4. Trends
9.8. Manufacturing and Logistics
9.8.1. Global Indoor Location Market, By Manufacturing and Logistics, By Region, 2017-2030 (US$ Mn)
9.8.2. Market Dynamics for Manufacturing and Logistics
9.8.2.1. Drivers
9.8.2.2. Restraints
9.8.2.3. Opportunities
9.8.2.4. Trends
9.9. Retail and E-commerce
9.9.1. Global Indoor Location Market, By Retail and E-commerce, By Region, 2017-2030 (US$ Mn)
9.9.2. Market Dynamics for Retail and E-commerce
9.9.2.1. Drivers
9.9.2.2. Restraints
9.9.2.3. Opportunities
9.9.2.4. Trends

10. Global Indoor Location Market, By End-Use
10.1. Global Indoor Location Market Overview, By End-Use
10.1.1. Global Indoor Location Market Revenue Share, By End-Use,2022 Vs 2030 (in %)
10.2. Retail and E-commerce
10.2.1. Global Indoor Location Market, By Retail and E-commerce, By Region, 2017-2030 (US$ Mn)
10.2.2. Market Dynamics for Retail and E-commerce
10.2.2.1. Drivers
10.2.2.2. Restraints
10.2.2.3. Opportunities
10.2.2.4. Trends
10.3. Healthcare and Hospitals
10.3.1. Global Indoor Location Market, By Healthcare and Hospitals, By Region, 2017-2030 (US$ Mn)
10.3.2. Market Dynamics for Healthcare and Hospitals
10.3.2.1. Drivers
10.3.2.2. Restraints
10.3.2.3. Opportunities
10.3.2.4. Trends
10.4. Manufacturing and Warehousing
10.4.1. Global Indoor Location Market, By Manufacturing and Warehousing, By Region, 2017-2030 (US$ Mn)
10.4.2. Market Dynamics for Manufacturing and Warehousing
10.4.2.1. Drivers
10.4.2.2. Restraints
10.4.2.3. Opportunities
10.4.2.4. Trends
10.5. Transportation and Logistics
10.5.1. Global Indoor Location Market, By Transportation and Logistics, By Region, 2017-2030 (US$ Mn)
10.5.2. Market Dynamics for Transportation and Logistics
10.5.2.1. Drivers
10.5.2.2. Restraints
10.5.2.3. Opportunities
10.5.2.4. Trends
10.6. Corporate Offices and Business Facilities
10.6.1. Global Indoor Location Market, By Corporate Offices and Business Facilities, By Region, 2017-2030 (US$ Mn)
10.6.2. Market Dynamics for Corporate Offices and Business Facilities
10.6.2.1. Drivers
10.6.2.2. Restraints
10.6.2.3. Opportunities
10.6.2.4. Trends
10.7. Education Institutions
10.7.1. Global Indoor Location Market, By Education Institutions, By Region, 2017-2030 (US$ Mn)
10.7.2. Market Dynamics for Education Institutions
10.7.2.1. Drivers
10.7.2.2. Restraints
10.7.2.3. Opportunities
10.7.2.4. Trends
10.8. Sports and Entertainment Venues
10.8.1. Global Indoor Location Market, By Sports and Entertainment Venues, By Region, 2017-2030 (US$ Mn)
10.8.2. Market Dynamics for Sports and Entertainment Venues
10.8.2.1. Drivers
10.8.2.2. Restraints
10.8.2.3. Opportunities
10.8.2.4. Trends
10.9. Government and Public Facilities
10.9.1. Global Indoor Location Market, By Government and Public Facilities, By Region, 2017-2030 (US$ Mn)
10.9.2. Market Dynamics for Government and Public Facilities
10.9.2.1. Drivers
10.9.2.2. Restraints
10.9.2.3. Opportunities
10.9.2.4. Trends
11. Global Indoor Location Market, By Region
11.1. Global Indoor Location Market Overview, by Region
11.1.1. Global Indoor Location Market, By Region, 2022 vs 2030 (in%)
11.2. Technology Types
11.2.1. Global Indoor Location Market, By Technology Types, 2017-2030 (US$ Mn)
11.3. Application
11.3.1. Global Indoor Location Market, By Application, 2017-2030 (US$ Mn)
11.4. End-Use
11.4.1. Global Indoor Location Market, By End-Use, 2017-2030 (US$ Mn)

12. North AmericaIndoor Location Market Analysis
12.1. Overview
12.1.1. Market Dynamics for North America
12.1.1.1. Drivers
12.1.1.2. Restraints
12.1.1.3. Opportunities
12.1.1.4. Trends
12.2. North America Indoor Location Market, By Technology Types, 2017-2030(US$ Mn)
12.2.1. Overview
12.2.2. SRC Analysis
12.3. North America Indoor Location Market, By Application, 2017-2030(US$ Mn)
12.3.1. Overview
12.3.2. SRC Analysis
12.4. North America Indoor Location Market, By End-Use, 2017-2030(US$ Mn)
12.4.1. Overview
12.4.2. SRC Analysis
12.5. North America Indoor Location Market, by Country, 2017-2030(US$ Mn)
12.5.1. North America Indoor Location Market, by Country, 2022 Vs 2030 (in%)
12.5.2. U.S.
12.5.3. Canada
12.5.4. Mexico

13. EuropeIndoor Location Market Analysis
13.1. Overview
13.1.1. Market Dynamics for North America
13.1.1.1. Drivers
13.1.1.2. Restraints
13.1.1.3. Opportunities
13.1.1.4. Trends
13.2. EuropeIndoor Location Market, By Technology Types, 2017-2030(US$ Mn)
13.2.1. Overview
13.2.2. SRC Analysis
13.3. EuropeIndoor Location Market, By Application, 2017-2030(US$ Mn)
13.3.1. Overview
13.3.2. SRC Analysis
13.4. EuropeIndoor Location Market, By End-Use, 2017-2030(US$ Mn)
13.4.1. Overview
13.4.2. SRC Analysis
13.5. EuropeIndoor Location Market, by Country, 2017-2030 (US$ Mn)
13.5.1. EuropeIndoor Location Market, by Country, 2022 Vs 2030 (in%)
13.5.2. UK
13.5.3. France
13.5.4. Germany
13.5.5. Italy
13.5.6. Spain
13.5.7. Benelux
13.5.8. Russia
13.5.9. Rest of Europe

14. Asia Pacific Indoor Location Market Analysis
14.1. Overview
14.1.1. Market Dynamics for North America
14.1.1.1. Drivers
14.1.1.2. Restraints
14.1.1.3. Opportunities
14.1.1.4. Trends
14.2. Asia PacificIndoor Location Market, By Technology Types, 2017-2030(US$ Mn)
14.2.1. Overview
14.2.2. SRC Analysis
14.3. Asia PacificIndoor Location Market, By Application, 2017-2030(US$ Mn)
14.3.1. Overview
14.3.2. SRC Analysis
14.4. Asia PacificIndoor Location Market, By End-Use, 2017-2030(US$ Mn)
14.4.1. Overview
14.4.2. SRC Analysis
14.5. Asia Pacific Indoor Location Market, by Country, 2017-2030 (US$ Mn)
14.5.1. Asia Pacific Indoor Location Market, by Country, 2022 Vs 2030 (in%)
14.5.2. China
14.5.3. Japan
14.5.4. India
14.5.5. South Korea
14.5.6. South East Asia
14.5.7. Rest of Asia Pacific

15. Latin America Indoor Location Market Analysis
15.1. Overview
15.1.1. Market Dynamics for North America
15.1.1.1. Drivers
15.1.1.2. Restraints
15.1.1.3. Opportunities
15.1.1.4. Trends
15.2. Latin America Indoor Location Market, By Technology Types, 2017-2030(US$ Mn)
15.2.1. Overview
15.2.2. SRC Analysis
15.3. Latin AmericaIndoor Location Market, By Application, 2017-2030(US$ Mn)
15.3.1. Overview
15.3.2. SRC Analysis
15.4. Latin AmericaIndoor Location Market, By End-Use, 2017-2030(US$ Mn)
15.4.1. Overview
15.4.2. SRC Analysis
15.5. Latin AmericaIndoor Location Market, by Country, 2017-2030 (US$ Mn)
15.5.1. Latin AmericaIndoor Location Market, by Country, 2022 Vs 2030 (in%)
15.5.2. Brazil
15.5.3. Argentina
15.5.4. Rest of Latin America

16. Middle East Indoor Location Market Analysis
16.1. Overview
16.1.1. Market Dynamics for North America
16.1.1.1. Drivers
16.1.1.2. Restraints
16.1.1.3. Opportunities
16.1.1.4. Trends
16.2. Middle East Indoor Location Market, By Technology Types, 2017-2030(US$ Mn)
16.2.1. Overview
16.2.2. SRC Analysis
16.3. Middle East Indoor Location Market, By Application, 2017-2030(US$ Mn)
16.3.1. Overview
16.3.2. SRC Analysis
16.4. Middle EastIndoor Location Market, By End-Use, 2017-2030(US$ Mn)
16.4.1. Overview
16.4.2. SRC Analysis
16.5. Middle East Indoor Location Market, by Country, 2017-2030 (US$ Mn)
16.5.1. Middle EastIndoor Location Market, by Country, 2022 Vs 2030 (in%)
16.5.2. UAE
16.5.3. Saudi Arabia
16.5.4. Rest of Middle East

17. Africa Indoor Location Market Analysis
17.1. Overview
17.1.1. Market Dynamics for North America
17.1.1.1. Drivers
17.1.1.2. Restraints
17.1.1.3. Opportunities
17.1.1.4. Trends
17.2. Africa Indoor Location Market, By Technology Types, 2017-2030(US$ Mn)
17.2.1. Overview
17.2.2. SRC Analysis
17.3. Africa Indoor Location Market, By Application, 2017-2030(US$ Mn)
17.3.1. Overview
17.3.2. SRC Analysis
17.4. Africa Indoor Location Market, By End-Use, 2017-2030(US$ Mn)
17.4.1. Overview
17.4.2. SRC Analysis
17.5. Africa Indoor Location Market, by Country, 2017-2030 (US$ Mn)
17.5.1. Middle EastIndoor Location Market, by Country, 2022 Vs 2030 (in%)
17.5.2. South Africa
17.5.3. Egypt
17.5.4. Rest of Africa

18. Company Profiles
18.1. Acuity Brands
18.1.1. Company Overview
18.1.2. Technology Typess/Services Portfolio
18.1.3. Geographical Presence
18.1.4. SWOT Analysis
18.1.5. Financial Summary
18.1.5.1. Market Revenue and Net Profit (2019-2022)
18.1.5.2. Business Segment Revenue Analysis
18.1.5.3. Geographical Revenue Analysis
18.2. AiRISTA
18.3. Apple
18.4. Azitek
18.5. CenTrak
18.6. Cisco
18.7. Esri
18.8. Google
18.9. HERE
18.10. HID Global
18.11. HPE
18.12. Infsoft
18.13. InnerSpace
18.14. Inpixon
18.15. Kontakt.io
18.16. Mapxus
18.17. Microsoft
18.18. Mist
18.19. Navenio
18.20. Navigine
18.21. Oriient
18.22. Polaris Wireless
18.23. Pozyx
18.24. Quuppa
18.25. SITUM
18.26. Sonitor
18.27. STANLEY Healthcare
18.28. Syook
18.29. Ubisense
18.30. Zebra Technologies.

19. Research Methodology
19.1. Research Methodology
19.2. Retail and E-commerce – Secondary Research
19.3. Retail and E-commerceI – Data Modelling
19.3.1. Company Share Analysis Model
19.3.2. Revenue Based Modelling
19.4. Retail and E-commerceII – Primary Research
19.5. Research Limitations
19.5.1. Assumptions

List of Figures
FIG. 1 Global Indoor Location Market: Research Methodology
FIG. 2 Market Size Estimation – Top Down & Bottom up Approach
FIG. 3 Global Indoor Location Market Segmentation
FIG. 4 Global Indoor Location Market, By Technology Types, 2022 (US$ Mn)
FIG. 5 Global Indoor Location Market, By Application, 2022 (US$ Mn)
FIG. 6 Global Indoor Location Market, By End-Use, 2022 (US$ Mn)
FIG. 7 Global Indoor Location Market, by Geography, 2022 (US$ Mn)
FIG. 8 Attractive Investment Proposition, By Technology Types, 2022
FIG. 9 Attractive Investment Proposition, By Application, 2022
FIG. 10 Attractive Investment Proposition, By End-Use, 2022
FIG. 11 Attractive Investment Proposition, by Geography, 2022
FIG. 12 Global Market Share Analysis of Key Indoor Location Market Manufacturers, 2022
FIG. 13 Global Market Positioning of Key Indoor Location Market Manufacturers, 2022
FIG. 14 Global Indoor Location Market Value Contribution, By Technology Types, 2022 & 2030 (Value %)
FIG. 15 Global Indoor Location Market, by BLUETOOTH LOW ENERGY (BLE) BEACONS, Value, 2017-2030 (US$ Mn)
FIG. 16 Global Indoor Location Market, by WI-FI-BASED LOCATION SERVICES, Value, 2017-2030 (US$ Mn)
FIG. 17 Global Indoor Location Market, by Ultra-Wideband (UWB), Value, 2017-2030 (US$ Mn)
FIG. 18 Global Indoor Location Market, by Infrared (IR) and Ultrasound, Value, 2017-2030 (US$ Mn)
FIG. 19 Global Indoor Location Market, by Radio-Frequency Identification (RFID), Value, 2017-2030 (US$ Mn)
FIG. 20 Global Indoor Location Market, by Sensor Fusion, Value, 2017-2030 (US$ Mn)
FIG. 21 Global Indoor Location Market, by Visible Light Communication (VLC), Value, 2017-2030 (US$ Mn)
FIG. 22 Global Indoor Location Market Value Contribution, By Application, 2022 & 2030 (Value %)
FIG. 23 Global Indoor Location Market, by Indoor Navigation and Wayfinding, Value, 2017-2030 (US$ Mn)
FIG. 24 Global Indoor Location Market, by Asset Tracking and Management, Value, 2017-2030 (US$ Mn)
FIG. 25 Global Indoor Location Market, by Indoor Mapping and Location-Based Services, Value, 2017-2030 (US$ Mn)
FIG. 26 Global Indoor Location Market, by Location Analytics and Business Intelligence, Value, 2017-2030 (US$ Mn)
FIG. 27 Global Indoor Location Market, by Proximity Marketing, Value, 2017-2030 (US$ Mn)
FIG. 28 Global Indoor Location Market, by Emergency Response and Safety, Value, 2017-2030 (US$ Mn)
FIG. 29 Global Indoor Location Market, by Manufacturing and Logistics, Value, 2017-2030 (US$ Mn)
FIG. 30 Global Indoor Location Market, by Retail and E-commerce, Value, 2017-2030 (US$ Mn)
FIG. 31 Global Indoor Location Market Value Contribution, By End-Use, 2022 & 2030 (Value %)
FIG. 32 Global Indoor Location Market, by Retail and E-commerce, Value, 2017-2030 (US$ Mn)
FIG. 33 Global Indoor Location Market, by Healthcare and Hospitals, Value, 2017-2030 (US$ Mn)
FIG. 34 Global Indoor Location Market, by Manufacturing and Warehousing, Value, 2017-2030 (US$ Mn)
FIG. 35 Global Indoor Location Market, by Transportation and Logistics, Value, 2017-2030 (US$ Mn)
FIG. 36 Global Indoor Location Market, by Corporate Offices and Business Facilities, Value, 2017-2030 (US$ Mn)
FIG. 37 Global Indoor Location Market, by Education Institutions, Value, 2017-2030 (US$ Mn)
FIG. 38 Global Indoor Location Market, by Sports and Entertainment Venues, Value, 2017-2030 (US$ Mn)
FIG. 39 Global Indoor Location Market, by Government and Public Facilities, Value, 2017-2030 (US$ Mn)
FIG. 40 North America Indoor Location Market, 2017-2030 (US$ Mn)
FIG. 41 U.S. Indoor Location Market, 2017-2030 (US$ Mn)
FIG. 42 Canada Indoor Location Market, 2017-2030 (US$ Mn)
FIG. 43 MexicoIndoor Location Market, 2017-2030 (US$ Mn)
FIG. 44 Europe Indoor Location Market, 2017-2030 (US$ Mn)
FIG. 45 Germany Indoor Location Market, 2017-2030 (US$ Mn)
FIG. 46 France Indoor Location Market, 2017-2030 (US$ Mn)
FIG. 47 U.K. Indoor Location Market, 2017-2030 (US$ Mn)
FIG. 48 Italy Indoor Location Market, 2017-2030 (US$ Mn)
FIG. 49 Spain Indoor Location Market, 2017-2030 (US$ Mn)
FIG. 50 BeneluxIndoor Location Market, 2017-2030 (US$ Mn)
FIG. 51 RussiaIndoor Location Market, 2017-2030 (US$ Mn)
FIG. 52 Rest of Europe Indoor Location Market, 2017-2030 (US$ Mn)
FIG. 53 Asia Pacific Indoor Location Market, 2017-2030 (US$ Mn)
FIG. 54 China Indoor Location Market, 2017-2030 (US$ Mn)
FIG. 55 Japan Indoor Location Market, 2017-2030 (US$ Mn)
FIG. 56 India Indoor Location Market, 2017-2030 (US$ Mn)
FIG. 57 South Korea Indoor Location Market, 2017-2030 (US$ Mn)
FIG. 58 South-East Asia Indoor Location Market, 2017-2030 (US$ Mn)
FIG. 59 Rest of Asia Pacific Indoor Location Market, 2017-2030 (US$ Mn)
FIG. 60 Latin America Indoor Location Market, 2017-2030 (US$ Mn)
FIG. 61 Brazil Indoor Location Market, 2017-2030 (US$ Mn)
FIG. 62 ArgentinaIndoor Location Market, 2017-2030 (US$ Mn)
FIG. 63 Rest of Latin America Indoor Location Market, 2017-2030 (US$ Mn)
FIG. 64 Middle East Indoor Location Market, 2017-2030 (US$ Mn)
FIG. 65 UAEIndoor Location Market, 2017-2030 (US$ Mn)
FIG. 66 Saudi ArabiaIndoor Location Market, 2017-2030 (US$ Mn)
FIG. 67 Rest of Middle East Indoor Location Market, 2017-2030 (US$ Mn)
FIG. 68 AfricaIndoor Location Market, 2017-2030 (US$ Mn)
FIG. 69 South Africa Indoor Location Market, 2017-2030 (US$ Mn)
FIG. 70 EgyptIndoor Location Market, 2017-2030 (US$ Mn)
FIG. 71 Rest of Africa Indoor Location Market, 2017-2030 (US$ Mn)

List of Tables
TABLE 1 Market Snapshot: Global Indoor Location Market
TABLE 2 Global Indoor Location Market: Drivers Impact Analysis
TABLE 3 Global Indoor Location Market: Market Restraints Impact Analysis
TABLE 4 Global Indoor Location Market, by Competitive Benchmarking, 2022
TABLE 5 Global Indoor Location Market, by Geographical Presence Analysis, 2022
TABLE 6 Global Indoor Location Market, by Key Strategies Analysis, 2022
TABLE 7 Global Indoor Location Market, by BLUETOOTH LOW ENERGY (BLE) BEACONS, By Region, 2017-2022 (US$ Mn)
TABLE 8 Global Indoor Location Market, by BLUETOOTH LOW ENERGY (BLE) BEACONS, By Region, 2023-2030 (US$ Mn)
TABLE 9 Global Indoor Location Market, by WI-FI-BASED LOCATION SERVICES, By Region, 2017-2022 (US$ Mn)
TABLE 10 Global Indoor Location Market, by WI-FI-BASED LOCATION SERVICES, By Region, 2023-2030 (US$ Mn)
TABLE 11 Global Indoor Location Market, by Ultra-Wideband (UWB), By Region, 2017-2022 (US$ Mn)
TABLE 12 Global Indoor Location Market, by Ultra-Wideband (UWB), By Region, 2023-2030 (US$ Mn)
TABLE 13 Global Indoor Location Market, by Infrared (IR) and Ultrasound, By Region, 2017-2022 (US$ Mn)
TABLE 14 Global Indoor Location Market, by Infrared (IR) and Ultrasound, By Region, 2023-2030 (US$ Mn)
TABLE 15 Global Indoor Location Market, by Radio-Frequency Identification (RFID), By Region, 2017-2022 (US$ Mn)
TABLE 16 Global Indoor Location Market, by Radio-Frequency Identification (RFID), By Region, 2023-2030 (US$ Mn)
TABLE 17 Global Indoor Location Market, by Sensor Fusion, By Region, 2017-2022 (US$ Mn)
TABLE 18 Global Indoor Location Market, by Sensor Fusion, By Region, 2023-2030 (US$ Mn)
TABLE 19 Global Indoor Location Market, by Visible Light Communication (VLC), By Region, 2017-2022 (US$ Mn)
TABLE 20 Global Indoor Location Market, by Visible Light Communication (VLC), By Region, 2023-2030 (US$ Mn)
TABLE 21 Global Indoor Location Market, by Retail and E-commerce, By Region, 2017-2022 (US$ Mn)
TABLE 22 Global Indoor Location Market, by Retail and E-commerce, By Region, 2023-2030 (US$ Mn)
TABLE 23 Global Indoor Location Market, by Indoor Navigation and Wayfinding, By Region, 2017-2022 (US$ Mn)
TABLE 24 Global Indoor Location Market, by Indoor Navigation and Wayfinding, By Region, 2023-2030 (US$ Mn)
TABLE 25 Global Indoor Location Market, by Asset Tracking and Management, By Region, 2017-2022 (US$ Mn)
TABLE 26 Global Indoor Location Market, by Asset Tracking and Management, By Region, 2023-2030 (US$ Mn)
TABLE 27 Global Indoor Location Market, by Indoor Mapping and Location-Based Services, By Region, 2017-2022 (US$ Mn)
TABLE 28 Global Indoor Location Market, by Indoor Mapping and Location-Based Services, By Region, 2023-2030 (US$ Mn)
TABLE 29 Global Indoor Location Market, by Location Analytics and Business Intelligence, By Region, 2017-2022 (US$ Mn)
TABLE 30 Global Indoor Location Market, by Location Analytics and Business Intelligence, By Region, 2023-2030 (US$ Mn)
TABLE 31 Global Indoor Location Market, by Proximity Marketing, By Region, 2017-2022 (US$ Mn)
TABLE 32 Global Indoor Location Market, by Proximity Marketing, By Region, 2023-2030 (US$ Mn)
TABLE 33 Global Indoor Location Market, by Emergency Response and Safety, By Region, 2017-2022 (US$ Mn)
TABLE 34 Global Indoor Location Market, by Emergency Response and Safety, By Region, 2023-2030 (US$ Mn)
TABLE 35 Global Indoor Location Market, by Manufacturing and Logistics, By Region, 2017-2022 (US$ Mn)
TABLE 36 Global Indoor Location Market, by Manufacturing and Logistics, By Region, 2023-2030 (US$ Mn)
TABLE 37 Global Indoor Location Market, by Retail and E-commerce, By Region, 2017-2022 (US$ Mn)
TABLE 38 Global Indoor Location Market, by Retail and E-commerce, By Region, 2023-2030 (US$ Mn)
TABLE 39 Global Indoor Location Market, by Retail and E-commerce, By Region, 2017-2022 (US$ Mn)
TABLE 40 Global Indoor Location Market, by Retail and E-commerce, By Region, 2023-2030 (US$ Mn)
TABLE 41 Global Indoor Location Market, by Healthcare and Hospitals, By Region, 2017-2022 (US$ Mn)
TABLE 42 Global Indoor Location Market, by Healthcare and Hospitals, By Region, 2023-2030 (US$ Mn)
TABLE 43 Global Indoor Location Market, by Manufacturing and Warehousing, By Region, 2017-2022 (US$ Mn)
TABLE 44 Global Indoor Location Market, by Manufacturing and Warehousing, By Region, 2023-2030 (US$ Mn)
TABLE 45 Global Indoor Location Market, by Transportation and Logistics, By Region, 2017-2022 (US$ Mn)
TABLE 46 Global Indoor Location Market, by Transportation and Logistics, By Region, 2023-2030 (US$ Mn)
TABLE 47 Global Indoor Location Market, by Corporate Offices and Business Facilities, By Region, 2017-2022 (US$ Mn)
TABLE 48 Global Indoor Location Market, by Corporate Offices and Business Facilities, By Region, 2023-2030 (US$ Mn)
TABLE 49 Global Indoor Location Market, by Education Institutions, By Region, 2017-2022 (US$ Mn)
TABLE 50 Global Indoor Location Market, by Education Institutions, By Region, 2023-2030 (US$ Mn)
TABLE 51 Global Indoor Location Market, by Sports and Entertainment Venues, By Region, 2017-2022 (US$ Mn)
TABLE 52 Global Indoor Location Market, by Sports and Entertainment Venues, By Region, 2023-2030 (US$ Mn)
TABLE 53 Global Indoor Location Market, by Government and Public Facilities, By Region, 2017-2022 (US$ Mn)
TABLE 54 Global Indoor Location Market, by Government and Public Facilities, By Region, 2023-2030 (US$ Mn)
TABLE 55 Global Indoor Location Market, By Technology Types, 2017-2022 (US$ Mn)
TABLE 56 Global Indoor Location Market, By Technology Types, 2023-2030 (US$ Mn)
TABLE 57 Global Indoor Location Market, By Application, 2017-2022 (US$ Mn)
TABLE 58 Global Indoor Location Market, By Application, 2023-2030 (US$ Mn)
TABLE 59 Global Indoor Location Market, By End-Use, 2017-2022 (US$ Mn)
TABLE 60 Global Indoor Location Market, By End-Use, 2023-2030 (US$ Mn)
TABLE 61 Global Indoor Location Market, by Region, 2017-2022 (US$ Mn)
TABLE 62 Global Indoor Location Market, by Region, 2023-2030 (US$ Mn)
TABLE 63 North America Indoor Location Market, By Technology Types, 2017-2022 (US$ Mn)
TABLE 64 North America Indoor Location Market, By Technology Types, 2023-2030 (US$ Mn)
TABLE 65 North America Indoor Location Market, By Application, 2017-2022 (US$ Mn)
TABLE 66 North America Indoor Location Market, By Application, 2023-2030 (US$ Mn)
TABLE 67 North America Indoor Location Market, By End-Use, 2017-2022 (US$ Mn)
TABLE 68 North America Indoor Location Market, By End-Use, 2023-2030 (US$ Mn)
TABLE 69 North America Indoor Location Market, by Country, 2017-2022 (US$ Mn)
TABLE 70 North America Indoor Location Market, by Country, 2023-2030 (US$ Mn)
TABLE 71 United States Indoor Location Market, By Technology Types, 2017-2022 (US$ Mn)
TABLE 72 United States Indoor Location Market, By Technology Types, 2023-2030 (US$ Mn)
TABLE 73 United States Indoor Location Market, By Application, 2017-2022 (US$ Mn)
TABLE 74 United States Indoor Location Market, By Application, 2023-2030 (US$ Mn)
TABLE 75 United States Indoor Location Market, By End-Use, 2017-2022 (US$ Mn)
TABLE 76 United States Indoor Location Market, By End-Use, 2023-2030 (US$ Mn)
TABLE 77 Canada Indoor Location Market, By Technology Types, 2017-2022 (US$ Mn)
TABLE 78 Canada Indoor Location Market, By Technology Types, 2023-2030 (US$ Mn)
TABLE 79 Canada Indoor Location Market, By Application, 2017-2022 (US$ Mn)
TABLE 80 Canada Indoor Location Market, By Application, 2023-2030 (US$ Mn)
TABLE 81 Canada Indoor Location Market, By End-Use, 2017-2022 (US$ Mn)
TABLE 82 Canada Indoor Location Market, By End-Use, 2023-2030 (US$ Mn)
TABLE 83 Mexico Indoor Location Market, By Technology Types, 2017-2022 (US$ Mn)
TABLE 84 Mexico Indoor Location Market, By Technology Types, 2023-2030 (US$ Mn)
TABLE 85 Mexico Indoor Location Market, By Application, 2017-2022 (US$ Mn)
TABLE 86 Mexico Indoor Location Market, By Application, 2023-2030 (US$ Mn)
TABLE 87 Mexico Indoor Location Market, By End-Use, 2017-2022 (US$ Mn)
TABLE 88 Mexico Indoor Location Market, By End-Use, 2023-2030 (US$ Mn)
TABLE 89 Europe Indoor Location Market, By Technology Types, 2017-2022 (US$ Mn)
TABLE 90 Europe Indoor Location Market, By Technology Types, 2023-2030 (US$ Mn)
TABLE 91 Europe Indoor Location Market, By Application, 2017-2022 (US$ Mn)
TABLE 92 Europe Indoor Location Market, By Application, 2023-2030 (US$ Mn)
TABLE 93 Europe Indoor Location Market, By End-Use, 2017-2022 (US$ Mn)
TABLE 94 Europe Indoor Location Market, By End-Use, 2023-2030 (US$ Mn)
TABLE 95 Europe Indoor Location Market, by Country, 2017-2022 (US$ Mn)
TABLE 96 Europe Indoor Location Market, by Country, 2023-2030 (US$ Mn)
TABLE 97 Germany Indoor Location Market, By Technology Types, 2017-2022 (US$ Mn)
TABLE 98 Germany Indoor Location Market, By Technology Types, 2023-2030 (US$ Mn)
TABLE 99 Germany Indoor Location Market, By Application, 2017-2022 (US$ Mn)
TABLE 100 Germany Indoor Location Market, By Application, 2023-2030 (US$ Mn)
TABLE 101 Germany Indoor Location Market, By End-Use, 2017-2022 (US$ Mn)
TABLE 102 Germany Indoor Location Market, By End-Use, 2023-2030 (US$ Mn)
TABLE 103 France Indoor Location Market, By Technology Types, 2017-2022 (US$ Mn)
TABLE 104 France Indoor Location Market, By Technology Types, 2023-2030 (US$ Mn)
TABLE 105 France Indoor Location Market, By Application, 2017-2022 (US$ Mn)
TABLE 106 France Indoor Location Market, By Application, 2023-2030 (US$ Mn)
TABLE 107 France Indoor Location Market, By End-Use, 2017-2022 (US$ Mn)
TABLE 108 France Indoor Location Market, By End-Use, 2023-2030 (US$ Mn)
TABLE 109 United Kingdom Indoor Location Market, By Technology Types, 2017-2022 (US$ Mn)
TABLE 110 United Kingdom Indoor Location Market, By Technology Types, 2023-2030 (US$ Mn)
TABLE 111 United Kingdom Indoor Location Market, By Application, 2017-2022 (US$ Mn)
TABLE 112 United Kingdom Indoor Location Market, By Application, 2023-2030 (US$ Mn)
TABLE 113 United Kingdom Indoor Location Market, By End-Use, 2017-2022 (US$ Mn)
TABLE 114 United Kingdom Indoor Location Market, By End-Use, 2023-2030 (US$ Mn)
TABLE 115 Italy Indoor Location Market, By Technology Types, 2017-2022 (US$ Mn)
TABLE 116 Italy Indoor Location Market, By Technology Types, 2023-2030 (US$ Mn)
TABLE 117 Italy Indoor Location Market, By Application, 2017-2022 (US$ Mn)
TABLE 118 Italy Indoor Location Market, By Application, 2023-2030 (US$ Mn)
TABLE 119 Italy Indoor Location Market, By End-Use, 2017-2022 (US$ Mn)
TABLE 120 Italy Indoor Location Market, By End-Use, 2023-2030 (US$ Mn)
TABLE 121 Spain Indoor Location Market, By Technology Types, 2017-2022 (US$ Mn)
TABLE 122 Spain Indoor Location Market, By Technology Types, 2023-2030 (US$ Mn)
TABLE 123 Spain Indoor Location Market, By Application, 2017-2022 (US$ Mn)
TABLE 124 Spain Indoor Location Market, By Application, 2023-2030 (US$ Mn)
TABLE 125 Spain Indoor Location Market, By End-Use, 2017-2022 (US$ Mn)
TABLE 126 Spain Indoor Location Market, By End-Use, 2023-2030 (US$ Mn)
TABLE 127 BeneluxIndoor Location Market, By Technology Types, 2017-2022 (US$ Mn)
TABLE 128 BeneluxIndoor Location Market, By Technology Types, 2023-2030 (US$ Mn)
TABLE 129 BeneluxIndoor Location Market, By Application, 2017-2022 (US$ Mn)
TABLE 130 BeneluxIndoor Location Market, By Application, 2023-2030 (US$ Mn)
TABLE 131 BeneluxIndoor Location Market, By End-Use, 2017-2022 (US$ Mn)
TABLE 132 BeneluxIndoor Location Market, By End-Use, 2023-2030 (US$ Mn)
TABLE 133 RussiaIndoor Location Market, By Technology Types, 2017-2022 (US$ Mn)
TABLE 134 RussiaIndoor Location Market, By Technology Types, 2023-2030 (US$ Mn)
TABLE 135 RussiaIndoor Location Market, By Application, 2017-2022 (US$ Mn)
TABLE 136 RussiaIndoor Location Market, By Application, 2023-2030 (US$ Mn)
TABLE 137 RussiaIndoor Location Market, By End-Use, 2017-2022 (US$ Mn)
TABLE 138 RussiaIndoor Location Market, By End-Use, 2023-2030 (US$ Mn)
TABLE 139 Rest of Europe Indoor Location Market, By Technology Types, 2017-2022 (US$ Mn)
TABLE 140 Rest of Europe Indoor Location Market, By Technology Types, 2023-2030 (US$ Mn)
TABLE 141 Rest of Europe Indoor Location Market, By Application, 2017-2022 (US$ Mn)
TABLE 142 Rest of Europe Indoor Location Market, By Application, 2023-2030 (US$ Mn)
TABLE 143 Rest of Europe Indoor Location Market, By End-Use, 2017-2022 (US$ Mn)
TABLE 144 Rest of Europe Indoor Location Market, By End-Use, 2023-2030 (US$ Mn)
TABLE 145 Asia Pacific Indoor Location Market, By Technology Types, 2017-2022 (US$ Mn)
TABLE 146 Asia Pacific Indoor Location Market, By Technology Types, 2023-2030 (US$ Mn)
TABLE 147 Asia Pacific Indoor Location Market, By Application, 2017-2022 (US$ Mn)
TABLE 148 Asia Pacific Indoor Location Market, By Application, 2023-2030 (US$ Mn)
TABLE 149 Asia Pacific Indoor Location Market, By End-Use, 2017-2022 (US$ Mn)
TABLE 150 Asia Pacific Indoor Location Market, By End-Use, 2023-2030 (US$ Mn)
TABLE 151 China Indoor Location Market, By Technology Types, 2017-2022 (US$ Mn)
TABLE 152 China Indoor Location Market, By Technology Types, 2023-2030 (US$ Mn)
TABLE 153 China Indoor Location Market, By Application, 2017-2022 (US$ Mn)
TABLE 154 China Indoor Location Market, By Application, 2023-2030 (US$ Mn)
TABLE 155 China Indoor Location Market, By End-Use, 2017-2022 (US$ Mn)
TABLE 156 China Indoor Location Market, By End-Use, 2023-2030 (US$ Mn)
TABLE 157 Japan Indoor Location Market, By Technology Types, 2017-2022 (US$ Mn)
TABLE 158 Japan Indoor Location Market, By Technology Types, 2023-2030 (US$ Mn)
TABLE 159 Japan Indoor Location Market, By Application, 2017-2022 (US$ Mn)
TABLE 160 Japan Indoor Location Market, By Application, 2023-2030 (US$ Mn)
TABLE 161 Japan Indoor Location Market, By End-Use, 2017-2022 (US$ Mn)
TABLE 162 Japan Indoor Location Market, By End-Use, 2023-2030 (US$ Mn)
TABLE 163 India Indoor Location Market, By Technology Types, 2017-2022 (US$ Mn)
TABLE 164 India Indoor Location Market, By Technology Types, 2023-2030 (US$ Mn)
TABLE 165 India Indoor Location Market, By Application, 2017-2022 (US$ Mn)
TABLE 166 India Indoor Location Market, By Application, 2023-2030 (US$ Mn)
TABLE 167 India Indoor Location Market, By End-Use, 2017-2022 (US$ Mn)
TABLE 168 India Indoor Location Market, By End-Use, 2023-2030 (US$ Mn)
TABLE 169 South Korea Indoor Location Market, By Technology Types, 2017-2022 (US$ Mn)
TABLE 170 South Korea Indoor Location Market, By Technology Types, 2023-2030 (US$ Mn)
TABLE 171 South Korea Indoor Location Market, By Application, 2017-2022 (US$ Mn)
TABLE 172 South Korea Indoor Location Market, By Application, 2023-2030 (US$ Mn)
TABLE 173 South Korea Indoor Location Market, By End-Use, 2017-2022 (US$ Mn)
TABLE 174 South Korea Indoor Location Market, By End-Use, 2023-2030 (US$ Mn)
TABLE 175 South-East Asia Indoor Location Market, By Technology Types, 2017-2022 (US$ Mn)
TABLE 176 South-East Asia Indoor Location Market, By Technology Types, 2023-2030 (US$ Mn)
TABLE 177 South-East Asia Indoor Location Market, By Application, 2017-2022 (US$ Mn)
TABLE 178 South-East Asia Indoor Location Market, By Application, 2023-2030 (US$ Mn)
TABLE 179 South-East Asia Indoor Location Market, By End-Use, 2017-2022 (US$ Mn)
TABLE 180 South-East Asia Indoor Location Market, By End-Use, 2023-2030 (US$ Mn)
TABLE 181 Rest of Asia Pacific Indoor Location Market, By Technology Types, 2017-2022 (US$ Mn)
TABLE 182 Rest of Asia Pacific Indoor Location Market, By Technology Types, 2023-2030 (US$ Mn)
TABLE 183 Rest of Asia Pacific Indoor Location Market, By Application, 2017-2022 (US$ Mn)
TABLE 184 Rest of Asia Pacific Indoor Location Market, By Application, 2023-2030 (US$ Mn)
TABLE 185 Rest of Asia Pacific Indoor Location Market, By End-Use, 2017-2022 (US$ Mn)
TABLE 186 Rest of Asia Pacific Indoor Location Market, By End-Use, 2023-2030 (US$ Mn)
TABLE 187 Latin America Indoor Location Market, By Technology Types, 2017-2022 (US$ Mn)
TABLE 188 Latin America Indoor Location Market, By Technology Types, 2023-2030 (US$ Mn)
TABLE 189 Latin America Indoor Location Market, By Application, 2017-2022 (US$ Mn)
TABLE 190 Latin America Indoor Location Market, By Application, 2023-2030 (US$ Mn)
TABLE 191 Latin America Indoor Location Market, By End-Use, 2017-2022 (US$ Mn)
TABLE 192 Latin America Indoor Location Market, By End-Use, 2023-2030 (US$ Mn)
TABLE 193 Brazil Indoor Location Market, By Technology Types, 2017-2022 (US$ Mn)
TABLE 194 Brazil Indoor Location Market, By Technology Types, 2023-2030 (US$ Mn)
TABLE 195 Brazil Indoor Location Market, By Application, 2017-2022 (US$ Mn)
TABLE 196 Brazil Indoor Location Market, By Application, 2023-2030 (US$ Mn)
TABLE 197 Brazil Indoor Location Market, By End-Use, 2017-2022 (US$ Mn)
TABLE 198 Brazil Indoor Location Market, By End-Use, 2023-2030 (US$ Mn)
TABLE 199 Argentina Indoor Location Market, By Technology Types, 2017-2022 (US$ Mn)
TABLE 200 Argentina Indoor Location Market, By Technology Types, 2023-2030 (US$ Mn)
TABLE 201 Argentina Indoor Location Market, By Application, 2017-2022 (US$ Mn)
TABLE 202 Argentina Indoor Location Market, By Application, 2023-2030 (US$ Mn)
TABLE 203 Argentina Indoor Location Market, By End-Use, 2017-2022 (US$ Mn)
TABLE 204 Argentina Indoor Location Market, By End-Use, 2023-2030 (US$ Mn)
TABLE 205 Rest of Latin America Indoor Location Market, By Technology Types, 2017-2022 (US$ Mn)
TABLE 206 Rest of Latin America Indoor Location Market, By Technology Types, 2023-2030 (US$ Mn)
TABLE 207 Rest of Latin America Indoor Location Market, By Application, 2017-2022 (US$ Mn)
TABLE 208 Rest of Latin America Indoor Location Market, By Application, 2023-2030 (US$ Mn)
TABLE 209 Rest of Latin America Indoor Location Market, By End-Use, 2017-2022 (US$ Mn)
TABLE 210 Rest of Latin America Indoor Location Market, By End-Use, 2023-2030 (US$ Mn)
TABLE 211 Middle EastIndoor Location Market, By Technology Types, 2017-2022 (US$ Mn)
TABLE 212 Middle EastIndoor Location Market, By Technology Types, 2023-2030 (US$ Mn)
TABLE 213 Middle EastIndoor Location Market, By Application, 2017-2022 (US$ Mn)
TABLE 214 Middle EastIndoor Location Market, By Application, 2023-2030 (US$ Mn)
TABLE 215 Middle EastIndoor Location Market, By End-Use, 2017-2022 (US$ Mn)
TABLE 216 Middle EastIndoor Location Market, By End-Use, 2023-2030 (US$ Mn)
TABLE 217 UAEIndoor Location Market, By Technology Types, 2017-2022 (US$ Mn)
TABLE 218 UAEIndoor Location Market, By Technology Types, 2023-2030 (US$ Mn)
TABLE 219 UAEIndoor Location Market, By Application, 2017-2022 (US$ Mn)
TABLE 220 UAEIndoor Location Market, By Application, 2023-2030 (US$ Mn)
TABLE 221 UAEIndoor Location Market, By End-Use, 2017-2022 (US$ Mn)
TABLE 222 UAEIndoor Location Market, By End-Use, 2023-2030 (US$ Mn)
TABLE 223 Saudi ArabiaIndoor Location Market, By Technology Types, 2017-2022 (US$ Mn)
TABLE 224 Saudi ArabiaIndoor Location Market, By Technology Types, 2023-2030 (US$ Mn)
TABLE 225 Saudi ArabiaIndoor Location Market, By Application, 2017-2022 (US$ Mn)
TABLE 226 Saudi ArabiaIndoor Location Market, By Application, 2023-2030 (US$ Mn)
TABLE 227 Saudi ArabiaIndoor Location Market, By End-Use, 2017-2022 (US$ Mn)
TABLE 228 Saudi ArabiaIndoor Location Market, By End-Use, 2023-2030 (US$ Mn)
TABLE 229 Rest of Middle EastIndoor Location Market, By Technology Types, 2017-2022 (US$ Mn)
TABLE 230 Rest of Middle EastIndoor Location Market, By Technology Types, 2023-2030 (US$ Mn)
TABLE 231 Rest of Middle EastIndoor Location Market, By Application, 2017-2022 (US$ Mn)
TABLE 232 Rest of Middle EastIndoor Location Market, By Application, 2023-2030 (US$ Mn)
TABLE 233 Rest of Middle EastIndoor Location Market, By End-Use, 2017-2022 (US$ Mn)
TABLE 234 Rest of Middle EastIndoor Location Market, By End-Use, 2023-2030 (US$ Mn)
TABLE 235 AfricaIndoor Location Market, By Technology Types, 2017-2022 (US$ Mn)
TABLE 236 AfricaIndoor Location Market, By Technology Types, 2023-2030 (US$ Mn)
TABLE 237 AfricaIndoor Location Market, By Application, 2017-2022 (US$ Mn)
TABLE 238 AfricaIndoor Location Market, By Application, 2023-2030 (US$ Mn)
TABLE 239 AfricaIndoor Location Market, By End-Use, 2017-2022 (US$ Mn)
TABLE 240 AfricaIndoor Location Market, By End-Use, 2023-2030 (US$ Mn)
TABLE 241 South AfricaIndoor Location Market, By Technology Types, 2017-2022 (US$ Mn)
TABLE 242 South AfricaIndoor Location Market, By Technology Types, 2023-2030 (US$ Mn)
TABLE 243 South AfricaIndoor Location Market, By Application, 2017-2022 (US$ Mn)
TABLE 244 South AfricaIndoor Location Market, By Application, 2023-2030 (US$ Mn)
TABLE 245 South AfricaIndoor Location Market, By End-Use, 2017-2022 (US$ Mn)
TABLE 246 South AfricaIndoor Location Market, By End-Use, 2023-2030 (US$ Mn)
TABLE 247 EgyptIndoor Location Market, By Technology Types, 2017-2022 (US$ Mn)
TABLE 248 EgyptIndoor Location Market, By Technology Types, 2023-2030 (US$ Mn)
TABLE 249 EgyptIndoor Location Market, By Application, 2017-2022 (US$ Mn)
TABLE 250 EgyptIndoor Location Market, By Application, 2023-2030 (US$ Mn)
TABLE 251 EgyptIndoor Location Market, By End-Use, 2017-2022 (US$ Mn)
TABLE 252 EgyptIndoor Location Market, By End-Use, 2023-2030 (US$ Mn)
TABLE 253 Rest of AfricaIndoor Location Market, By Technology Types, 2017-2022 (US$ Mn)
TABLE 254 Rest of AfricaIndoor Location Market, By Technology Types, 2023-2030 (US$ Mn)
TABLE 255 Rest of AfricaIndoor Location Market, By Application, 2017-2022 (US$ Mn)
TABLE 256 Rest of AfricaIndoor Location Market, By Application, 2023-2030 (US$ Mn)
TABLE 257 Rest of AfricaIndoor Location Market, By End-Use, 2017-2022 (US$ Mn)
TABLE 258 Rest of AfricaIndoor Location Market, By End-Use, 2023-2030 (US$ Mn)

What is the current End-Use of the worldwide Indoor Location Market?

In 2022, the global Indoor Location Market is expected to be worth USD 10845.8 million.

What is the predicted growth rate of the Indoor Location Marketbetween 2023 and 2030?

The Indoor Location Market is estimated to increase at a CAGR of 23.50% between 2023 and 2030, reaching USD 58694.4 Million in 2030.

Which segment has the most market share in terms of Technology Types?

During the forecast period, Bluetooth Low Energy (BLE) technology is likely to have the largest market share

Which end-users  segment governs the market demand for Indoor Location?

The transportation and logistics category retained a large revenue size in the global market in 2022

Which Application segment is predicted to grow at the highest rate over the forecast period?

The proximity category is likely to grow at the fastest CAGR over the forecast period

Who are the major players in the global Indoor Location Market?

The top players include Acuity Brands, AiRISTA, Apple, Azitek, CenTrak, Cisco, Esri, Google, HERE, HID Global, HPE, Infsoft, InnerSpace, Inpixon, Kontakt.io, Mapxus, Microsoft, Mist, Navenio

What are the major market drivers of the Indoor Location industry?

Increasing demand for location-based services and personalized experiences, Advancements in technology, such as IoT and beacon technology and  Growing adoption of indoor location systems in various industries for improved operational efficiency are the key drivers of the market

Asia-Pacific Lyocell Fiber Market

Published:
Report ID: 37592

Asia-Pacific Luxury Vinyl Tiles Flooring Market

Published:
Report ID: 37589

Europe Luxury Vinyl Tiles Flooring Market

Published:
Report ID: 37586

Wood Based Panel Market

Published:
Report ID: 37085

Mobile Crushers Market

Published:
Report ID: 37006

Bamboos Market

Published:
Report ID: 36577

Automotive Webbing Market

Published:
Report ID: 36560

Geosynthetics Market

Published:
Report ID: 36207

Laminated Veneer Lumber Market

Published:
Report ID: 35834

Radiation Shielding Materials Market

Published:
Report ID: 15703

Thermochromic Materials Market

Published:
Report ID: 11162

Smart Mirrors Market

Published:
Report ID: 10279

Purchase Options

$2999
Delivery Format: Excel.
$4999
Designed for the individual purchaser.
$6999
Users located at a single corporate site or regional office.
$7999
Allowed for unlimited sharing globally within one company.
Smallform of Sample request

Have a question?

User Profile

Don’t settle for less – trust Mitul to help you find the best solution.

Report delivery within 24 to 48 hours

– Other Info –

What people say?-

User Review

I am very impressed with the information in this report. The author clearly did their research when they came up with this product and it has already given me a lot of ideas.

Jana Schmidt
CEDAR CX Technologies

– Connect with us –

Phone

+91 6232 49 3207


support

24/7 Research Support


sales@credenceresearch.com

– Research Methodology –

Going beyond the basics: advanced techniques in research methodology

– Trusted By –

Pepshi, LG, Nestle
Motorola, Honeywell, Johnson and johnson
LG Chem, SIEMENS, Pfizer
Unilever, Samsonite, QIAGEN