
Market Overview
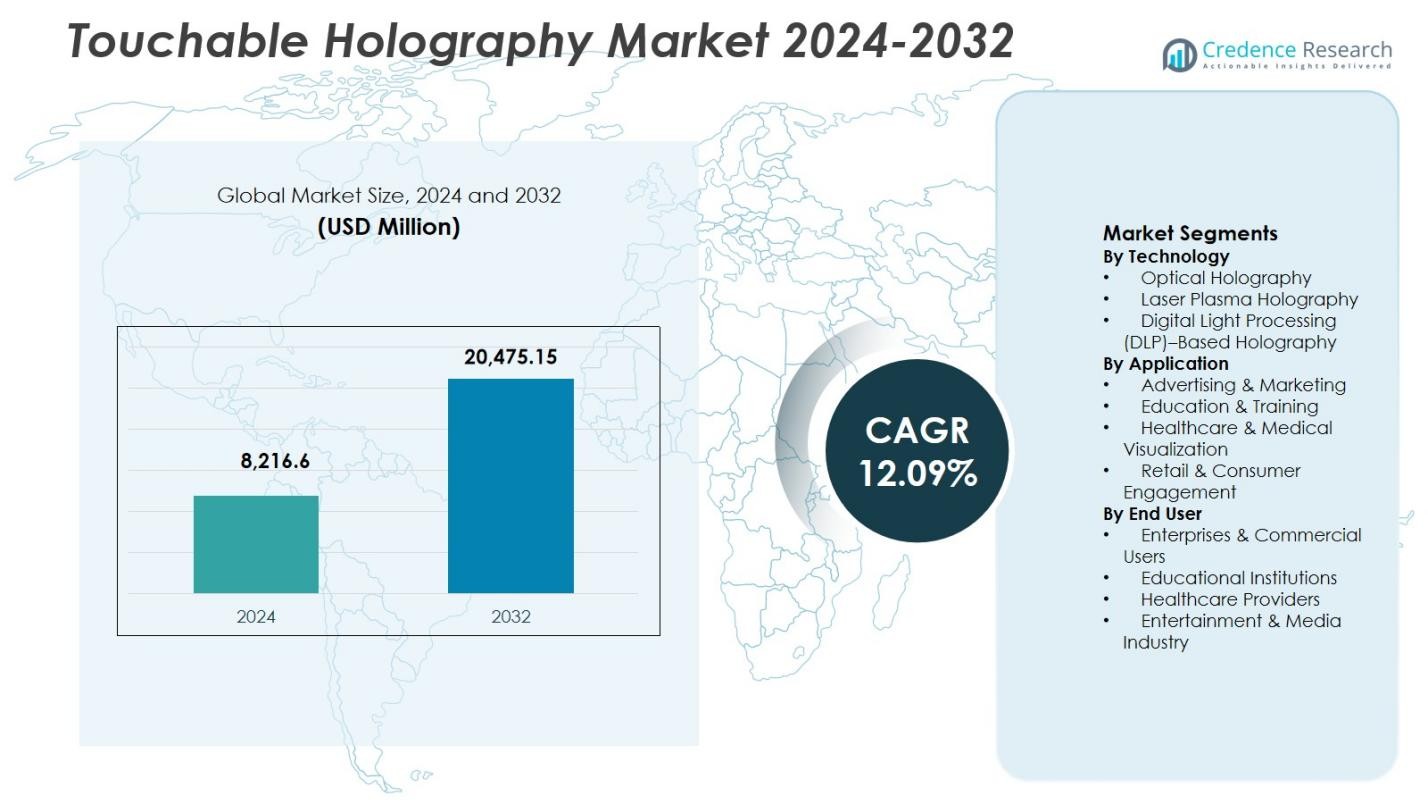
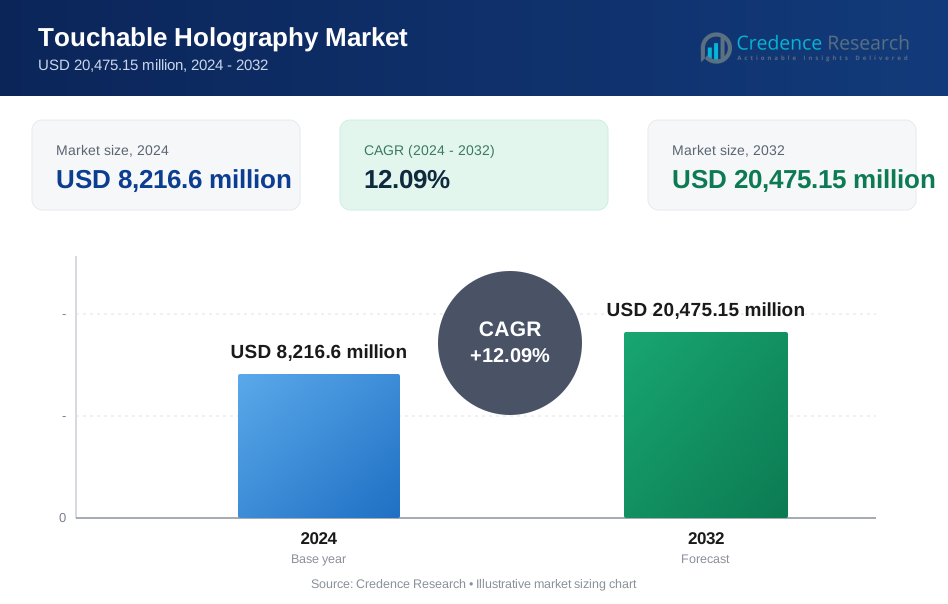
The Touchable Holography Market size was valued at USD 8,216.6 million in 2024 and is anticipated to reach USD 20,475.15 million by 2032, expanding at a CAGR of 12.09% during the forecast period.
| REPORT ATTRIBUTE | DETAILS |
|---|---|
| Historical Period | 2020-2023 |
| Base Year | 2024 |
| Forecast Period | 2025-2032 |
| Touchable Holography Market Size 2024 | USD 8,216.6 Million |
| Touchable Holography Market, CAGR | 12.09% |
| Touchable Holography Market Size 2032 | USD 20,475.15 Million |
Touchable Holography Market features active participation from technology innovators such as AV Concepts, EON Reality Inc., Konica Minolta Inc., Qualcomm, Zebra Imaging, Holoxica Ltd., Musion Das Hologram Ltd., Provision Holdings Inc., RealView Imaging Ltd., and Displair, which focus on advancing interactive display systems, mid-air touch responsiveness, and software integration. These players strengthen market presence through product innovation, application-specific deployments, and strategic partnerships across advertising, healthcare, education, and enterprise sectors. North America leads the Touchable Holography Market with a 36.8% market share, driven by early technology adoption and strong enterprise demand. Europe follows with a 27.4% share, supported by education and healthcare usage, while Asia-Pacific holds a 23.6% share, reflecting rapid adoption in smart retail and digital learning environments.
Market Insights
- Touchable Holography Market was valued at USD 8,216.6 million in 2024 and is projected to grow at a CAGR of 12.09% through the forecast period, driven by rising adoption of immersive interaction technologies.
- Growth of the Touchable Holography Market is supported by increasing demand for interactive visualization across advertising, healthcare, education, and enterprise applications, with Optical Holography leading the technology segment at 46.2% share due to superior clarity and commercial readiness.
- A key trend in the Touchable Holography Market is integration with AI, AR, and advanced gesture-recognition systems, enabling smarter, more personalized user interactions and expanding use cases in smart retail and collaborative environments.
- Market participation is shaped by innovation-focused players emphasizing system integration, content platforms, and mid-air touch accuracy, while high implementation costs and complex content development act as notable restraints.
- Regionally, North America leads with a 36.8% share, followed by Europe at 27.4% and Asia-Pacific at 23.6%, reflecting strong enterprise adoption, digital education investments, and expanding smart retail infrastructure.
Market Segmentation Analysis:
By Technology:
Within the Touchable Holography Market, Optical Holography dominates the technology segment, accounting for 46.2% market share. Its leadership is driven by superior image clarity, stable projection quality, and wider commercial readiness compared with emerging alternatives. Optical holography supports precise mid-air interaction and integrates efficiently with gesture-recognition and haptic feedback systems, making it suitable for advertising, education, and healthcare visualization. Laser Plasma Holography gains attention for futuristic applications, while DLP-based holography benefits from cost efficiency, but optical systems continue to lead due to reliability, scalability, and established deployment across enterprise environments.
- For instance, Axiom Holographics deploys its Hologram Table, which projects interactive 3D models up to 70 cm high using patterned light wave separation for multi-user viewing without headsets. The system supports real-time manipulation of volumetric displays in enterprise settings.
By Application:
Advertising & Marketing represents the dominant application segment in the Touchable Holography Market with a 38.7% market share. This dominance is fueled by strong demand for immersive brand engagement, experiential campaigns, and interactive product demonstrations. Touchable holography enables marketers to deliver high-impact, three-dimensional storytelling that increases audience retention and brand recall. Education & Training and Healthcare & Medical Visualization follow, driven by visualization accuracy and learning efficiency, while Retail & Consumer Engagement expands steadily as smart stores adopt interactive holographic displays to enhance customer experience and engagement metrics.
- For instance, BMW utilized Holoconnects' holographic walls for car advertisements at events, delivering dynamic 3D visuals of vehicle interiors.
By End User:
Enterprises & Commercial Users lead the Touchable Holography Market by end user, holding a 41.5% market share. Large enterprises adopt touchable holography for corporate presentations, product launches, training simulations, and collaborative design environments. Strong investment capacity, innovation focus, and demand for differentiation support dominance of this segment. Educational Institutions and Healthcare Providers show growing adoption for immersive learning and medical visualization, while the Entertainment & Media Industry leverages holography for live events and digital content experiences, contributing to diversified but enterprise-led market expansion.
Key Growth Drivers
Rising Demand for Immersive and Interactive Visualization
The Touchable Holography Market benefits strongly from growing demand for immersive visualization across advertising, retail, education, and enterprise communication. Brands increasingly seek interactive technologies that capture consumer attention and enhance engagement beyond traditional 2D displays. Touchable holography enables users to interact with three-dimensional content in real time, improving information retention and experiential value. This capability drives adoption in product demonstrations, experiential marketing campaigns, training simulations, and exhibitions, positioning touchable holography as a high-impact communication tool across commercial environments.
- For instance, Looking Glass Factory's 16" Spatial OLED display enables hand-wave interactions with a holographic sneaker, transforming its appearance for retail activations and flagship installations.
Advancements in Display, Sensor, and Haptics Technologies
Continuous advancements in display resolution, optical projection systems, motion sensing, and haptic feedback significantly accelerate the Touchable Holography Market. Improvements in digital light processing, laser projection, and mid-air tactile feedback technologies enable more realistic, responsive, and reliable holographic interactions. These innovations enhance visual clarity, reduce latency, and improve user experience, making touchable holographic systems more viable for complex professional applications. As technology maturity increases and integration becomes smoother, adoption expands across healthcare visualization, industrial training, and collaborative design environments.
- For instance, RealView Imaging's Holoscope-i system, cleared by the FDA in 2021, generates real-time 3D interference-based holograms from CT scans and 3D ultrasound data.
Expanding Use in Healthcare and Medical Visualization
Healthcare applications represent a strong growth driver for the Touchable Holography Market due to rising demand for advanced visualization tools. Touchable holography supports interactive 3D viewing of anatomical structures, medical imaging, and surgical planning models. Surgeons, educators, and clinicians use these systems to improve spatial understanding and procedural accuracy. The ability to manipulate holographic images without physical contact also aligns with hygiene and safety requirements in clinical settings, further encouraging adoption in hospitals, medical schools, and research institutions.
Key Trends & Opportunities
Integration with AR, AI, and Smart Digital Ecosystems
A prominent trend in the Touchable Holography Market is integration with augmented reality, artificial intelligence, and smart digital platforms. AI-driven gesture recognition, content personalization, and real-time data processing enhance interactivity and system intelligence. Integration with connected devices and enterprise software allows touchable holography to support collaborative workflows, remote visualization, and data-rich presentations. This trend creates opportunities for solution providers to develop scalable platforms tailored for smart classrooms, digital retail spaces, and enterprise collaboration environments.
- For instance, Microsoft HoloLens employs gesture recognition sensors enabling users to select, move, and manipulate holograms via air tapping, bloom gestures, and pinches without physical contact.
Growing Adoption in Smart Retail and Experiential Marketing
Touchable holography is gaining traction in smart retail and experiential marketing as brands focus on differentiation and customer engagement. Interactive holographic displays enable virtual product exploration, dynamic storytelling, and personalized content delivery. Retailers leverage these systems to enhance in-store experiences, reduce dependency on physical inventory, and collect consumer interaction data. As omnichannel strategies expand and experiential retail investments rise, touchable holography presents strong growth opportunities in premium retail, showrooms, and brand experience centers.
- For instance, HYPERVSN has powered holographic product showcases in Nike and Adidas flagship stores, projecting floating 3D sneakers that shoppers can manipulate via gesture controls.
Key Challenges
High Implementation and Maintenance Costs
High initial investment and ongoing maintenance costs remain a major challenge for the Touchable Holography Market. Advanced projection systems, specialized sensors, and computing infrastructure increase deployment expenses, limiting adoption among small and mid-sized organizations. Additionally, installation complexity and the need for controlled environments add to total ownership costs. These factors slow penetration in price-sensitive markets and constrain broader commercialization, particularly in emerging economies where cost efficiency strongly influences technology adoption decisions.
Technical Limitations and Content Development Complexity
Technical limitations related to scalability, environmental sensitivity, and content development pose challenges for the Touchable Holography Market. Performance can be affected by lighting conditions, space constraints, and calibration requirements. Developing high-quality, interactive 3D holographic content also requires specialized skills and software, increasing project timelines and costs. Limited standardization across platforms further complicates integration, making it challenging for end users to deploy and scale solutions across multiple locations or applications.
Regional Analysis
North America
North America leads the Touchable Holography Market with a 36.8% market share, supported by strong technology adoption and high investment in immersive digital solutions. Enterprises across advertising, healthcare, and corporate training actively deploy touchable holographic systems to enhance engagement and visualization accuracy. The presence of advanced R&D infrastructure, early adoption of AR and AI-integrated platforms, and strong demand from experiential marketing agencies sustain regional dominance. Healthcare institutions increasingly use interactive holography for surgical planning and education, while large enterprises leverage it for product demonstrations and collaborative design, reinforcing North America’s leadership position.
Europe
Europe holds a 27.4% market share in the Touchable Holography Market, driven by rising adoption in education, healthcare, and cultural institutions. Universities and research centers deploy touchable holography for immersive learning and scientific visualization, while hospitals adopt it for anatomical modeling and medical training. Strong emphasis on digital transformation, innovation funding, and smart city initiatives supports steady market growth. Retailers and museums increasingly use holographic interfaces to enhance consumer and visitor engagement. Regulatory focus on digital education and advanced healthcare technologies further strengthens Europe’s position in the global market landscape.
Asia-Pacific
Asia-Pacific accounts for a 23.6% market share in the Touchable Holography Market and represents the fastest-expanding regional ecosystem. Rapid urbanization, expanding digital infrastructure, and strong investments in smart retail and education drive adoption across China, Japan, South Korea, and India. Retail and advertising sectors deploy touchable holography to attract tech-savvy consumers, while educational institutions integrate immersive visualization tools into modern classrooms. Government-backed digital learning initiatives and increasing healthcare technology investments accelerate market penetration, positioning Asia-Pacific as a key growth engine for future market expansion.
Latin America
Latin America captures a 7.1% market share in the Touchable Holography Market, supported by gradual adoption in advertising, retail, and education sectors. Brands increasingly invest in immersive technologies to differentiate customer engagement in shopping malls, exhibitions, and promotional events. Educational institutions explore holographic tools to modernize teaching methods, while healthcare adoption remains at an early stage. Economic recovery, expanding digital connectivity, and rising interest in experiential marketing contribute to steady regional growth. Although adoption remains selective, increasing awareness and infrastructure improvements support long-term market development.
Middle East & Africa
The Middle East & Africa region holds a 5.1% market share in the Touchable Holography Market, driven by investments in smart infrastructure, tourism, and premium retail experiences. Countries in the Gulf region deploy touchable holography in luxury retail, exhibitions, and cultural showcases to enhance visitor engagement. Smart city projects and digital transformation initiatives encourage adoption in education and enterprise environments. While market penetration remains limited compared with mature regions, rising government spending on advanced technologies and innovation hubs supports gradual expansion across selected high-growth economies.
Market Segmentations:
By Technology
- Optical Holography
- Laser Plasma Holography
- Digital Light Processing (DLP)–Based Holography
By Application
- Advertising & Marketing
- Education & Training
- Healthcare & Medical Visualization
- Retail & Consumer Engagement
By End User
- Enterprises & Commercial Users
- Educational Institutions
- Healthcare Providers
- Entertainment & Media Industry
By Geography
- North America
- U.S.
- Canada
- Mexico
- Europe
- Germany
- France
- U.K.
- Italy
- Spain
- Rest of Europe
- Asia Pacific
- China
- Japan
- India
- South Korea
- South-east Asia
- Rest of Asia Pacific
- Latin America
- Brazil
- Argentina
- Rest of Latin America
- Middle East & Africa
- GCC Countries
- South Africa
- Rest of the Middle East and Africa
Competitive Landscape
AV Concepts, EON Reality Inc., Konica Minolta Inc., Qualcomm, Zebra Imaging, Holoxica Ltd., Musion Das Hologram Ltd., Provision Holdings Inc., RealView Imaging Ltd., and Displair form the core competitive ecosystem in the Touchable Holography Market. Companies compete through technology innovation, system integration capabilities, and application-specific solutions rather than price alone. Leading players invest heavily in improving projection quality, mid-air touch responsiveness, and software platforms that support real-time interaction and content customization. Strategic partnerships with advertising agencies, healthcare institutions, and educational organizations strengthen market reach and accelerate adoption. Firms also focus on expanding use cases across medical visualization, immersive learning, and experiential marketing. Product differentiation through enhanced user experience, scalability, and integration with AI and AR platforms remains central to competitive positioning, while geographic expansion and customized deployments support long-term growth strategies.
Key Player Analysis
- AV Concepts
- EON Reality Inc.
- Konica Minolta Inc.
- Qualcomm
- Zebra Imaging
- Holoxica Ltd.
- Musion Das Hologram Ltd.
- Provision Holdings Inc.
- RealView Imaging Ltd.
- Displair
Recent Developments
- In May 2025, Avalon Holographics launched NOVAC, a commercial holographic table display enabling glasses-free group interaction with high-resolution 3D content in the touchable holography market.
- In May 2025, ZEISS and tesa formed a strategic partnership to scale production of large-format holographic films for touchable applications in automotive windshields.
- In September 2024, Trzy Innovationz partnered with Holoconnects to launch the Holobox in India as exclusive distributor, expanding accessible holographic display solutions in the Indian market and enhancing experiential engagement opportunities.
Report Coverage
The research report offers an in-depth analysis based on Technology, Application, End User and Geography. It details leading market players, providing an overview of their business, product offerings, investments, revenue streams, and key applications. Additionally, the report includes insights into the competitive environment, SWOT analysis, current market trends, as well as the primary drivers and constraints. Furthermore, it discusses various factors that have driven market expansion in recent years. The report also explores market dynamics, regulatory scenarios, and technological advancements that are shaping the industry. It assesses the impact of external factors and global economic changes on market growth. Lastly, it provides strategic recommendations for new entrants and established companies to navigate the complexities of the market.
Future Outlook
- The Touchable Holography Market is expected to witness broader adoption as immersive interaction becomes a core requirement across digital experiences.
- Continuous improvements in projection accuracy, gesture recognition, and haptic feedback will enhance system realism and usability.
- Integration with artificial intelligence and augmented reality platforms will enable more intelligent and personalized holographic interactions.
- Demand will increase across education and training as institutions modernize learning through interactive three-dimensional visualization.
- Healthcare applications will expand as touchable holography supports advanced medical imaging, planning, and collaborative diagnostics.
- Retail and advertising will increasingly rely on holographic engagement to differentiate brand experiences and attract consumers.
- Enterprise usage will grow as organizations adopt holography for design collaboration, product visualization, and presentations.
- Hardware miniaturization and improved system efficiency will support easier deployment and scalability.
- Emerging markets will contribute to growth as digital infrastructure and smart environment investments rise.
- Standardization and software ecosystem development will improve interoperability and accelerate long-term market expansion.
Request a Free Sample
Fill in your details and we'll send you a free sample report.
- Sample data tables & charts
- Research methodology
Need a Custom Version of This Report?
Tailor the scope, geography, or segments to your exact requirements.
- Custom geography or segment scope
- Direct access to our analyst team
Frequently Asked Questions
What is the current market size for the Touchable Holography Market, and what is its projected size in 2032?
At what Compound Annual Growth Rate is the Touchable Holography Market projected to grow between 2024 and 2032?
Which Touchable Holography Market segment held the largest share in 2024?
What are the primary factors fueling the growth of the Touchable Holography Market?
Who are the leading companies in the Touchable Holography Market?
Which region commanded the largest share of the Touchable Holography Market in 2024?
Table of Content
Chapter 1. Report Introduction
- 1.1 Report Description & Purpose
- 1.1.1 Report Title & Market Definition
- 1.1.2 Unique Selling Propositions (USP) & Key Differentiators
- 1.1.3 Value Proposition for Stakeholders
- 1.2 Research Objectives
- 1.2.1 Market Sizing Objectives (Volume & Revenue)
- 1.2.2 Segmentation Objectives
- 1.2.3 Competitive Intelligence Objectives
- 1.2.4 Forecast & Scenario Objectives
- 1.3 Report Scope
- 1.3.1 Touchable Holography Scope – Types & Subtypes Covered
- 1.3.2 Geographic Scope – Regions & Countries Covered
- 1.3.3 Historical Period, Base Year & Forecast Period (2024; forecast to 2032)
- 1.3.4 Inclusions & Exclusions
- 1.4 HS Code & Classification Framework
- 1.5 Currency, Units & Pricing Basis
- 1.6 Target Stakeholders
- 1.7 Limitations & Assumptions
Chapter 2. Executive Summary
- 2.1 Global Touchable Holography Market Snapshot
- 2.1.1 Market Size – Historical (2024) & Forecast (2024-2032) (2024: USD 8,216.6 million → 2032: USD 20,475.15 million)
- 2.1.2 Volume & Revenue – Global Totals
- 2.1.3 Key Market Highlights – Top Five Facts
- 2.2 Touchable Holography Market Segmentation Snapshot
- 2.2.1 Market Split by Region – 2024 vs. 2032
- 2.3 Competitive Snapshot
- 2.3.1 Top 10 Players by Revenue Share – 2024
- 2.3.2 Top 10 Players by Volume Share – 2024
- 2.3.3 Recent Strategic Developments (18-Month Summary)
- 2.4 Key Investment Highlights & Strategic Conclusions
Chapter 3. Touchable Holography Market Dynamics & Industry Analysis
- 3.1 Market Overview & Context
- 3.1.1 Touchable Holography Market Position in the Broader Automotive Value Chain
- 3.1.2 OEM vs. Replacement Market Dynamics
- 3.1.3 Market Maturity & Development Stage by Region
- 3.2 Touchable Holography Market Drivers
- 3.3 Touchable Holography Market Restraints & Challenges
- 3.4 Touchable Holography Market Opportunities
- 3.5 Porter's Five Forces Analysis
- 3.5.1 Threat of New Entrants
- 3.5.2 Bargaining Power of Suppliers
- 3.5.3 Bargaining Power of Buyers
- 3.5.4 Threat of Substitutes
- 3.5.5 Competitive Rivalry – Intensity Assessment
- 3.6 Touchable Holography Value Chain Analysis
- 3.6.1 Upstream – Raw Material/Input Suppliers
- 3.6.1.1 Raw Material/Input 1
- 3.6.1.2 Raw Material/Input 2
- 3.6.1.3 Raw Material/Input 3
- 3.6.2 Midstream – Production/Manufacturing/Service Delivery
- 3.6.2.1 Production/Process Overview
- 3.6.2.2 Key Facility Locations & Capacity by Manufacturer
- 3.6.3 Downstream – Distribution & End Consumer
- 3.6.3.1 Primary Channel – B2B/OEM
- 3.6.3.2 Secondary Channels – Dealer, Retail, Online, Direct
- 3.6.4 Value Chain Profitability Analysis
- 3.6.1 Upstream – Raw Material/Input Suppliers
- 3.7 PESTEL Analysis
- 3.7.1 Political Factors
- 3.7.2 Economic Factors
- 3.7.3 Social Factors
- 3.7.4 Technological Factors
- 3.7.5 Environmental Factors
- 3.7.6 Legal Factors
- 3.8 Touchable Holography Supply Chain Analysis
- 3.8.1 Raw Material/Input Supply Risk Assessment
- 3.8.2 Manufacturing Concentration Risk (Geographic Exposure)
- 3.8.3 Trade Disruption Impact Analysis
- 3.9 Regulatory & Policy Landscape
Note: The regulatory and policy landscape section covers regulations based on their applicability to the market, Touchable Holography category, geography, and scope of the study. Only regulatory frameworks with a material impact on operations, compliance, trade, sustainability, or market access are analyzed in detail.
Chapter 4. Key Investment Pockets & Opportunity Analysis
- 4.1 Touchable Holography Market Attractiveness Analysis
- 4.1.1 By Region – Investment Attractiveness Matrix (Volume × CAGR)
- 4.2 Absolute Revenue Growth Opportunity
- 4.2.1 By Region – Absolute USD Growth Through 2032
- 4.3 Incremental Volume Opportunity
- 4.3.1 By Region – Incremental Volume Through 2032
- 4.3.2 Segment – Incremental Volume
- 4.4 Emerging Submarket Opportunity Deep Dive (Subject to Applicability)
- 4.5 Emerging Market Opportunity Scorecards
- 4.5.1 United States
- 4.5.2 Europe
- 4.5.3 Asia
- 4.5.4 Middle East & Africa
Note: Emerging Market Opportunity Scorecards will be included based on relevance and strategic importance. Regions listed are indicative and may vary depending on data availability and market dynamics.
Chapter 5. Touchable Holography Import-Export Analysis & Trade Flows
- 5.1 Global Trade Overview
- 5.1.1 Global Export Value by Country (2024)
- 5.1.2 Global Export Volume by Country (2024)
- 5.1.3 Global Import Value by Country (2024)
- 5.1.4 Global Import Volume by Country (2024)
- 5.1.5 Net Trade Balance by Country (2024)
- 5.2 Export Analysis – Segment
- 5.2.1 Type 1 (HS Code)
- 5.2.2 Type 2 (HS Code)
- 5.2.3 Type 3 (HS Code)
- 5.2.4 Type 4 (HS Code)
- 5.2.5 Type 5 (HS Code)
- 5.3 Import Analysis – Segment
- 5.3.1 Type 1 (HS Code)
- 5.3.2 Type 2 (HS Code)
- 5.3.3 Type 3 (HS Code)
- 5.3.4 Type 4 (HS Code)
- 5.3.5 Type 5 (HS Code)
- 5.4 Average Unit Trade Prices
- 5.4.1 Average Export Price – Segment & Country
- 5.4.2 Average Import Price – Segment & Source Country
- 5.4.3 Price Trends (2024)
- 5.5 Key Trade Route Analysis
- 5.5.1 Trade Route 1
- 5.5.2 Trade Route 2
- 5.5.3 Trade Route 3
- 5.5.4 Trade Route 4
- 5.5.5 Trade Route 5
- 5.6 Trade Policy Impact Assessment
- 5.6.1 US Anti-Dumping & Section 301 Tariffs
- 5.6.2 EU Customs Union Impact
- 5.6.3 Major Free Trade Agreements
- 5.6.4 USMCA Rules of Origin
Note: Trade policy analysis will be included only where relevant to the Touchable Holography market.
Chapter 6. Competitive Landscape & Company Benchmarking
- 6.1 Touchable Holography Market Concentration & Structure
- 6.1.1 Herfindahl-Hirschman Index (HHI) – vs. 2024
- 6.1.2 Tier 1, Tier 2 & Tier 3 Market Structure
- 6.1.3 Global, Regional & Local Player Dynamics
- 6.2 Touchable Holography Market Share Analysis – 2024
- 6.2.1 Global Revenue Share by Company
- 6.2.2 Global Volume Share by Company
- 6.2.3 Regional Revenue Share
- 6.2.4 Market Share Evolution ( vs. 2024)
- 6.2.5 OEM Segment Share by Company
- 6.2.6 Replacement Segment Share by Company
- 6.3 Production/Delivery Capacity & Facility Analysis
- 6.3.1 Global Installed Capacity
- 6.3.2 Capacity Utilization Rates
- 6.3.3 Production/Output Volume
- 6.3.4 Facility Locations & Capacity Map
- 6.3.5 Planned Capacity Additions
- 6.4 Touchable Holography Competitive Benchmarking Matrix
- 6.4.1 Revenue, Volume, CAGR & Profitability Comparison
- 6.4.2 Channel Revenue Mix
- 6.4.3 Geographic Revenue Exposure
- 6.4.4 R&D Intensity
- 6.4.5 Sustainability Maturity
- 6.5 Strategic Developments in Touchable Holography (Last 24 Months)
- 6.5.1 Mergers, Acquisitions & Divestments
- 6.5.2 New Touchable Holography Launches
- 6.5.3 Facility Expansions
- 6.5.4 Strategic Alliances, Joint Ventures & Partnerships
- 6.5.5 Distribution Expansion & Market Entry
- 6.5.6 Sustainability & ESG Initiatives
- 6.6 Competitive Strategy Mapping
- 6.6.1 Leader, Challenger, Follower & Niche Classification
- 6.6.2 Pricing Strategy Comparison
- 6.6.3 Channel Strategy Matrix
Note: Strategic developments are included based on their materiality and the availability of reliable information.
Chapter 7. Global Touchable Holography Market – By Distribution Channel
- 7.1 Segment Overview
- 7.1.1 Volume & Revenue Split by Channel (2024 & 2032)
- 7.1.2 Channel Mix Evolution (2024-2032)
Chapter 8. Regional Market Analysis – Global Overview
- 8.1 Global Regional Overview
- 8.1.1 Regional Volume Share
- 8.1.2 Regional Revenue Share
- 8.1.3 Regional Volume by Region
- 8.1.4 Regional Revenue by Region
- 8.1.5 Regional Forecast Through 2032
- 8.2 Cross-Regional Segment Analysis
- 8.2.1 By Distribution Channel
- 8.2.2 By Brand/Price Tier
Chapter 9. North America Touchable Holography Market
- 9.1 United States
- 9.2 Canada
- 9.3 Mexico
Chapter 10. Europe Touchable Holography Market
- 10.1 Germany
- 10.2 France
- 10.3 Italy
- 10.4 United Kingdom
- 10.5 Spain
- 10.6 Poland
- 10.7 Russia
- 10.8 Netherlands
- 10.9 Belgium
- 10.10 Sweden
- 10.11 Denmark
- 10.12 Norway
- 10.13 Rest of Europe
Chapter 11. Asia Pacific Touchable Holography Market
- 11.1 China
- 11.2 India
- 11.3 Japan
- 11.4 South Korea
- 11.5 Thailand
- 11.6 Indonesia
- 11.7 Vietnam
- 11.8 Malaysia
- 11.9 Australia
- 11.10 Rest of Asia Pacific
Chapter 12. Latin America Touchable Holography Market
- 12.1 Brazil
- 12.2 Argentina
- 12.3 Colombia
- 12.4 Chile
- 12.5 Rest of Latin America
Chapter 13. Middle East Touchable Holography Market
- 13.1 Saudi Arabia
- 13.2 United Arab Emirates
- 13.3 Turkey
- 13.4 Israel
- 13.5 Iran
- 13.6 Rest of the Middle East
Chapter 14. Africa Touchable Holography Market
- 14.1 South Africa
- 14.2 Egypt
- 14.3 Nigeria
- 14.4 Morocco
- 14.5 Rest of Africa
Chapter 15. Touchable Holography Company Profiles
- 15.1 [Company 01]
- 15.1.1 Company Overview
- 15.1.2 Key Management Personnel
- 15.1.3 Products & Services Portfolio
- 15.1.4 Financial Performance
- 15.1.5 Key Market Focus & Geographic Presence
- 15.1.6 Recent Developments & Strategic Initiatives
Note: The company profile list is preliminary and may change based on research findings, market developments, data availability, and client requirements.
Chapter 16. Appendices
- Appendix A – List of Abbreviations & Acronyms
- Appendix B – Industry Classification Code Reference – Full Series
- Appendix C – Production & Capacity Data Tables
- Appendix D – End-Use & Demand Base Tables
- Appendix E – Consumption & Replacement Rate Assumptions
- Appendix F – ASP Reference Tables
- Appendix G – Manufacturing & Facility Database
- Appendix H – Import-Export Data Tables
- Appendix I – Regulatory Summary Tables
- Appendix J – Primary Research Participant List (Anonymized)
- Appendix K – Primary Research Questionnaire Framework
- Appendix L – Data Sources & Bibliography
- Appendix M – Market Size Divergence & Source Comparison
Chapter 17. Research Methodology
- 17.1 Research Framework & Philosophy
- 17.2 Secondary Research – Sources, Hierarchy & Data Extraction
- 17.3 Data Modeling – Bottom-Up & Top-Down Market Sizing
- 17.4 Primary Research – Stakeholder Framework, LOI & Sample Sizes
- 17.5 Forecast Methodology – Regression, Scenario & Sensitivity Analysis
- 17.6 Quality Control – Four-Layer Validation Framework
- 17.7 Limitations & Standard Assumptions
- 17.8 Disclaimer
