
Market Overview
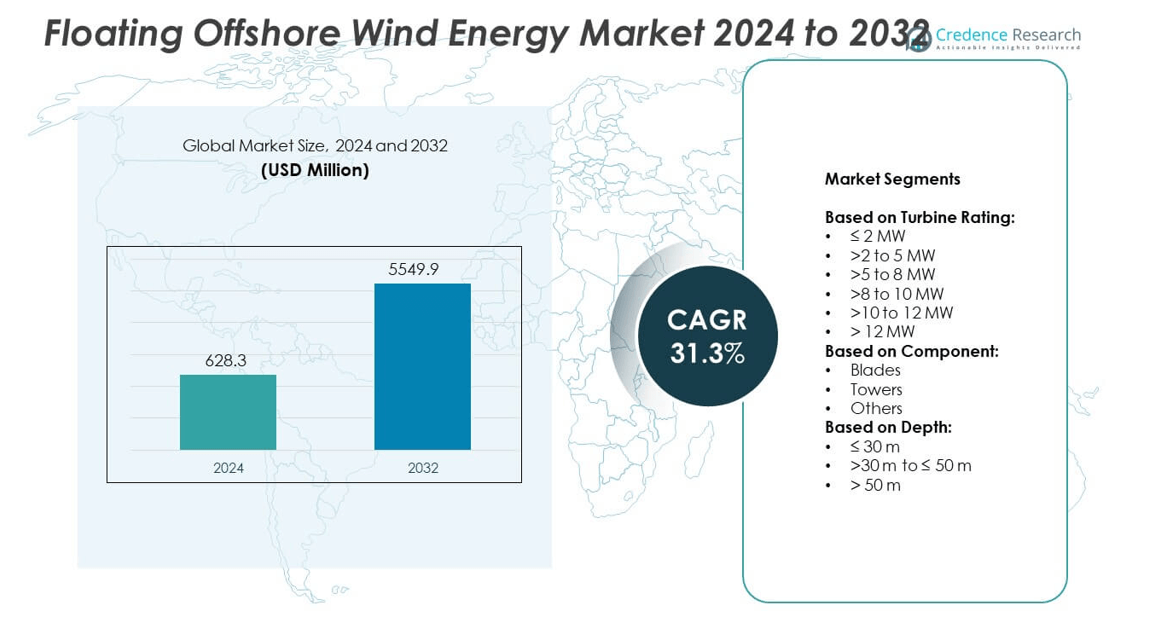
The Floating Offshore Wind Energy Market size was valued at USD 628.3 million in 2024 and is anticipated to reach USD 5,549.9 million by 2032, growing at a CAGR of 31.3% during the forecast period.
| REPORT ATTRIBUTE | DETAILS |
|---|---|
| Historical Period | 2020-2023 |
| Base Year | 2024 |
| Forecast Period | 2025-2032 |
| Floating Offshore Wind Energy Market Size 2024 | USD 628.3 million |
| Floating Offshore Wind Energy Market, CAGR | 31.3% |
| Floating Offshore Wind Energy Market Size 2032 | USD 5,549.9 million |
The Floating Offshore Wind Energy market grows through strong government support, ambitious renewable energy targets, and rising demand for clean power. Technological advancements in large turbines, floating platforms, and digital monitoring improve efficiency and reduce costs. Growing policy incentives and financing frameworks accelerate commercial deployment across deeper waters. Expanding global project pipelines and strategic partnerships enhance scalability and investor confidence. It reflects a clear shift toward sustainable energy solutions while diversifying regional energy portfolios and strengthening long-term market growth.
Europe leads the Floating Offshore Wind Energy market with established infrastructure and strong regulatory support, while North America scales projects through state-led initiatives and federal incentives. Asia-Pacific shows rapid growth, driven by Japan, South Korea, and China investing in deep-water projects. Latin America and the Middle East & Africa remain at early stages but present long-term potential. Key players such as Equinor ASA, Ørsted A/S, Siemens Gamesa Renewable Energy, and Vestas actively shape the market through innovation and global project expansion.
Market Insights
- The Floating Offshore Wind Energy market was valued at USD 628.3 million in 2024 and is projected to reach USD 5,549.9 million by 2032, growing at a CAGR of 31.3%.
- The market is driven by global decarbonization goals, rising demand for renewable power, and strong government incentives supporting offshore wind adoption.
- Technological trends include the adoption of turbines above 12 MW, modular floating platforms, and the use of digital tools for predictive maintenance and performance optimization.
- Competitive dynamics are shaped by leading players focusing on innovation, strategic partnerships, and large-scale project execution in deep-water regions.
- The market faces restraints from high capital costs, limited supply chain readiness, and challenges related to installation, maintenance, and financing risks.
- Regionally, Europe leads with strong policy frameworks and mature infrastructure, North America expands through state and federal support, and Asia-Pacific accelerates growth with investments in Japan, South Korea, and China.
- Latin America and the Middle East & Africa remain in early stages but present emerging opportunities as governments diversify energy portfolios and attract global partnerships.
Market Drivers
Rising Demand for Renewable Energy and Decarbonization Targets
The Floating Offshore Wind Energy market gains strong momentum from global decarbonization commitments. Governments implement aggressive renewable energy targets to reduce reliance on fossil fuels. Offshore wind farms provide scalable clean power with minimal land use conflicts. Floating technology enables deployment in deeper waters, expanding access to stronger wind resources. Countries such as the United States, the United Kingdom, and Japan push projects to meet climate goals. It supports energy transition by diversifying power generation and reducing carbon emissions.
- For instance, Equinor’s Hywind Scotland project delivers 30 MW from five 6 MW turbines and displaces an estimated 63,000 tonnes of carbon emissions annually.
Technological Advancements and Cost Competitiveness
The Floating Offshore Wind Energy market benefits from continuous innovation in turbine size, floating structures, and anchoring systems. Larger turbines with capacities beyond 12 MW deliver higher efficiency and power output. Standardization of components and industrial-scale production reduce capital and operational costs. Improved digital monitoring and predictive maintenance enhance reliability and minimize downtime. Floating foundations such as spar-buoy, semi-submersible, and tension leg platforms open opportunities in challenging seabed conditions. It enables competitive pricing against conventional offshore wind, driving investor interest.
- For instance, GE Vernova's Haliade-X wind turbines are available in several capacities, including a version rated at 14.7 MW, which is certified to produce up to 76 GWh of gross annual energy per unit.
Strong Policy Support and Government Incentives
The Floating Offshore Wind Energy market expands with supportive policies, subsidies, and long-term procurement frameworks. Governments provide tax credits, feed-in tariffs, and auction schemes to encourage private investments. Regulatory bodies streamline permitting processes, which reduces project delays and financing risks. Public funding supports research and pilot projects that validate new designs and materials. Collaboration between governments and industry players ensures faster commercialization. It creates favorable conditions for large-scale deployment across multiple regions.
Expanding Global Project Pipeline and Private Investments
The Floating Offshore Wind Energy market witnesses rapid expansion of project pipelines worldwide. Developers invest heavily in pilot and pre-commercial projects to establish operational track records. Strategic alliances among energy companies, technology providers, and investors accelerate project execution. Financial institutions recognize the long-term stability of offshore wind revenues, unlocking funding opportunities. International oil and gas companies diversify into offshore renewables, leveraging their offshore expertise. It strengthens global supply chains and boosts confidence in market scalability.
Market Trends
Adoption of Larger Turbine Capacities for Higher Efficiency
The Floating Offshore Wind Energy market is witnessing a clear trend toward larger turbine installations. Developers are shifting from 8–10 MW units to next-generation turbines exceeding 12 MW capacity. These turbines deliver greater power output and reduce the cost per megawatt installed. Larger units also optimize space utilization, reducing the number of foundations needed per project. This trend strengthens project economics by improving scalability and lowering maintenance requirements. It positions floating offshore wind as a competitive option in global energy markets.
- For instance, Japan’s METI-backed Goto Floating Offshore Wind Farm is a 16.8 MW capacity project with FIT incentives, though its commercial operation start was delayed from an initial schedule in 2024 to January 2026
Growing Focus on Standardization and Modular Designs
The Floating Offshore Wind Energy market is moving toward standardized and modular floating platforms. Standardized designs reduce costs, speed up construction timelines, and simplify supply chain logistics. Modular platforms allow easier assembly and deployment across different water depths. Industry players adopt semi-submersible and spar-buoy configurations that demonstrate proven scalability. This trend ensures repeatable designs that attract investors by lowering project risks. It helps developers deploy projects more quickly and cost-effectively in new regions.
- For instance, Shell and ScottishPower formed a joint venture in 2022 to develop two floating wind projects, MarramWind (3 GW) and CampionWind (2 GW), for a total of 5 GW capacity in the UK’s ScotWind leasing round. However, in late 2024, Shell announced its intent to exit this venture.
Integration of Digital Technologies for Performance Optimization
The Floating Offshore Wind Energy market is embracing digital innovations such as IoT sensors, predictive analytics, and AI-driven monitoring. Digital systems track turbine performance, structural integrity, and environmental conditions in real time. Predictive maintenance reduces downtime and improves overall project efficiency. Data-driven insights also support resource forecasting and asset optimization. This trend enhances safety by detecting faults early and extending equipment lifespan. It improves operational reliability while reducing costs across large-scale floating wind farms.
Expansion into New Geographies with Deeper Waters
The Floating Offshore Wind Energy market is expanding into regions with deeper waters and stronger wind resources. Europe continues to lead, but Asia-Pacific and North America are rapidly scaling projects. Countries such as Japan, South Korea, and the United States drive early adoption outside Europe. Floating technology enables project deployment where fixed-bottom foundations are not feasible. This trend accelerates global diversification and enhances energy security. It broadens the market’s geographical base and supports long-term growth potential.
Market Challenges Analysis
High Capital Costs and Financing Barriers
The Floating Offshore Wind Energy market faces significant challenges from high upfront investment requirements. Floating platforms, advanced turbines, and specialized installation vessels demand substantial capital compared to fixed-bottom alternatives. Limited track records for large-scale projects make investors cautious, increasing financing risks. Insurance premiums and long payback periods further restrict financial accessibility. Developers struggle to secure competitive funding, especially in emerging markets with limited policy support. It creates financial uncertainty that slows down the pace of commercialization.
Complex Supply Chain and Technical Constraints
The Floating Offshore Wind Energy market encounters hurdles in establishing reliable global supply chains. Specialized components such as floating foundations, mooring systems, and subsea cables are not widely available. Manufacturing bottlenecks, port infrastructure limitations, and lack of skilled labor intensify deployment delays. Harsh offshore conditions also pose risks to durability, installation, and maintenance operations. Developers face high operational costs due to the need for advanced monitoring and repair systems. It limits scalability until supply chains and infrastructure adapt to industry demands.
Market Opportunities
Expansion Potential in Untapped Deep-Water Regions
The Floating Offshore Wind Energy market offers strong opportunities in regions with deep-water coastlines. Countries with limited shallow waters, such as Japan, South Korea, and parts of the U.S., can leverage floating technology to meet renewable energy goals. Offshore areas with high wind intensity provide abundant, consistent energy resources that fixed-bottom foundations cannot access. Advancing designs for semi-submersible and spar-type platforms enable scalability across diverse marine environments. Governments seeking energy independence encourage projects in such geographies through supportive frameworks. It opens large-scale deployment opportunities for developers and technology providers.
Strategic Partnerships and Diversification of Energy Portfolios
The Floating Offshore Wind Energy market benefits from growing collaboration between utilities, oil and gas companies, and technology innovators. Traditional energy firms diversify portfolios by investing in floating wind projects to align with sustainability targets. Partnerships accelerate knowledge transfer, reduce project risks, and strengthen financial viability. Supply chain integration across ports, shipbuilders, and component manufacturers unlocks cost reduction potential. Early adopters gain competitive advantage by establishing operational expertise in this emerging sector. It creates long-term opportunities for stakeholders to capture global market share.
Market Segmentation Analysis:
By Turbine Rating:
The Floating Offshore Wind Energy market shows strong traction in the >10 to 12 MW and >12 MW segments. Larger turbines dominate due to their ability to generate higher output with fewer installations. Developers favor high-capacity turbines to lower the levelized cost of energy and enhance efficiency. The >8 to 10 MW category continues to see demand, especially in early-stage projects and demonstration sites. Smaller segments such as ≤2 MW and >2 to 5 MW are largely limited to pilot projects and nearshore applications. The >5 to 8 MW segment serves as a transitional option in mid-sized farms. It reflects a steady movement toward high-capacity installations for large-scale projects.
- For instance, Siemens Gamesa’s SG 14-222 DD offshore turbine features a 222-meter rotor and generates 25% more energy than its predecessor
By Component:
Blades represent the leading segment driven by their critical role in power generation efficiency. Continuous advancements in blade design and lightweight composite materials increase energy capture and durability. Towers follow as a vital segment, supporting larger turbines and withstanding harsh marine conditions. Developers focus on improving tower height and structural stability to maximize wind potential. The “others” category includes mooring systems, cables, and ancillary parts that ensure structural integrity. These components are essential for floating platforms to remain stable in deeper waters. It highlights the growing demand for integrated systems to improve performance.
- For instance, Principle Power’s WindFloat Atlantic project in Portugal deployed three 8.4 MW turbines on semi-submersible platforms, achieving over 90% availability.
By Depth:
The >50 m category dominates due to the unique advantage of floating platforms in deeper waters. These installations unlock access to high wind resources not reachable with fixed-bottom turbines. The >30 m to ≤50 m segment records steady demand in regions with moderate depth zones. The ≤30 m category remains limited, as fixed-bottom structures are often more economical in shallow waters. Project developers continue to prioritize deep-water potential for long-term scalability. This shift enhances the role of floating systems in diversifying renewable energy portfolios. It strengthens the market’s global expansion into new geographies with favorable offshore conditions.
Segments:
Based on Turbine Rating:
- ≤ 2 MW
- >2 to 5 MW
- >5 to 8 MW
- >8 to 10 MW
- >10 to 12 MW
- > 12 MW
Based on Component:
- Blades
- Towers
- Others
Based on Depth:
- ≤ 30 m
- >30 m to ≤ 50 m
- > 50 m
Based on the Geography:
- North America
- U.S.
- Canada
- Mexico
- Europe
- UK
- France
- Germany
- Italy
- Spain
- Russia
- Belgium
- Netherlands
- Austria
- Sweden
- Poland
- Denmark
- Switzerland
- Rest of Europe
- Asia Pacific
- China
- Japan
- South Korea
- India
- Australia
- Thailand
- Indonesia
- Vietnam
- Malaysia
- Philippines
- Taiwan
- Rest of Asia Pacific
- Latin America
- Brazil
- Argentina
- Peru
- Chile
- Colombia
- Rest of Latin America
- Middle East
- UAE
- KSA
- Israel
- Turkey
- Iran
- Rest of Middle East
- Africa
- Egypt
- Nigeria
- Algeria
- Morocco
- Rest of Africa
Regional Analysis
North America
North America holds a market share of 28% in the Floating Offshore Wind Energy market. The region benefits from strong government commitments to decarbonization and clean energy targets, particularly in the United States. Federal support through tax credits, lease auctions, and offshore wind development programs accelerates adoption. Coastal states such as California and Maine prioritize floating wind technology to access deep-water resources unavailable to fixed-bottom installations. The U.S. Department of Energy invests in pilot projects and research to improve technology readiness and reduce costs. Partnerships between utilities, oil and gas companies, and technology providers strengthen industry collaboration. It positions North America as a leading hub for future large-scale floating offshore wind deployment.
Europe
Europe commands the largest share at 40%, making it the most mature region for floating offshore wind. Countries such as the United Kingdom, France, and Norway spearhead deployment through robust regulatory frameworks and financial incentives. The European Union’s Green Deal and offshore wind strategies accelerate project pipelines across the continent. Established supply chains, advanced infrastructure, and technological expertise contribute to Europe’s leadership. Demonstration projects in Scotland, France, and Norway set benchmarks for global adoption. Developers benefit from regional collaboration and knowledge sharing, further advancing cost reduction. It reinforces Europe’s dominant role as both an innovation hub and a deployment leader in floating offshore wind.
Asia-Pacific
Asia-Pacific holds a market share of 22%, driven by the increasing demand for renewable energy and energy security. Countries such as Japan, South Korea, and Taiwan lead the regional floating wind pipeline with ambitious targets. Japan invests in floating wind to offset limited land availability and nuclear dependence. South Korea emphasizes industrial collaboration, leveraging domestic shipbuilding and offshore engineering capabilities. China expands pilot projects while gradually moving toward larger commercial deployments. Strong regional support aligns with decarbonization targets and growing electricity needs. It establishes Asia-Pacific as one of the fastest-growing markets for floating offshore wind.
Latin America
Latin America accounts for 5% of the Floating Offshore Wind Energy market, reflecting early-stage development. Brazil leads the region with favorable wind resources and a growing renewable energy agenda. National energy policies encourage diversification beyond hydropower, opening space for offshore wind. International developers explore project feasibility along the Brazilian coastline due to deep-water conditions. The region lacks extensive infrastructure but attracts interest from global energy investors. Chile and Colombia assess opportunities to integrate floating wind into future energy mixes. It creates long-term potential for floating offshore wind expansion across Latin America.
Middle East & Africa
The Middle East & Africa region secures a 5% share, reflecting gradual adoption in offshore renewables. South Africa explores offshore wind to diversify its power sector and reduce coal reliance. The Middle East examines floating wind for integration into broader clean energy initiatives alongside solar and hydrogen. High capital costs and limited offshore wind infrastructure remain barriers to rapid growth. International partnerships play a vital role in supporting feasibility studies and pilot projects. Governments recognize floating wind as a pathway to meet carbon reduction targets. It provides early opportunities for strategic growth in offshore renewable development across the region.
Key Player Analysis
- Prysmian Group
- Hexicon
- Vattenfall AB
- Siemens Gamesa Renewable Energy
- Global Energy (Group) Limited
- Nexans
- Equinor ASA
- Simply Blue Group
- Ørsted A/S
- General Electric
- RWE
- Vestas
- Sumitomo Electric Industries, Ltd.
Competitive Analysis
The Floating Offshore Wind Energy market is shaped by leading players such as Equinor ASA, Ørsted A/S, Siemens Gamesa Renewable Energy, Vestas, RWE, Prysmian Group, Nexans, Vattenfall AB, General Electric, Sumitomo Electric Industries Ltd., Simply Blue Group, Hexicon, and Global Energy (Group) Limited. These companies drive advancements in turbine technology, floating foundation design, and grid connectivity, positioning themselves at the forefront of large-scale project development. The market demonstrates intense competition as players leverage partnerships, joint ventures, and pilot projects to strengthen market presence. Technological innovation remains a critical differentiator, with larger turbine capacities and modular floating platforms setting new benchmarks for efficiency and cost reduction. Companies expand global footprints by targeting high-potential regions such as Europe, Asia-Pacific, and North America, where supportive policies create favorable conditions. Strong investment in digital monitoring, predictive maintenance, and integrated supply chains enhances reliability and scalability of projects. Financial strength and access to capital further shape competitiveness, as large-scale projects require significant upfront investments. Players with offshore oil and gas expertise adapt capabilities to floating wind, creating a unique advantage in operations and maintenance. The competitive landscape continues to evolve as firms align with decarbonization targets and capture long-term revenue potential from emerging deep-water markets.
Recent Developments
- In 2025, Equinor progressed its South Korean Firefly/Bandibuli floating wind project, selecting a technology provider for the planned 750 MW site.
- In 2025, Nexans secured a contract for the LanWin2 offshore grid connection in Germany, supporting major offshore and floating wind integration.
- In 2024, GE Vernova announced plans to install a prototype in Norway after securing Nkr332m ($31m) from the Norwegian government-backed agency Enova.
Report Coverage
The research report offers an in-depth analysis based on Turbine Rating, Component, Depth and Geography. It details leading market players, providing an overview of their business, product offerings, investments, revenue streams, and key applications. Additionally, the report includes insights into the competitive environment, SWOT analysis, current market trends, as well as the primary drivers and constraints. Furthermore, it discusses various factors that have driven market expansion in recent years. The report also explores market dynamics, regulatory scenarios, and technological advancements that are shaping the industry. It assesses the impact of external factors and global economic changes on market growth. Lastly, it provides strategic recommendations for new entrants and established companies to navigate the complexities of the market.
Future Outlook
- The Floating Offshore Wind Energy market will expand through large-scale commercial projects in deeper waters.
- Technological improvements in turbines and floating platforms will reduce costs and improve efficiency.
- Governments will continue supporting adoption with favorable policies, subsidies, and auction schemes.
- Energy companies will diversify portfolios by investing in floating wind to meet climate targets.
- Supply chain development will strengthen, improving availability of specialized components and infrastructure.
- Digital tools such as predictive analytics and IoT will enhance performance and reduce downtime.
- Collaborations between oil, gas, and renewable firms will accelerate knowledge sharing and deployment.
- Asia-Pacific will emerge as a strong growth region due to rising energy demand and coastal potential.
- Europe will maintain leadership by scaling projects and setting new technological benchmarks.
- The market will attract increasing investor interest due to stable long-term revenue potential.

Request a Free Sample
Fill in your details and we'll send you a free sample report.
- Sample data tables & charts
- Research methodology
Need a Custom Version of This Report?
Tailor the scope, geography, or segments to your exact requirements.
- Custom geography or segment scope
- Direct access to our analyst team
Frequently Asked Questions
What is the current market size for Floating Offshore Wind Energy market, and what is its projected size in 2032?
Which Floating Offshore Wind Energy market segment held the largest share in 2024?
What are the primary factors fueling the growth of the Floating Offshore Wind Energy market?
ho are the leading companies in the Floating Offshore Wind Energy Market?
Table of Content
Chapter 1 Market Segmentation
- 1.1 Segmentation Framework
- 1.1.1 Product and Service Classification
- 1.1.2 Application and End-Use Classification
- 1.1.3 Technology and Solution Classification
- 1.1.4 Customer and Distribution Channel Classification
- 1.1.5 Geographic Segmentation
- 1.1.6 Market Segment Definitions and Boundaries
Chapter 2 Introduction
- 2.1 Report Objectives and Scope
- 2.2 Product Definition and Industry Terminology
- 2.3 Market Inclusions and Exclusions
- 2.4 Research Process
- 2.4.1 Primary Research and Expert Interviews
- 2.4.2 Secondary Research and Source Review
- 2.4.3 Top-Down and Bottom-Up Estimation
- 2.4.4 Data Triangulation and Verification
- 2.5 Market Size Measurement Basis
- 2.5.1 2024: USD 628.3 million → 2032: USD 5,549.9 million
- 2.6 Historical and Forecast Reference Periods
- 2.6.1 Base Year: 2024
- 2.6.2 Forecast Period: 2024-2032
- 2.7 Research Assumptions and Limitations
Chapter 3 Executive Summary
- 3.1 Market Snapshot and Key Findings
- 3.2 Base-Year Market Size, 2024
- 3.3 Forecast Market Size, 2032
- 3.4 Revenue and Volume Growth Outlook
- 3.5 Key Demand and Supply Indicators
- 3.6 Leading Market Segments
- 3.7 Fastest-Growing Market Opportunities
- 3.8 Regional Performance Highlights
- 3.9 Technology and Industry Transformation
- 3.10 Competitive Landscape Summary
- 3.11 Analyst View and Strategic Implications
Chapter 4 Global Floating Offshore Wind Energy Market Trends and Developments
- 4.1 Historical Industry Development
- 4.2 Recent Market Trends and Developments
- 4.3 Demand and Customer Behavior Trends
- 4.4 Technology and Product Innovation
- 4.5 Artificial Intelligence, Automation and Digitalization
- 4.6 Local Manufacturing and Supply Chain Realignment
- 4.7 Industry Partnerships, Mergers and Acquisitions
- 4.8 Sustainability and Circular Economy Developments
- 4.9 Government and Private Sector Investment Trends
- 4.10 Emerging Business Models and Commercialization
- 4.11 Industry Developments and Announcements
Chapter 5 Global Floating Offshore Wind Energy Market Production, Supply and Demand Analysis
- 5.1 Demand Trend and Consumption Analysis
- 5.2 Demand Forecast, 2024-2032
- 5.3 Production and Output Trend
- 5.4 Production and Output Forecast, 2024-2032
- 5.5 Installed Capacity and Capacity Utilization
- 5.6 Company-Wise Production Plants and Statistics
- 5.6.1 Installed Production Capacity
- 5.6.2 Actual Production
- 5.6.3 Planned Capacity and Expansion Targets
- 5.7 Supply Chain Structure and Procurement Trends
- 5.8 Supply-Demand Gap and Bottlenecks
- 5.9 Import Dependence and Sourcing Structure
- 5.10 Contract Manufacturing and Outsourcing
- 5.11 Regional Supply and Demand Concentration
Chapter 6 Global Floating Offshore Wind Energy Market Pricing Analysis
- 6.1 Pricing Structure and Measurement
- 6.2 Historical Pricing Trends
- 6.3 Pricing Outlook, 2024-2032
- 6.4 Average Selling Price and Unit Economics
- 6.5 Pricing by Product and Market Segment
- 6.6 Geographic Pricing Differences
- 6.7 Key Input, Energy, Labor and Logistics Costs
- 6.8 Contract Pricing and Purchasing Models
- 6.9 Pricing Sensitivity and Competitive Positioning
- 6.10 Price, Margin and Profitability Implications
Chapter 7 Global Floating Offshore Wind Energy Market Dynamics
- 7.1 Market Growth Drivers
- 7.1.1 Demand-Side Drivers
- 7.1.2 Technology and Innovation Drivers
- 7.1.3 Infrastructure and Investment Drivers
- 7.1.4 Regulatory and Policy Drivers
- 7.2 Market Restraints
- 7.2.1 Cost and Affordability Constraints
- 7.2.2 Technology and Adoption Barriers
- 7.2.3 Supply Chain and Operational Constraints
- 7.3 Market Challenges
- 7.3.1 Competitive Pressure and Margin Erosion
- 7.3.2 Skills, Infrastructure and Implementation Gaps
- 7.4 Emerging Market Opportunities
- 7.5 Market Dynamics Impact and Time-Horizon Assessment
Chapter 8 Global Floating Offshore Wind Energy Value Chain Analysis
- 8.1 Industry Value Chain Overview
- 8.2 Upstream Suppliers and Critical Inputs
- 8.3 Technology and Component Providers
- 8.4 Manufacturing or Service Delivery
- 8.5 Distribution, Channel Partners and Integrators
- 8.6 Downstream Applications and End Users
- 8.7 Value Addition and Profit Pools
- 8.8 Vertical Integration and Outsourcing
- 8.9 Supplier Concentration and Risk
- 8.10 Supply Chain Localization and Resilience
Chapter 9 Global Floating Offshore Wind Energy Market Regulations and Policies
- 9.1 Relevant Laws, Standards and Compliance Frameworks
- 9.2 Product, Service, Safety and Quality Requirements
- 9.3 Government Policies, Incentives and Subsidies
- 9.4 Imports, Exports and Trade Barriers
- 9.5 Public Procurement and Local Content Requirements
- 9.6 Environmental and Sustainability Compliance
- 9.7 Upcoming Policy Changes and Market Implications
Chapter 10 Global Floating Offshore Wind Energy Market Hotspots and Opportunities
- 10.1 Market Opportunity Mapping and Growth Hotspots
- 10.2 High-Growth Applications and Customer Groups
- 10.3 Underserved Markets and White-Space Opportunities
- 10.4 Emerging Technology and Product Opportunities
- 10.5 New Capacity and Investment Hotspots
- 10.6 Market Entry and Expansion Opportunities
- 10.7 Distribution and Partnership Opportunities
- 10.8 Near-Term and Long-Term Commercial Potential
- 10.9 Opportunity Attractiveness and Execution Risks
Chapter 11 Global Floating Offshore Wind Energy Market Outlook, 2024-2032
- 11.1 Market Size and Analysis
- 11.1.1 Revenue (Market Measurement: 2024: USD 628.3 million → 2032: USD 5,549.9 million)
- 11.1.2 Market Volume and Quantity Sold
- 11.1.3 Historical Market Size
- 11.1.4 Base-Year Market Size, 2024
- 11.2 Market Forecast, 2024-2032
- 11.2.1 Revenue Forecast to 2032
- 11.2.2 Volume Forecast to 2032
- 11.2.3 CAGR and Year-on-Year Growth
- 11.2.4 Incremental Revenue Opportunity
- 11.3 Forecast Assumptions and Scenario Analysis
- 11.3.1 Base-Case Forecast
- 11.3.2 Optimistic and Conservative Scenarios
- 11.3.3 Technology, Pricing and Policy Sensitivities
- 11.4 Market Attractiveness and Growth Outlook
Chapter 12 Global Floating Offshore Wind Energy Market Segmentation and Outlook
- 12.1 Segmentation Summary and Market Shares, 2024
- 12.2 Largest and Fastest-Growing Segments
- 12.3 Segment Growth Comparison
- 12.4 Segment Attractiveness and Priority Matrix
Chapter 13 Global Floating Offshore Wind Energy Geographic Market Outlook, 2024-2032
- 13.1 Regional Market Size and Share, 2024
- 13.2 Regional Market Forecast, 2024-2032
- 13.3 Regional Pricing, Production and Demand Differences
- 13.4 North America
- 13.4.1 United States
- 13.4.2 Canada
- 13.4.3 Mexico
- 13.5 Europe
- 13.5.1 Germany
- 13.5.2 France
- 13.5.3 Italy
- 13.5.4 United Kingdom
- 13.5.5 Spain
- 13.5.6 Poland
- 13.5.7 Russia
- 13.5.8 Netherlands
- 13.5.9 Belgium
- 13.5.10 Sweden
- 13.5.11 Denmark
- 13.5.12 Norway
- 13.5.13 Rest of Europe
- 13.6 Asia Pacific
- 13.6.1 China
- 13.6.2 India
- 13.6.3 Japan
- 13.6.4 South Korea
- 13.6.5 Thailand
- 13.6.6 Indonesia
- 13.6.7 Vietnam
- 13.6.8 Malaysia
- 13.6.9 Australia
- 13.6.10 Rest of Asia Pacific
- 13.7 Latin America
- 13.7.1 Brazil
- 13.7.2 Argentina
- 13.7.3 Colombia
- 13.7.4 Chile
- 13.7.5 Rest of Latin America
- 13.8 Middle East
- 13.8.1 Saudi Arabia
- 13.8.2 United Arab Emirates
- 13.8.3 Turkey
- 13.8.4 Israel
- 13.8.5 Iran
- 13.8.6 Rest of the Middle East
- 13.9 Africa
- 13.9.1 South Africa
- 13.9.2 Egypt
- 13.9.3 Nigeria
- 13.9.4 Morocco
- 13.9.5 Rest of Africa
- 13.10 Regional Investment, Policy and Supply Chain Differences
- 13.11 Regional Competitive Landscape
- 13.12 Geographic Growth Hotspots
Chapter 14 Global Floating Offshore Wind Energy Technology, Innovation and Sustainability Outlook
- 14.1 Technology Landscape and Maturity
- 14.2 Product, Process and Service Innovation
- 14.3 AI, Automation and Digital Tools in the Industry
- 14.4 Technology Adoption and Performance Benchmarking
- 14.5 Innovation Pipeline and R&D Investment
- 14.6 Patent and Intellectual Property Trends
- 14.7 Energy Efficiency and Resource Management
- 14.8 Sustainability, Recycling and Circularity
- 14.9 Technology Roadmap, 2024-2032
- 14.10 Risks of Obsolescence and Technology Substitution
Chapter 15 Global Floating Offshore Wind Energy Market Key Strategic Imperatives
- 15.1 Growth and Market Entry Priorities
- 15.2 High-Return Products and Segments
- 15.3 Pricing, Profitability and Cost Optimization
- 15.4 Technology Investment and Product Differentiation
- 15.5 Supply Chain Localization and Resilience
- 15.6 Distribution and Customer Acquisition
- 15.7 Partnership, Acquisition and Capacity Strategy
- 15.8 Regional Expansion Priorities
- 15.9 Short-, Medium- and Long-Term Actions
Chapter 16 Competition Outlook
- 16.1 Industry Competition Characteristics
- 16.2 Market Structure and Concentration
- 16.3 Market Share and Competitive Positioning, 2024
- 16.4 Company-Wise Revenue and Product Benchmarking
- 16.5 Production and Service Capacity Benchmarking
- 16.6 Technology, Pricing and Differentiation
- 16.7 Regional Footprint and Distribution Strength
- 16.8 Mergers, Acquisitions and Strategic Alliances
- 16.9 New Entrants and Competitive Threats
- 16.10 Porter's Five Forces and Industry Attractiveness
- 16.11 Competitive Outlook, 2024-2032
Chapter 17 Company Profiles
- 17.1 Company Coverage and Selection Criteria
- 17.2 Leading Market Participants – Standard Profile Structure
- 17.2.1 Business Description
- 17.2.2 Company Ownership and Geographic Presence
- 17.2.3 Product and Service Portfolio
- 17.2.4 Manufacturing and Operating Footprint
- 17.2.5 Production Capacity and Expansion Plans
- 17.2.6 Financial Performance and Investment
- 17.2.7 Market Share and Competitive Position
- 17.2.8 Technology and Innovation Capabilities
- 17.2.9 Strategic Alliances or Partnerships
- 17.2.10 Recent Developments
- 17.2.11 Growth Strategy and Outlook
- 17.3 Other Relevant Market Participants
Note: Every listed company is profiled on the structure shown under the first company. The company list is preliminary and may change based on research findings, market developments, data availability and client requirements.
Chapter 18 Disclaimer
- 18.1 Research and Forecast Disclaimer
- 18.2 Data Source and Estimation Limitations
Note: The depth of individual sections depends on data availability for this market. Volume, capacity, trade and other unit-based metrics are included where applicable.
