
Market Overview
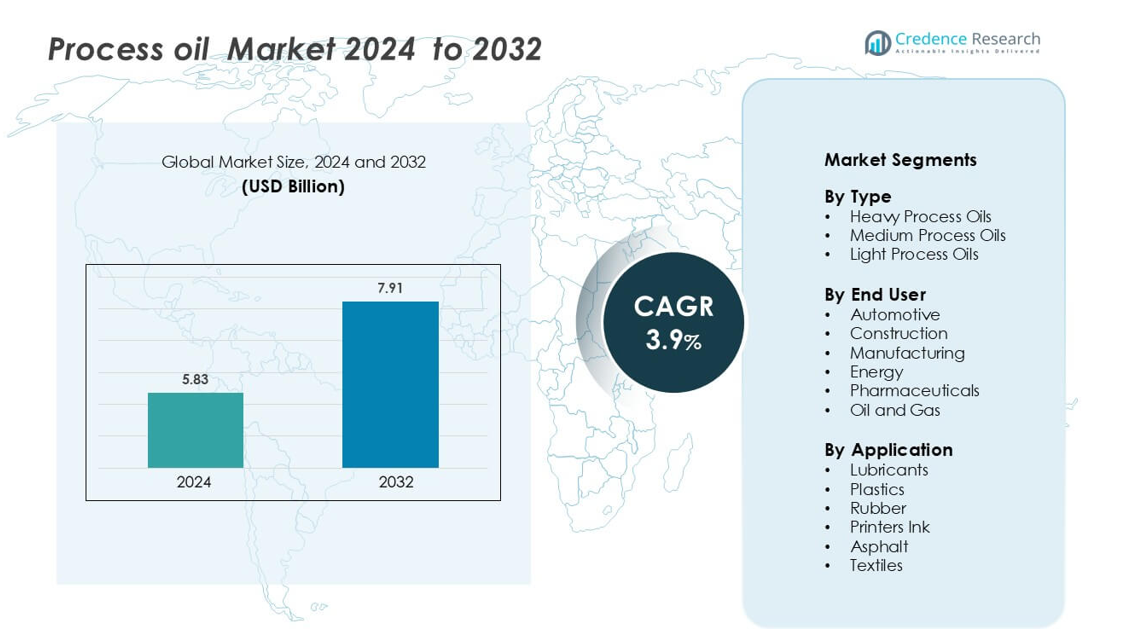
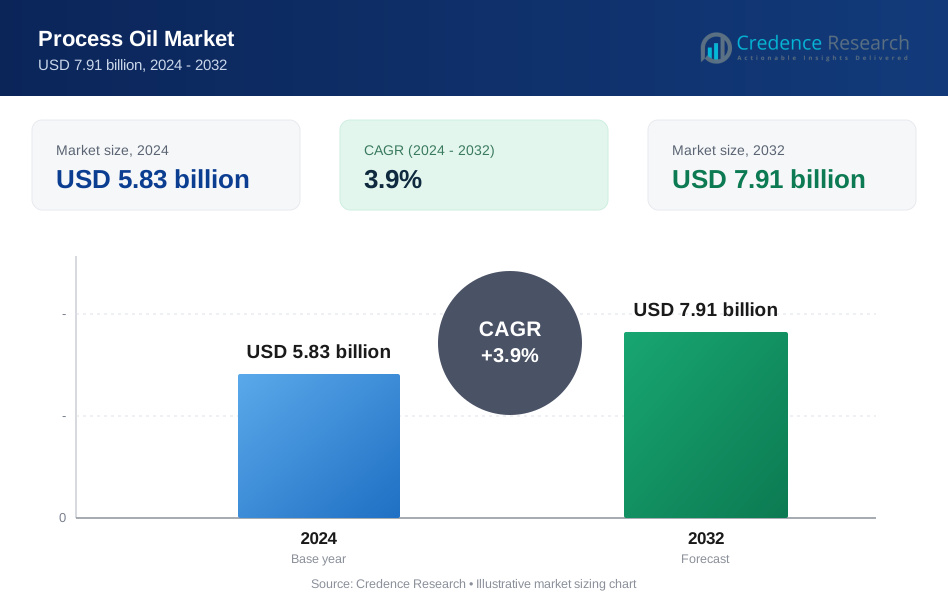
Process Oil Market size was valued USD 5.83 billion in 2024 and is anticipated to reach USD 7.91 billion by 2032, at a CAGR of 3.9 % during the forecast period.
| REPORT ATTRIBUTE | DETAILS |
|---|---|
| Historical Period | 2020-2023 |
| Base Year | 2024 |
| Forecast Period | 2025-2032 |
| Process Oil Market Size 2024 | USD 5.83 billion |
| Process Oil Market, CAGR | 3.9% |
| Process Oil Market Size 2032 | USD 7.91 billion |
The Process Oil Market is characterized by a competitive landscape with several prominent players. Leading companies include Chevron Corporation, Exxon Mobil Corporation, HP Lubricants, Idemitsu Kosan Co. Ltd, LUKOIL, Nynas AB, ORGKHIM Biochemical Holding, Panama Petrochem Ltd, HollyFrontier Refining and Marketing LLC, and Ergon Inc. These companies leverage advanced refining technologies and extensive distribution networks to cater to diverse applications such as rubber processing, lubricants, and plastics. North America holds a significant share of the market, driven by strong demand from the automotive and manufacturing sectors. Asia-Pacific is the fastest-growing region, fueled by rapid industrialization and increasing demand for process oils in emerging economies. Europe maintains a steady market presence, emphasizing sustainable and non-carcinogenic process oil solutions. Companies are focusing on product innovation and strategic partnerships to enhance their market positions and meet evolving industry requirements.
Market Insights
- The Process Oil Market was valued at USD 5.83 billion in 2024 and is projected to reach USD 7.91 billion by 2032, growing at a CAGR of 3.9% during the forecast period.
- Rising demand from automotive, construction, and manufacturing sectors drives growth, as process oils enhance lubrication, thermal stability, and product performance across industrial applications.
- The trend toward bio-based, non-aromatic, and sustainable process oils is accelerating, with manufacturers innovating low-PAH and eco-friendly formulations to comply with environmental regulations.
- The market is highly competitive, led by companies such as Chevron Corporation, Exxon Mobil Corporation, HP Lubricants, Idemitsu Kosan, and LUKOIL, focusing on product diversification, technological advancements, and regional expansion to strengthen their positions.
- North America leads with a 32% market share, followed by Asia-Pacific at 30% and Europe at 28%, while heavy process oils dominate the type segment due to their superior viscosity and thermal stability in automotive and industrial applications
Market Segmentation Analysis:
By Type
In the Process Oil Market, heavy process oils dominate the type segment with the largest market share, driven by their high viscosity and superior thermal stability. These oils are widely used in industrial applications requiring extended lubrication and heat transfer performance. Manufacturers prefer heavy oils for enhancing the durability and efficiency of machinery in harsh operating conditions. Medium and light process oils are also used, but their adoption is limited to specific applications where lower viscosity and quicker absorption are required. Rising demand from automotive and industrial sectors supports the continued preference for heavy process oils.
- For instance, HP Lubricants' HP STEEL 680 grade exhibits a kinematic viscosity of 645–715 cSt at 40°C and a minimum viscosity index of 95, making it suitable for severe rolling conditions in steel mills.
By End User
The automotive segment holds the largest share in the end-user category of the process oil market, driven by the need for high-performance lubricants, hydraulic fluids, and transmission oils. Process oils enhance engine efficiency, reduce friction, and extend equipment life. Construction and manufacturing industries follow closely, leveraging process oils for machinery lubrication and hydraulic operations. Energy and oil and gas sectors contribute through process oil use in refining and power generation. Pharmaceutical applications, though smaller, rely on high-purity process oils for equipment and product consistency, supporting overall market growth.
- For instance, Chevron's Delo® Gold Ultra engine oil shows a kinematic viscosity of 81.21 mm²/s (cSt) at 40°C for the 10W-30 grade and 115 mm²/s (cSt) at 40°C for the 15W-40 grade.
By Application
Lubricants represent the dominant sub-segment in the application category, accounting for the highest market share due to their critical role in reducing wear and tear across machinery and vehicles. Process oils improve viscosity, thermal stability, and operational efficiency in lubricant formulations. Rubber and plastic applications are growing steadily, benefiting from oils’ role in compounding and flexibility enhancement. Asphalt, printer inks, and textiles also utilize process oils to enhance product performance. Rising industrialization and automotive expansion continue to drive strong demand for process oils in lubricant applications globally, supporting market expansion.
Key Growth Drivers
Expansion of End-Use Industries
The process oil market is experiencing significant growth, primarily driven by the expansion of end-use industries such as automotive, construction, and manufacturing. These sectors require high-performance oils for applications like lubricants, hydraulic fluids, and sealants. For instance, the automotive industry's demand for process oils is increasing due to the need for efficient lubrication systems in vehicles. Similarly, the construction sector's growth contributes to the rising demand for process oils used in machinery and equipment. This industrial expansion is particularly evident in regions like Asia-Pacific, where rapid urbanization and industrialization are accelerating the demand for process oils in various applications.
- For instance, Exxon Mobil synthetic oil SHC™ 625 synthetic oil delivers a kinematic viscosity of 46cSt at 40°C and a viscosity index of 161, enabling efficient lubrication in high-temperature industrial systems.
Technological Advancements and Product Innovation
Technological innovations are playing a crucial role in the growth of the process oil market. Manufacturers are investing in research and development to create oils with enhanced properties, such as improved thermal stability, better lubricating capabilities, and reduced environmental impact. For example, the development of bio-based process oils derived from renewable resources is gaining traction as industries seek more sustainable alternatives. These advancements not only meet the evolving performance requirements of various applications but also align with the increasing emphasis on environmental sustainability.
Regulatory Pressures and Environmental Sustainability
Stringent environmental regulations are significantly influencing the process oil market. Regulatory frameworks like the European Union’s REACH regulation are imposing tighter restrictions on acceptable polycyclic aromatic hydrocarbon (PAH) content in process oils. This has led to a shift towards safer paraffinic and naphthenic process oils, which are less harmful to human health and the environment. Manufacturers are responding by developing and adopting non-carcinogenic and biodegradable oils to comply with these regulations and meet the growing consumer demand for eco-friendly products.
- For instance, Nynas AB introduced its NYTRO BIO 300X transformer oil with over 99% renewable carbon content, derived from certified bio-based feedstocks.
Key Trends & Opportunities
Shift Towards Bio-Based and Non-Carcinogenic Oils
There is a notable trend towards the adoption of bio-based and non-carcinogenic process oils in various industries. This shift is driven by increasing environmental awareness and the need to comply with stringent health and safety regulations. Bio-based oils, derived from renewable resources, offer a sustainable alternative to traditional petroleum-based oils. Additionally, non-carcinogenic oils are gaining popularity due to their safer profiles, making them suitable for applications in sensitive industries such as food packaging and pharmaceuticals. This trend presents opportunities for manufacturers to innovate and develop products that align with the growing demand for sustainable and safe process oils.
- For instance, an ISO 14067 LCA is a standard and credible method for calculating a product's carbon footprint. It requires a third party to verify the results.
Growth in Emerging Markets
Emerging markets, particularly in Asia-Pacific, are witnessing rapid industrialization, leading to increased demand for process oils. Countries like China and India are expanding their manufacturing capabilities, driving the need for high-performance oils in applications ranging from automotive to textiles. The growth of these economies presents significant opportunities for market expansion, as industries seek reliable and efficient process oils to support their operations. Companies that can cater to the specific needs of these emerging markets, including cost-effective and locally tailored solutions, are well-positioned to capitalize on this growth.
- For instance, Apar's low-PCA oils (rubber process oils) have a PCA content of less than 3% to meet safety standards.
Integration of Smart Technologies in Process Oil Applications
The integration of smart technologies in process oil applications is an emerging trend that offers new opportunities for the market. The development of smart fluids, which can adapt their properties in response to environmental conditions, is gaining attention. These advanced oils can enhance the performance and efficiency of machinery by providing real-time feedback and adjustments. Additionally, the incorporation of Industry 4.0 principles, such as automation and data analytics, into the production and application of process oils is streamlining operations and improving product quality. This technological advancement opens avenues for innovation and differentiation in the process oil market.
Key Challenges
Volatility in Raw Material Prices
A significant challenge facing the process oil market is the volatility in raw material prices, particularly crude oil. Fluctuations in crude oil prices directly impact the cost of production for process oils, affecting profit margins and pricing strategies. For instance, geopolitical tensions, supply chain disruptions, and changes in global demand can lead to unpredictable shifts in crude oil prices. Manufacturers must navigate these uncertainties by implementing cost-effective sourcing strategies, diversifying supply chains, and exploring alternative raw materials to mitigate the impact of price volatility on their operations.
Environmental and Health Concerns
Environmental and health concerns associated with traditional process oils are posing challenges to market growth. Oils derived from aromatic hydrocarbons may contain polycyclic aromatic hydrocarbons (PAHs), which are harmful to both human health and the environment. Regulatory frameworks such as the European Union’s REACH regulation are imposing tighter restrictions on acceptable PAH content in process oils. This necessitates significant investments in research and development to formulate oils that comply with these stringent regulations while maintaining performance standards. Manufacturers face the dual challenge of ensuring product efficacy and meeting evolving environmental and health standards.
Regional Analysis
North America
North America holds a leading position in the process oil market, accounting for a 32% share, driven by robust automotive, manufacturing, and construction industries. The U.S. and Canada are major consumers, leveraging process oils for lubricants, rubber compounding, and industrial machinery. Stringent environmental regulations have encouraged the adoption of non-aromatic and bio-based process oils, supporting sustainable practices. Technological advancements and the presence of established players enhance production efficiency and quality. Rising demand from the electronics and energy sectors further strengthens the market, positioning North America as a hub for innovation and high-performance process oil applications across multiple industrial segments.
Europe
Europe accounts for a 28% share in the process oil market, led by Germany, France, and the UK. Strong industrialization, advanced manufacturing, and automotive production drive demand for high-performance and specialty process oils. Regulatory frameworks, including REACH compliance, are accelerating the shift toward non-carcinogenic and bio-based oils. The construction and energy sectors also contribute to regional growth through lubricant and asphalt applications. Innovation in multi-purpose and eco-friendly process oils allows companies to cater to both traditional and emerging industries. Europe’s focus on sustainable solutions and high-quality standards sustains its market leadership and supports continued growth.
Asia-Pacific
Asia-Pacific represents the fastest-growing region in the process oil market, holding a 30% share, fueled by rapid industrialization and urbanization in China, India, Japan, and South Korea. Expanding automotive, manufacturing, and construction industries drive robust demand for lubricants, rubber, and plastic processing oils. Local production capacities and investments in advanced process oil technologies enhance regional competitiveness. Increasing energy demand and infrastructure development further propel growth. Manufacturers are focusing on cost-effective and environmentally compliant solutions to meet the needs of emerging economies. Asia-Pacific is poised to remain a key growth engine for the global process oil market in the coming years.
Latin America
Latin America holds a 6% share of the process oil market, with Brazil and Mexico as leading contributors. Growth is supported by expanding automotive, construction, and manufacturing sectors, which require process oils for lubrication, rubber, and plastic applications. Rising industrial activity, coupled with infrastructure development and urbanization, drives steady demand. The adoption of eco-friendly and non-aromatic oils is gradually increasing in response to environmental awareness. Local manufacturers are investing in improving production efficiency and quality standards. Despite moderate market size, Latin America offers opportunities for growth through strategic partnerships and capacity expansion to serve regional and export markets.
Middle East & Africa
The Middle East & Africa accounts for a 4% share in the process oil market, driven by industrial, construction, and oil and gas sectors. Countries such as Saudi Arabia, UAE, and South Africa are investing in infrastructure and energy projects, increasing demand for process oils in lubricants, asphalt, and industrial applications. The region relies heavily on imports for high-quality oils, prompting partnerships with global suppliers. Rising awareness of environmental and safety standards is encouraging gradual adoption of low-PAH and bio-based oils. While growth is moderate, strategic investments and regional industrialization are expected to enhance market penetration over the forecast period.
Market Segmentations:
By Type
- Heavy Process Oils
- Medium Process Oils
- Light Process Oils
By End User
- Automotive
- Construction
- Manufacturing
- Energy
- Pharmaceuticals
- Oil and Gas
By Application
- Lubricants
- Plastics
- Rubber
- Printers Ink
- Asphalt
- Textiles
By Geography
- North America
- U.S.
- Canada
- Mexico
- Europe
- Germany
- France
- U.K.
- Italy
- Spain
- Rest of Europe
- Asia Pacific
- China
- Japan
- India
- South Korea
- South-east Asia
- Rest of Asia Pacific
- Latin America
- Brazil
- Argentina
- Rest of Latin America
- Middle East & Africa
- GCC Countries
- South Africa
- Rest of the Middle East and Africa
Competitive Landscape
The process oil market is characterized by strong competition among major global and regional producers, including Nynas AB, Exxon Mobil Corporation, HP Lubricants, LUKOIL, Chevron Corporation, ORGKHIM Biochemical Holding, Idemitsu Kosan Co. Ltd, Panama Petrochem Ltd, HollyFrontier Refining and Marketing LLC, and Ergon Inc. These companies emphasize product quality, feedstock innovation, and environmental compliance to strengthen their market positions. Leading players are investing in low-aromatic, naphthenic, and bio-based process oils to align with global sustainability and emission regulations. Strategic collaborations, capacity expansions, and advancements in refining technologies enable companies to serve diverse industries, from tire and rubber manufacturing to textiles and plastics. Continuous innovation in viscosity control, oxidation stability, and performance optimization remains central to maintaining competitive advantage. The market also witnesses regional diversification, with Asian producers expanding exports and Western companies focusing on specialty-grade formulations for high-value industrial applications.
Key Player Analysis
- Nynas AB (Sweden)
- Exxon Mobil Corporation (U.S.)
- HP Lubricants (India)
- LUKOIL (Russia)
- Chevron Corporation (U.S.)
- ORGKHIM Biochemical Holding (Russia)
- Idemitsu Kosan Co. Ltd (Japan)
- Panama Petrochem Ltd (India)
- HollyFrontier Refining and Marketing LLC (U.S.)
- Ergon Inc. (U.S.)
Recent Developments
- In February 2025, Sentinel Midstream invested in the U.S. oil export infrastructure with an objective of this venture is to augment oil export capabilities for its Texas GulfLink deepwater oil export project.
- In February 2025, the U.S. sanctions on Russia caused a significant impact on global oil This affected supply chains and promoted alternate sources for refiners.
- In August 2022, Cross Oil and Ergon, Inc., have entered into an offtake and marketing agreement through which process oils will serve as the exclusive marketer and seller of Cross Oil's naphthenic base oils, including Corsol, L-Series, B-Series, CrossTrans, and Ebonite oils. This agreement can help the cross-oil company to strengthen its process oil products
Report Coverage
The research report offers an in-depth analysis based on Type, End-User Application, and Geography. It details leading market players, providing an overview of their business, product offerings, investments, revenue streams, and key applications. Additionally, the report includes insights into the competitive environment, SWOT analysis, current market trends, as well as the primary drivers and constraints. Furthermore, it discusses various factors that have driven market expansion in recent years. The report also explores market dynamics, regulatory scenarios, and technological advancements that are shaping the industry. It assesses the impact of external factors and global economic changes on market growth. Lastly, it provides strategic recommendations for new entrants and established companies to navigate the complexities of the market.
Future Outlook
- The market will expand due to growing demand from automotive and industrial sectors.
- Adoption of bio-based and non-aromatic process oils will increase under sustainability initiatives.
- Technological advancements in refining and blending will improve product performance and consistency.
- Asia-Pacific will remain the fastest-growing region supported by industrialization and urbanization.
- Expansion in lubricant, rubber, and plastic applications will drive overall market growth.
- Regulatory compliance for environmental and health standards will influence product formulation and adoption.
- Strategic collaborations between process oil producers and end-use manufacturers will strengthen supply chains.
- Emerging markets will present opportunities for cost-effective and locally tailored process oil solutions.
- Innovations in multi-functional oils will enhance efficiency across automotive and industrial applications.
- Digital monitoring and smart manufacturing will optimize production, reduce waste, and improve quality.
Request a Free Sample
Fill in your details and we'll send you a free sample report.
- Sample data tables & charts
- Research methodology
Need a Custom Version of This Report?
Tailor the scope, geography, or segments to your exact requirements.
- Custom geography or segment scope
- Direct access to our analyst team
Frequently Asked Questions
What is the current market size for the Process Oil Market, and what is its projected size in 2032?
At what Compound Annual Growth Rate is the Process Oil Market projected to grow between 2025 and 2032
Which Process Oil Market segment held the largest share in 2024?
What are the primary factors fueling the growth of the Process Oil Market?
Who are the leading companies in the Process Oil Market?
Which region commanded the largest share of the Process Oil Market in 2024?
Table of Content
Chapter 1. Report Introduction
- 1.1 Report Description & Purpose
- 1.1.1 Report Title & Market Definition
- 1.1.2 Unique Selling Propositions (USP) & Key Differentiators
- 1.1.3 Value Proposition for Stakeholders
- 1.2 Research Objectives
- 1.2.1 Market Sizing Objectives (Volume & Revenue) (Volume Where Applicable)
- 1.2.2 Segmentation Objectives
- 1.2.3 Competitive Intelligence Objectives
- 1.2.4 Forecast & Scenario Objectives
- 1.3 Report Scope
- 1.3.1 Process Oil Scope – Segments & Subsegments Covered
- 1.3.2 Geographic Scope – Regions & Countries Covered
- 1.3.3 Historical Period, Base Year & Forecast Period (2024; forecast to 2032)
- 1.3.4 Inclusions & Exclusions
- 1.4 Industry Classification & Applicable Codes
- 1.5 Currency, Measurement Units & Valuation Basis
- 1.6 Target Stakeholders
- 1.7 Limitations & Assumptions
Chapter 2. Executive Summary
- 2.1 Global Process Oil Market Snapshot
- 2.1.1 Market Size – Historical (2024) & Forecast (2024-2032) (2024: USD 5.83 billion → 2032: USD 7.91 billion)
- 2.1.2 Volume & Revenue – Global Totals (Volume Where Applicable)
- 2.1.3 Key Market Highlights – Top Five Facts
- 2.2 Process Oil Market Segmentation Snapshot
- 2.2.1 Market Split by Region – 2024 vs. 2032
- 2.3 Competitive Snapshot
- 2.3.1 Top 10 Players by Revenue Share – 2024
- 2.3.2 Top 10 Players by Volume Share – 2024 (Volume Where Applicable)
- 2.3.3 Recent Strategic Developments (18-Month Summary)
- 2.4 Key Investment Highlights & Strategic Conclusions
Chapter 3. Process Oil Market Dynamics & Industry Analysis
- 3.1 Market Overview & Context
- 3.1.1 Process Oil Market Position in the Broader Industry Value Chain
- 3.1.2 Demand Structure & Purchasing Dynamics
- 3.1.3 Market Maturity & Development Stage by Region
- 3.2 Process Oil Market Drivers
- 3.3 Process Oil Market Restraints & Challenges
- 3.4 Process Oil Market Opportunities
- 3.5 Porter's Five Forces Analysis
- 3.5.1 Threat of New Entrants
- 3.5.2 Bargaining Power of Suppliers
- 3.5.3 Bargaining Power of Buyers
- 3.5.4 Threat of Substitutes
- 3.5.5 Competitive Rivalry – Intensity Assessment
- 3.6 Process Oil Value Chain Analysis
- 3.6.1 Upstream – Key Inputs, Resources & Suppliers
- 3.6.1.1 Key Input/Resource 1
- 3.6.1.2 Key Input/Resource 2
- 3.6.1.3 Key Input/Resource 3
- 3.6.2 Midstream – Core Operations & Value Creation
- 3.6.2.1 Operating Model & Process Overview
- 3.6.2.2 Key Operating Locations & Capabilities by Company
- 3.6.3 Downstream – Market Channels & End Users
- 3.6.3.1 Direct Sales & Customer Engagement Channels
- 3.6.3.2 Indirect Sales, Intermediaries & Partner Channels
- 3.6.4 Value Chain Profitability Analysis
- 3.6.1 Upstream – Key Inputs, Resources & Suppliers
- 3.7 PESTEL Analysis
- 3.7.1 Political Factors
- 3.7.2 Economic Factors
- 3.7.3 Social Factors
- 3.7.4 Technological Factors
- 3.7.5 Environmental Factors
- 3.7.6 Legal Factors
- 3.8 Process Oil Supply Chain Analysis
- 3.8.1 Critical Input & Resource Availability Risk Assessment
- 3.8.2 Supplier & Operational Concentration Risk (Geographic Exposure)
- 3.8.3 Supply & Service Disruption Impact Analysis
- 3.9 Regulatory & Policy Landscape
Note: The regulatory and policy landscape section covers regulations based on their applicability to the market, Process Oil category, geography, and scope of the study. Only regulatory frameworks with a material impact on operations, compliance, trade, sustainability, or market access are analyzed in detail.
Chapter 4. Key Investment Pockets & Opportunity Analysis
- 4.1 Process Oil Market Attractiveness Analysis
- 4.1.1 By Region – Investment Attractiveness Matrix (Market Size × CAGR)
- 4.2 Absolute Revenue Growth Opportunity
- 4.2.1 By Region – Absolute Revenue Growth Through 2032
- 4.3 Incremental Demand Opportunity
- 4.3.1 By Region – Incremental Demand Through 2032
- 4.3.2 Segment – Incremental Demand
- 4.4 Emerging Submarket Opportunity Deep Dive (Subject to Applicability)
- 4.5 Priority Market Opportunity Scorecards
- 4.5.1 United States
- 4.5.2 Europe
- 4.5.3 Asia
- 4.5.4 Middle East & Africa
Note: Priority market opportunity scorecards reflect the geographic scope and strategic relevance of the study. Listed markets are indicative and may be adapted to the industry.
Chapter 5. Process Oil Cross-Border Trade & Market Access Analysis
- 5.1 International Trade & Cross-Border Activity Overview
- 5.1.1 Global Export Value by Country (2024)
- 5.1.2 Global Export Volume by Country (2024) (Volume Where Applicable)
- 5.1.3 Global Import Value by Country (2024)
- 5.1.4 Global Import Volume by Country (2024) (Volume Where Applicable)
- 5.1.5 Net Trade Balance by Country (2024)
- 5.2 Export Analysis – Segment
- 5.2.1 Category 1 (Applicable Classification Code)
- 5.2.2 Category 2 (Applicable Classification Code)
- 5.2.3 Category 3 (Applicable Classification Code)
- 5.2.4 Category 4 (Applicable Classification Code)
- 5.2.5 Category 5 (Applicable Classification Code)
- 5.3 Import Analysis – Segment
- 5.3.1 Category 1 (Applicable Classification Code)
- 5.3.2 Category 2 (Applicable Classification Code)
- 5.3.3 Category 3 (Applicable Classification Code)
- 5.3.4 Category 4 (Applicable Classification Code)
- 5.3.5 Category 5 (Applicable Classification Code)
- 5.4 Cross-Border Pricing & Transaction Benchmarks
- 5.4.1 Export Pricing – Segment & Country
- 5.4.2 Import Pricing – Segment & Source Country
- 5.4.3 Price Trends (2024)
- 5.5 Key Cross-Border Trade & Delivery Routes
- 5.5.1 Cross-Border Trade/Delivery Route 1
- 5.5.2 Cross-Border Trade/Delivery Route 2
- 5.5.3 Cross-Border Trade/Delivery Route 3
- 5.5.4 Cross-Border Trade/Delivery Route 4
- 5.5.5 Cross-Border Trade/Delivery Route 5
- 5.6 Trade Policy & Market Access Impact Assessment
- 5.6.1 Tariff & Non-Tariff Barriers
- 5.6.2 Regional Trade & Economic Integration Frameworks
- 5.6.3 Bilateral & Multilateral Trade Agreements
- 5.6.4 Cross-Border Operating, Licensing & Localization Requirements
Note: This chapter applies where cross-border trade or delivery is relevant to Process Oil. Goods, services, and digital offerings are assessed using applicable classifications and transaction measures. Import-export volumes, trade balances, and route analyses are included only where meaningful to the market.
Chapter 6. Competitive Landscape & Company Benchmarking
- 6.1 Process Oil Market Concentration & Structure
- 6.1.1 Herfindahl-Hirschman Index (HHI) – vs. 2024
- 6.1.2 Leading, Mid-Sized & Emerging Player Structure
- 6.1.3 Global, Regional & Local Player Dynamics
- 6.2 Process Oil Market Share Analysis – 2024
- 6.2.1 Global Revenue Share by Company
- 6.2.2 Global Volume Share by Company (Volume Where Applicable)
- 6.2.3 Regional Revenue Share
- 6.2.4 Market Share Evolution ( vs. 2024)
- 6.2.5 Company Market Share by Key Segment
- 6.2.6 Company Market Share by Customer Group
- 6.3 Operating Scale, Capacity & Infrastructure Analysis
- 6.3.1 Global Operating Scale & Supply Capacity
- 6.3.2 Resource Utilization & Operating Efficiency
- 6.3.3 Output, Service Delivery & Activity Metrics
- 6.3.4 Operating Footprint & Infrastructure Map
- 6.3.5 Planned Operational & Capacity Expansion
- 6.4 Process Oil Competitive Benchmarking Matrix
- 6.4.1 Revenue, Growth, Profitability & Operating Metric Comparison
- 6.4.2 Channel Revenue Mix
- 6.4.3 Geographic Revenue Exposure
- 6.4.4 R&D Intensity
- 6.4.5 Sustainability Maturity
- 6.5 Strategic Developments in Process Oil (Last 24 Months)
- 6.5.1 Mergers, Acquisitions & Divestments
- 6.5.2 New Products, Services & Solutions in Process Oil
- 6.5.3 Operational & Infrastructure Expansions
- 6.5.4 Strategic Alliances, Joint Ventures & Partnerships
- 6.5.5 Distribution Expansion & Market Entry
- 6.5.6 Sustainability & ESG Initiatives
- 6.6 Competitive Strategy Mapping
- 6.6.1 Leader, Challenger, Follower & Niche Classification
- 6.6.2 Pricing Strategy Comparison
- 6.6.3 Channel Strategy Matrix
Note: Strategic developments are included based on their materiality and the availability of reliable information.
Chapter 7. Global Process Oil Market – By Sales & Delivery Channel
- 7.1 Segment Overview
- 7.1.1 Volume & Revenue Split by Channel (2024 & 2032) (Volume Where Applicable)
- 7.1.2 Channel Mix Evolution (2024-2032)
Chapter 8. Regional Market Analysis – Global Overview
- 8.1 Global Regional Overview
- 8.1.1 Regional Volume Share (Volume Where Applicable)
- 8.1.2 Regional Revenue Share
- 8.1.3 Regional Volume by Region (Volume Where Applicable)
- 8.1.4 Regional Revenue by Region
- 8.1.5 Regional Forecast Through 2032
- 8.2 Cross-Regional Segment Analysis
- 8.2.1 By Sales & Delivery Channel
- 8.2.2 By Competitive Positioning & Price Tier
Chapter 9. North America Process Oil Market
- 9.1 United States
- 9.2 Canada
- 9.3 Mexico
Chapter 10. Europe Process Oil Market
- 10.1 Germany
- 10.2 France
- 10.3 Italy
- 10.4 United Kingdom
- 10.5 Spain
- 10.6 Poland
- 10.7 Russia
- 10.8 Netherlands
- 10.9 Belgium
- 10.10 Sweden
- 10.11 Denmark
- 10.12 Norway
- 10.13 Rest of Europe
Chapter 11. Asia Pacific Process Oil Market
- 11.1 China
- 11.2 India
- 11.3 Japan
- 11.4 South Korea
- 11.5 Thailand
- 11.6 Indonesia
- 11.7 Vietnam
- 11.8 Malaysia
- 11.9 Australia
- 11.10 Rest of Asia Pacific
Chapter 12. Latin America Process Oil Market
- 12.1 Brazil
- 12.2 Argentina
- 12.3 Colombia
- 12.4 Chile
- 12.5 Rest of Latin America
Chapter 13. Middle East Process Oil Market
- 13.1 Saudi Arabia
- 13.2 United Arab Emirates
- 13.3 Turkey
- 13.4 Israel
- 13.5 Iran
- 13.6 Rest of the Middle East
Chapter 14. Africa Process Oil Market
- 14.1 South Africa
- 14.2 Egypt
- 14.3 Nigeria
- 14.4 Morocco
- 14.5 Rest of Africa
Chapter 15. Process Oil Company Profiles
- 15.1 [Company 01]
- 15.1.1 Company Overview
- 15.1.2 Key Management Personnel
- 15.1.3 Products & Services Portfolio
- 15.1.4 Financial Performance
- 15.1.5 Key Market Focus & Geographic Presence
- 15.1.6 Recent Developments & Strategic Initiatives
Note: The company profile list is preliminary and may change based on research findings, market developments, data availability, and client requirements.
Chapter 16. Appendices
- Appendix A – List of Abbreviations & Acronyms
- Appendix B – Industry Classification Code Reference – Full Series
- Appendix C – Supply, Output & Operating Capacity Data Tables
- Appendix D – End-Use & Demand Base Tables
- Appendix E – Demand, Adoption & Usage Assumptions
- Appendix F – Pricing & Revenue Metric Reference Tables
- Appendix G – Company Operations & Infrastructure Database
- Appendix H – Cross-Border Trade & Activity Data Tables (Where Applicable)
- Appendix I – Regulatory Summary Tables
- Appendix J – Primary Research Participant List (Anonymized)
- Appendix K – Primary Research Questionnaire Framework
- Appendix L – Data Sources & Bibliography
- Appendix M – Market Size Divergence & Source Comparison
Chapter 17. Research Methodology
- 17.1 Research Framework & Philosophy
- 17.2 Secondary Research – Sources, Hierarchy & Data Extraction
- 17.3 Data Modeling – Bottom-Up & Top-Down Market Sizing
- 17.4 Primary Research – Stakeholder Framework, LOI & Sample Sizes
- 17.5 Forecast Methodology – Regression, Scenario & Sensitivity Analysis
- 17.6 Quality Control – Four-Layer Validation Framework
- 17.7 Limitations & Standard Assumptions
- 17.8 Disclaimer
