
Market Overview
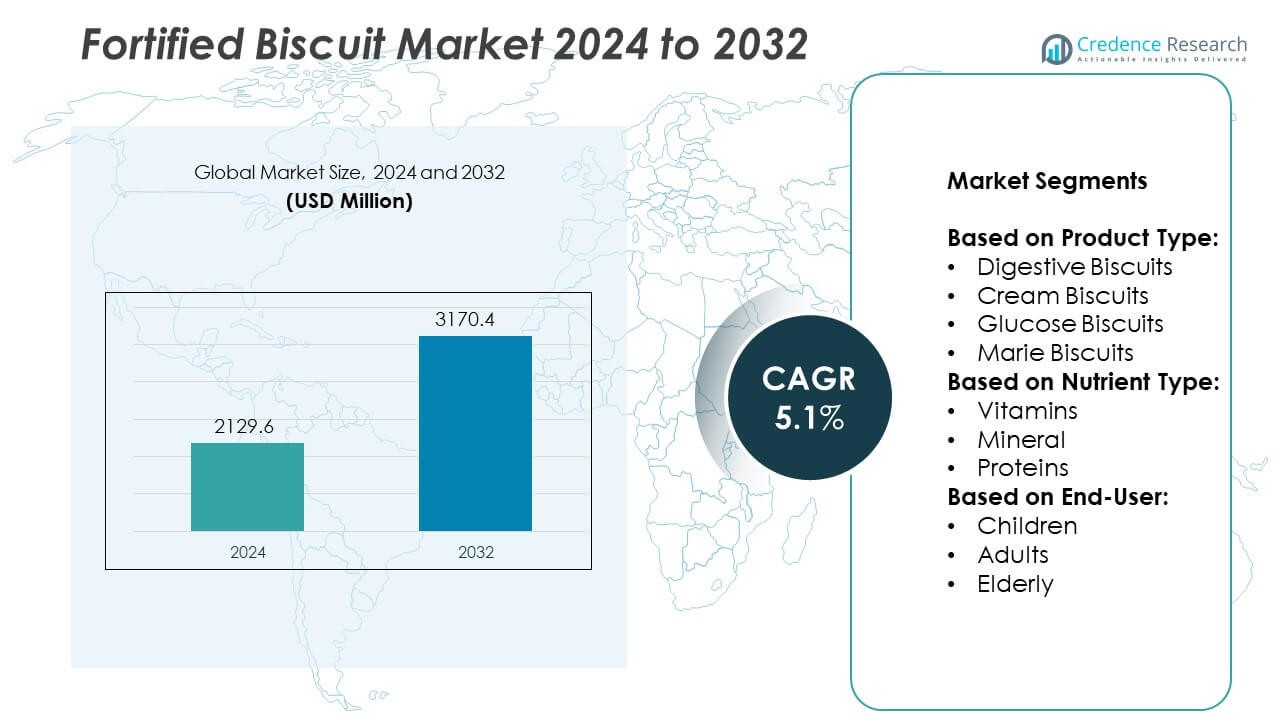
Fortified Biscuit Market size was valued at USD 2129.6 million in 2024 and is anticipated to reach USD 3170.4 million by 2032, at a CAGR of 5.1% during the forecast period.
| REPORT ATTRIBUTE | DETAILS |
|---|---|
| Historical Period | 2020-2024 |
| Base Year | 2024 |
| Forecast Period | 2025-2032 |
| Fortified Biscuit Market Size 2024 | USD 2129.6 Million |
| Fortified Biscuit Market, CAGR | 5.1% |
| Fortified Biscuit Market Size 2032 | USD 3170.4 Million |
The Fortified Biscuit market grows through rising health awareness, increasing prevalence of micronutrient deficiencies, and expanding government nutrition programs. Consumers seek convenient, nutrient-rich snacks that support immunity, energy, and overall wellness. Manufacturers respond with fortified formulations targeting specific demographics such as children and the elderly. Trends include clean label innovations, plant-based ingredients, and region-specific fortification strategies. E-commerce and urban retail expansion boost accessibility and product visibility.
The Fortified Biscuit market shows strong geographical presence across Asia-Pacific, North America, and Europe, with emerging demand in Latin America and the Middle East & Africa. Asia-Pacific leads due to high population density, government-backed nutrition programs, and increasing awareness of micronutrient deficiencies. North America and Europe drive innovation in clean-label, protein-rich, and functional snack formulations tailored to health-conscious consumers. Latin America and MEA regions adopt fortified biscuits as part of public health initiatives and food security strategies. Urbanization, digital retail, and institutional distribution channels support regional growth. Key players shaping the global fortified biscuit landscape include Nestlé.
Market Insights
- The Fortified Biscuit market was valued at USD 2129.6 million in 2024 and is projected to reach USD 3170.4 million by 2032, growing at a CAGR of 5.1% during the forecast period.
- Increasing consumer focus on preventive health and nutrition drives demand for fortified biscuits across both developed and emerging economies.
- Rising trends include the launch of clean-label products, plant-based fortification, and customized nutrition targeting age-specific and condition-specific dietary needs.
- Companies actively compete through product innovation, strategic partnerships, and regional expansions, with key players including Nestlé S.A., Mondelēz International, Britannia Industries, and Parle Products.
- The market faces restraints such as high production costs, supply chain limitations for quality nutrient premixes, and complex regulatory frameworks across regions.
- Asia-Pacific leads the global market due to public health programs and high population density, followed by North America and Europe with strong innovation and retail distribution networks.
- Latin America and the Middle East & Africa show emerging potential, supported by institutional feeding programs and growing urban demand for affordable fortified snack options.
Market Drivers
Rising Prevalence of Micronutrient Deficiencies Among Global Populations
The Fortified Biscuit market gains traction from the growing need to address widespread nutritional deficiencies. Governments and health organizations emphasize micronutrient enrichment in daily diets. Iron, zinc, iodine, and vitamin A deficiencies continue to affect millions, particularly in low- and middle-income countries. Biscuits offer a convenient delivery mechanism for these nutrients. Their long shelf life and mass appeal make them ideal vehicles for public health interventions. It aligns with efforts to combat hidden hunger through affordable, accessible solutions.
- For instance, Nestlé fortified its biscuits with iron and vitamin A through its “Popularly Positioned Products” program, which reached over 115 billion servings of fortified food products globally, contributing to reduced micronutrient deficiencies in key regions.
Expansion of Government-Supported Nutrition and Food Fortification Programs
Public policy support plays a critical role in advancing the Fortified Biscuit market. Governments incorporate fortified foods into school meal programs, maternal health initiatives, and social safety nets. These programs stimulate institutional demand and encourage private sector involvement. Procurement incentives and subsidies help manufacturers scale fortified biscuit production. It creates a stable demand base and fosters collaboration across sectors. Regulatory frameworks further standardize fortification levels and ensure product consistency.
- For instance, Britannia Industries partnered with the Indian government to supply iron- and folic acid-fortified Tiger biscuits through mid-day meal programs, distributing over 30 million packets.
Growing Demand for Convenient, Health-Focused Functional Snack Alternatives
Changing lifestyles and on-the-go eating habits support the growth of the Fortified Biscuit market. Consumers increasingly seek snacks that offer nutritional value beyond basic satiety. Fortified biscuits meet this demand by delivering essential vitamins and minerals in a portable format. Parents view them as a safer alternative to sugar-laden snacks for children. The market benefits from rising awareness about label reading and health claims. It positions fortified biscuits within the broader functional food category.
Rising Participation of Food Manufacturers in Health-Oriented Product Innovation
Private sector innovation enhances product diversity in the Fortified Biscuit market. Companies invest in R&D to develop region-specific formulations and natural fortification methods. Clean label trends drive the inclusion of plant-based, organic, and non-GMO ingredients. Enhanced taste, texture, and nutrient stability improve consumer acceptance. It reflects a strategic shift from compliance-driven fortification to market-driven differentiation. Strategic partnerships with NGOs and health organizations further amplify impact and reach.
Market Trends
Increasing Focus on Tailored Nutritional Profiles for Different Consumer Segments
The Fortified Biscuit market reflects a shift toward targeted nutrition tailored to age, gender, and health condition. Manufacturers design products for children, pregnant women, and the elderly with specific nutrient blends. Vitamin D and calcium-enriched variants cater to bone health, while iron-fortified options address anemia. It allows brands to differentiate offerings within a competitive landscape. Personalization supports both public health goals and private brand positioning. This trend aligns fortified biscuits with modern nutritional science and evolving consumer needs.
- For instance, Kellogg Company introduced Nutri-Grain fortified bars in multiple global markets, including the UK and Australia, each bar fortified with 7 essential vitamins and 2 grams of fiber, expanding their reach to over 20 million consumers seeking functional snacking.
Growing Penetration of Fortified Products Through E-Commerce and Urban Retail Channels
Urbanization and digital commerce expand access to the Fortified Biscuit market across demographics. Consumers in metro cities and semi-urban areas purchase fortified products through online platforms and health-focused retail outlets. E-commerce offers product comparisons, customer reviews, and subscription models that increase repeat purchases. It enables smaller brands to reach wider audiences without extensive physical distribution. Retailers also dedicate shelf space to functional snacks, including fortified biscuits. The shift enhances product visibility and consumer awareness.
- For instance, Mondelēz International's new R&D facility in Singapore, spans over 2,100 square meters and supports more than 100 scientists and technical experts working on fortified snack innovations tailored to regional health demands.
Rising Popularity of Plant-Based and Clean Label Fortified Snack Innovations
Plant-based trends influence innovation strategies in the Fortified Biscuit market. Consumers seek products with natural fortification from superfoods, legumes, or grains. Clean label demand eliminates artificial additives, preservatives, and synthetic nutrients. It encourages manufacturers to adopt alternative fortification techniques that support both efficacy and transparency. Brands promote sustainability and health in tandem, appealing to eco-conscious buyers. Packaging also communicates these values clearly, reinforcing consumer trust.
Integration of Localized Ingredients and Region-Specific Fortification Strategies
Local ingredient sourcing and culturally relevant flavors reshape product development in the Fortified Biscuit market. Companies incorporate millets, pulses, and indigenous grains to enhance nutritional value. Region-specific deficiencies guide the selection of fortifying agents, such as iodine in coastal areas or folic acid in prenatal products. It strengthens market penetration in rural and underserved communities. Localization also improves sensory acceptance and price competitiveness. The approach aligns public health objectives with commercial scalability.
Market Challenges Analysis
Regulatory Complexity and Lack of Standardized Fortification Guidelines Across Regions
The Fortified Biscuit market faces regulatory fragmentation across international and regional borders. Countries differ in their standards for allowable nutrient types, dosages, and labeling requirements. This inconsistency complicates formulation strategies for multinational manufacturers. It increases compliance costs and delays product rollouts in new markets. Small and mid-sized enterprises struggle to navigate these regulations without dedicated legal or scientific teams. The lack of harmonized fortification policies also limits cross-border trade and weakens consumer trust in nutrient claims.
High Production Costs and Supply Chain Constraints Affecting Scalability
Rising raw material prices and the cost of nutrient premixes pose financial hurdles in the Fortified Biscuit market. Fortification often requires specialized processing equipment to ensure nutrient stability and uniformity. These technologies raise capital and operational expenses, especially in regions with limited infrastructure. It reduces margins and limits affordability for low-income populations-the segment most in need of fortified products. Fluctuations in ingredient availability disrupt production continuity. Maintaining nutrient efficacy throughout storage and distribution adds further logistical complexity.
Market Opportunities
Expanding Role of Public Health Partnerships and Institutional Nutrition Programs
Government alliances and nonprofit collaborations create new growth avenues for the Fortified Biscuit market. Public health agencies integrate fortified biscuits into school feeding schemes, emergency relief programs, and maternal nutrition plans. These large-scale initiatives guarantee stable demand and reach underserved populations. It enables manufacturers to scale operations while contributing to national nutrition goals. Co-branded campaigns and awareness efforts increase product credibility and consumption. Institutions seeking shelf-stable, nutrient-dense food formats view fortified biscuits as a practical solution.
Rising Demand for Personalized Fortification and Region-Specific Product Lines
Personalized nutrition trends offer high-impact opportunities in the Fortified Biscuit market. Consumers show growing interest in snacks aligned with individual health needs, such as immunity, cognition, or energy. Companies can respond with modular fortification options or segmented product lines. It creates pathways to premium pricing and brand differentiation. Localized ingredient sourcing and flavor adaptation further boost acceptance in diverse geographies. Markets in Asia, Africa, and Latin America present high potential due to unmet nutritional needs and evolving consumer awareness.
Market Segmentation Analysis:
By Product Type:
The Fortified Biscuit market segments into digestive biscuits, cream biscuits, glucose biscuits, and Marie biscuits. Digestive biscuits lead the segment due to their high fiber content and widespread perception as a healthier snack alternative. They often serve as a base for multinutrient fortification, including iron and B vitamins. Glucose biscuits maintain strong demand in developing economies where affordability and energy density drive consumer preference. Cream biscuits gain traction among children and younger demographics when combined with nutrient-rich fillings. Marie biscuits hold steady market presence in institutional and household consumption due to their mild flavor and compatibility with tea-time routines. It supports balanced demand across age and income groups.
- For instance, Maliban Biscuit Manufactories Limited, a major Sri Lankan biscuit manufacturer producing around 36 million packs per year and commanding over 40% market share in Sri Lanka.
By Nutrient Type:
The Fortified Biscuit market classifies into vitamins, minerals, and proteins. Vitamin-fortified variants dominate due to their relevance in immune support, particularly with nutrients like vitamin A, D, and B-complex. Mineral-fortified biscuits, especially those enriched with iron, zinc, and calcium, address anemia and bone health deficiencies. Protein fortification gains momentum among active adults and elderly consumers seeking muscle maintenance and satiety. It expands the functional value of the biscuit beyond traditional carbohydrate content. Manufacturers tailor nutrient blends based on regional dietary gaps and regulatory guidance. The segment remains responsive to health trends and reformulation requirements.
- For instance, in a school feeding context, studies noted that each child received around 16 iron-fortified Tiger biscuits per month under the Britannia–GAIN–Naandi initiative in Andhra Pradesh.
By End-User:
The Fortified Biscuit market divides into children, adults, and elderly. Children represent the primary consumer base for fortified biscuits distributed through school nutrition programs and home purchases. Their acceptance of flavored and cream-based biscuits makes them ideal for delivering essential vitamins and minerals. Adult consumers increasingly choose fortified snacks for convenience and preventive health management. Elderly consumers benefit from protein- and calcium-rich formulations that support bone density and nutrient absorption. It allows manufacturers to segment marketing strategies and packaging formats to suit different life stages. Each demographic contributes uniquely to market growth and product innovation.
Segments:
Based on Product Type:
- Digestive Biscuits
- Cream Biscuits
- Glucose Biscuits
- Marie Biscuits
Based on Nutrient Type:
- Vitamins
- Mineral
- Proteins
Based on End-User:
- Children
- Adults
- Elderly
Based on the Geography:
- North America
- U.S.
- Canada
- Mexico
- Europe
- UK
- France
- Germany
- Italy
- Spain
- Russia
- Belgium
- Netherlands
- Austria
- Sweden
- Poland
- Denmark
- Switzerland
- Rest of Europe
- Asia Pacific
- China
- Japan
- South Korea
- India
- Australia
- Thailand
- Indonesia
- Vietnam
- Malaysia
- Philippines
- Taiwan
- Rest of Asia Pacific
- Latin America
- Brazil
- Argentina
- Peru
- Chile
- Colombia
- Rest of Latin America
- Middle East
- UAE
- KSA
- Israel
- Turkey
- Iran
- Rest of Middle East
- Africa
- Egypt
- Nigeria
- Algeria
- Morocco
- Rest of Africa
Regional Analysis
North America
North America accounts for 29.4% of the global street sweeper market share, driven by strong municipal budgets, stringent environmental regulations, and advanced urban infrastructure. The United States leads in adoption, with cities prioritizing clean air initiatives and stormwater pollution control. Street sweepers are integral to public works departments for particulate matter reduction and roadway maintenance. High demand exists for regenerative air sweepers and mechanical broom models with low-emission engines and water-efficient dust suppression systems. The market benefits from frequent fleet upgrades and strong service networks. Canada contributes through steady procurement across provinces, with interest growing in hybrid and electric variants. It maintains consistent growth through federal clean transportation programs and sustainability initiatives at the city level.
Europe
Europe holds 26.8% of the global street sweeper market, supported by regulatory alignment with environmental directives such as Euro 6 emission standards and the Green Deal policy framework. Germany, France, and the United Kingdom remain major contributors to street sweeper deployments in both urban and industrial environments. The region adopts compact electric sweepers for historic city centers and pedestrian zones. Municipalities emphasize automation and operator safety, driving the adoption of AI-enabled and sensor-integrated vehicles. It also benefits from partnerships between local governments and OEMs to pilot sustainable fleet solutions. Scandinavian countries and the Netherlands show high preference for zero-emission units to meet carbon neutrality goals.
Asia-Pacific
Asia-Pacific commands 32.1% of the global street sweeper market, making it the largest regional contributor. Rapid urbanization, rising pollution levels, and infrastructure expansion in countries like China and India create strong demand for mechanized street cleaning. Government-backed urban sanitation programs and smart city projects drive large-scale procurement. China dominates regional share through local manufacturing capacity and widespread municipal deployments. India follows with growing adoption in tier-1 and tier-2 cities under the Swachh Bharat Mission. Southeast Asian nations such as Indonesia, Thailand, and Vietnam show emerging interest in compact and fuel-efficient models. It benefits from favorable regulatory support and increasing investment in municipal services.
Latin America
Latin America represents 6.3% of the global street sweeper market, with growth supported by ongoing improvements in public sanitation infrastructure. Brazil, Mexico, and Argentina invest in municipal street sweeping to improve urban hygiene and air quality. Procurement is often influenced by international development funds and public-private partnerships. It remains cost-sensitive, favoring mid-tier mechanical sweepers with basic emission compliance. Interest is rising in refurbished units to extend fleet lifecycles affordably. Municipal reforms and urban expansion offer long-term potential for growth.
Middle East & Africa
The Middle East & Africa region contributes 5.4% to the global street sweeper market, with increasing adoption in the Gulf countries and South Africa. Urban development in Dubai, Riyadh, and Doha supports demand for high-performance and dust control-oriented sweepers. Water scarcity drives adoption of dry sweeping technologies in desert climates. South Africa leads sub-Saharan demand, with municipal investments aimed at improving road cleanliness and public health. It shows gradual uptake due to infrastructure gaps but holds promise with growing urbanization and international collaboration on environmental programs.
Key Player Analysis
- Danone S.A.
- Burton's Biscuit Company
- Britannia Industries Limited
- General Mills, Inc.
- Parle Products Pvt. Ltd.
- Hain Celestial Group, Inc.
- Nestlé S.A.
- United Biscuits (UK) Limited
- PepsiCo, Inc.
- Campbell Soup Company
- Kellogg Company
- Lotus Bakeries NV
- The Kraft Heinz Company
- ITC Limited
- Mondelēz International, Inc.
Competitive Analysis
Leading players in the Fortified Biscuit market include Nestlé S.A., Mondelēz International, Inc., Britannia Industries Limited, Parle Products Pvt. Ltd., and Kellogg Company.These companies maintain strong competitive positions through diversified product portfolios, regional market penetration, and continuous innovation in nutrient-enriched formulations. They invest in R&D to develop biscuits fortified with essential vitamins, minerals, and proteins that meet evolving consumer health needs. Product differentiation remains a key strategy, with brands focusing on clean-label ingredients, natural fortification, and appealing formats for both children and adults. Strategic partnerships with public health agencies, NGOs, and educational institutions help expand distribution through school meal programs and community health initiatives. Leading players leverage large-scale manufacturing capabilities and extensive distribution networks to ensure product availability across urban and rural markets. Marketing efforts emphasize health claims, consumer trust, and functional benefits to boost brand loyalty. These players also respond to regional dietary gaps by customizing formulations based on local nutritional deficiencies, regulatory norms, and taste preferences.
Recent Developments
- In 2024, Lotus Bakeries announced, a strategic partnership with Mondelēz International to expand its Biscoff brand in India and to launch co‑branded chocolate products in the UK and Europe.
- In 2024, Parle Products did indeed expand its fortified biscuit distribution network in Africa. This expansion was part of a broader strategy to increase their market presence and reach in the African continent, leveraging their established distribution capabilities.
- In 2023, Nestlé India inaugurated its tenth manufacturing facility in Odisha, marking a significant expansion into eastern India with an initial investment of ₹900 crore. This facility is part of a larger ₹4,200 crore investment plan for India by 2025.
Market Concentration & Characteristics
The Fortified Biscuit market exhibits moderate to high market concentration, with a mix of global conglomerates and regional players driving competition. It is characterized by strong brand loyalty, wide retail penetration, and government involvement in institutional nutrition programs. Large players dominate through economies of scale, advanced R&D, and integrated supply chains, while local manufacturers compete by offering affordable and culturally tailored products. The market demands consistent compliance with regulatory standards and nutritional labeling, influencing product design and marketing strategies. It operates in a demand-sensitive environment shaped by public health goals, evolving dietary preferences, and awareness campaigns. Consumer trust, formulation transparency, and ingredient sourcing remain critical success factors. The market continues to evolve with innovation in clean-label formulations, personalized nutrition, and sustainable packaging, reflecting changing global health priorities and lifestyle habits. It supports both mass-market and premium segments, offering scalability for volume-driven growth and differentiation for value-added expansion.
Report Coverage
The research report offers an in-depth analysis based on Product Type, Nutrient Type, End-User and Geography. It details leading market players, providing an overview of their business, product offerings, investments, revenue streams, and key applications. Additionally, the report includes insights into the competitive environment, SWOT analysis, current market trends, as well as the primary drivers and constraints. Furthermore, it discusses various factors that have driven market expansion in recent years. The report also explores market dynamics, regulatory scenarios, and technological advancements that are shaping the industry. It assesses the impact of external factors and global economic changes on market growth. Lastly, it provides strategic recommendations for new entrants and established companies to navigate the complexities of the market.
Future Outlook
- Demand for fortified biscuits will increase as consumers prioritize daily nutrition through convenient food formats.
- Manufacturers will focus on clean-label, plant-based, and allergen-free formulations to meet evolving dietary preferences.
- Fortification strategies will become more personalized, targeting specific health conditions and age groups.
- Government-backed school feeding and public health programs will expand the institutional distribution of fortified biscuits.
- Emerging markets in Asia, Africa, and Latin America will offer high growth potential due to large underserved populations.
- E-commerce and direct-to-consumer platforms will play a greater role in product visibility and access.
- Investment in R&D will rise to develop innovative nutrient-delivery systems and enhance taste profiles.
- Regulatory harmonization across regions will improve cross-border trade and formulation consistency.
- Strategic partnerships between food companies and health organizations will accelerate product adoption.
- Sustainability in packaging and ingredient sourcing will become a key factor in consumer purchasing decisions.

Request a Free Sample
Fill in your details and we'll send you a free sample report.
- Sample data tables & charts
- Research methodology
Need a Custom Version of This Report?
Tailor the scope, geography, or segments to your exact requirements.
- Custom geography or segment scope
- Direct access to our analyst team
Frequently Asked Questions
What is the current market size for Fortified Biscuit market, and what is its projected size in 2032?
At what Compound Annual Growth Rate is the Fortified Biscuit Market projected to grow between 2025 and 2032?
Which Fortified Biscuit market segment held the largest share in 2024?
What are the primary factors fueling the growth of the Fortified Biscuit market?
Who are the leading companies in the Fortified Biscuit Market?
Which region commanded the largest share of the Fortified Biscuit market in 2024?
Table of Content
Chapter 1. Report Introduction
- 1.1 Report Description & Purpose
- 1.1.1 Report Title & Market Definition
- 1.1.2 Unique Selling Propositions (USP) & Key Differentiators
- 1.1.3 Value Proposition for Stakeholders
- 1.2 Research Objectives
- 1.2.1 Market Sizing Objectives (Volume & Revenue) (Volume Where Applicable)
- 1.2.2 Segmentation Objectives
- 1.2.3 Competitive Intelligence Objectives
- 1.2.4 Forecast & Scenario Objectives
- 1.3 Report Scope
- 1.3.1 Fortified Biscuit Scope – Segments & Subsegments Covered
- 1.3.2 Geographic Scope – Regions & Countries Covered
- 1.3.3 Historical Period, Base Year & Forecast Period (2024; forecast to 2032)
- 1.3.4 Inclusions & Exclusions
- 1.4 Industry Classification & Applicable Codes
- 1.5 Currency, Measurement Units & Valuation Basis
- 1.6 Target Stakeholders
- 1.7 Limitations & Assumptions
Chapter 2. Executive Summary
- 2.1 Global Fortified Biscuit Market Snapshot
- 2.1.1 Market Size – Historical (2024) & Forecast (2024-2032) (2024: USD 2129.6 million → 2032: USD 3170.4 million)
- 2.1.2 Volume & Revenue – Global Totals (Volume Where Applicable)
- 2.1.3 Key Market Highlights – Top Five Facts
- 2.2 Fortified Biscuit Market Segmentation Snapshot
- 2.2.1 Market Split by Region – 2024 vs. 2032
- 2.3 Competitive Snapshot
- 2.3.1 Top 10 Players by Revenue Share – 2024
- 2.3.2 Top 10 Players by Volume Share – 2024 (Volume Where Applicable)
- 2.3.3 Recent Strategic Developments (18-Month Summary)
- 2.4 Key Investment Highlights & Strategic Conclusions
Chapter 3. Fortified Biscuit Market Dynamics & Industry Analysis
- 3.1 Market Overview & Context
- 3.1.1 Fortified Biscuit Market Position in the Broader Industry Value Chain
- 3.1.2 Demand Structure & Purchasing Dynamics
- 3.1.3 Market Maturity & Development Stage by Region
- 3.2 Fortified Biscuit Market Drivers
- 3.3 Fortified Biscuit Market Restraints & Challenges
- 3.4 Fortified Biscuit Market Opportunities
- 3.5 Porter's Five Forces Analysis
- 3.5.1 Threat of New Entrants
- 3.5.2 Bargaining Power of Suppliers
- 3.5.3 Bargaining Power of Buyers
- 3.5.4 Threat of Substitutes
- 3.5.5 Competitive Rivalry – Intensity Assessment
- 3.6 Fortified Biscuit Value Chain Analysis
- 3.6.1 Upstream – Key Inputs, Resources & Suppliers
- 3.6.1.1 Key Input/Resource 1
- 3.6.1.2 Key Input/Resource 2
- 3.6.1.3 Key Input/Resource 3
- 3.6.2 Midstream – Core Operations & Value Creation
- 3.6.2.1 Operating Model & Process Overview
- 3.6.2.2 Key Operating Locations & Capabilities by Company
- 3.6.3 Downstream – Market Channels & End Users
- 3.6.3.1 Direct Sales & Customer Engagement Channels
- 3.6.3.2 Indirect Sales, Intermediaries & Partner Channels
- 3.6.4 Value Chain Profitability Analysis
- 3.6.1 Upstream – Key Inputs, Resources & Suppliers
- 3.7 PESTEL Analysis
- 3.7.1 Political Factors
- 3.7.2 Economic Factors
- 3.7.3 Social Factors
- 3.7.4 Technological Factors
- 3.7.5 Environmental Factors
- 3.7.6 Legal Factors
- 3.8 Fortified Biscuit Supply Chain Analysis
- 3.8.1 Critical Input & Resource Availability Risk Assessment
- 3.8.2 Supplier & Operational Concentration Risk (Geographic Exposure)
- 3.8.3 Supply & Service Disruption Impact Analysis
- 3.9 Regulatory & Policy Landscape
Note: The regulatory and policy landscape section covers regulations based on their applicability to the market, Fortified Biscuit category, geography, and scope of the study. Only regulatory frameworks with a material impact on operations, compliance, trade, sustainability, or market access are analyzed in detail.
Chapter 4. Key Investment Pockets & Opportunity Analysis
- 4.1 Fortified Biscuit Market Attractiveness Analysis
- 4.1.1 By Region – Investment Attractiveness Matrix (Market Size × CAGR)
- 4.2 Absolute Revenue Growth Opportunity
- 4.2.1 By Region – Absolute Revenue Growth Through 2032
- 4.3 Incremental Demand Opportunity
- 4.3.1 By Region – Incremental Demand Through 2032
- 4.3.2 Segment – Incremental Demand
- 4.4 Emerging Submarket Opportunity Deep Dive (Subject to Applicability)
- 4.5 Priority Market Opportunity Scorecards
- 4.5.1 United States
- 4.5.2 Europe
- 4.5.3 Asia
- 4.5.4 Middle East & Africa
Note: Priority market opportunity scorecards reflect the geographic scope and strategic relevance of the study. Listed markets are indicative and may be adapted to the industry.
Chapter 5. Fortified Biscuit Cross-Border Trade & Market Access Analysis
- 5.1 International Trade & Cross-Border Activity Overview
- 5.1.1 Global Export Value by Country (2024)
- 5.1.2 Global Export Volume by Country (2024) (Volume Where Applicable)
- 5.1.3 Global Import Value by Country (2024)
- 5.1.4 Global Import Volume by Country (2024) (Volume Where Applicable)
- 5.1.5 Net Trade Balance by Country (2024)
- 5.2 Export Analysis – Segment
- 5.2.1 Category 1 (Applicable Classification Code)
- 5.2.2 Category 2 (Applicable Classification Code)
- 5.2.3 Category 3 (Applicable Classification Code)
- 5.2.4 Category 4 (Applicable Classification Code)
- 5.2.5 Category 5 (Applicable Classification Code)
- 5.3 Import Analysis – Segment
- 5.3.1 Category 1 (Applicable Classification Code)
- 5.3.2 Category 2 (Applicable Classification Code)
- 5.3.3 Category 3 (Applicable Classification Code)
- 5.3.4 Category 4 (Applicable Classification Code)
- 5.3.5 Category 5 (Applicable Classification Code)
- 5.4 Cross-Border Pricing & Transaction Benchmarks
- 5.4.1 Export Pricing – Segment & Country
- 5.4.2 Import Pricing – Segment & Source Country
- 5.4.3 Price Trends (2024)
- 5.5 Key Cross-Border Trade & Delivery Routes
- 5.5.1 Cross-Border Trade/Delivery Route 1
- 5.5.2 Cross-Border Trade/Delivery Route 2
- 5.5.3 Cross-Border Trade/Delivery Route 3
- 5.5.4 Cross-Border Trade/Delivery Route 4
- 5.5.5 Cross-Border Trade/Delivery Route 5
- 5.6 Trade Policy & Market Access Impact Assessment
- 5.6.1 Tariff & Non-Tariff Barriers
- 5.6.2 Regional Trade & Economic Integration Frameworks
- 5.6.3 Bilateral & Multilateral Trade Agreements
- 5.6.4 Cross-Border Operating, Licensing & Localization Requirements
Note: This chapter applies where cross-border trade or delivery is relevant to Fortified Biscuit. Goods, services, and digital offerings are assessed using applicable classifications and transaction measures. Import-export volumes, trade balances, and route analyses are included only where meaningful to the market.
Chapter 6. Competitive Landscape & Company Benchmarking
- 6.1 Fortified Biscuit Market Concentration & Structure
- 6.1.1 Herfindahl-Hirschman Index (HHI) – the historical period vs. 2024
- 6.1.2 Leading, Mid-Sized & Emerging Player Structure
- 6.1.3 Global, Regional & Local Player Dynamics
- 6.2 Fortified Biscuit Market Share Analysis – 2024
- 6.2.1 Global Revenue Share by Company
- 6.2.2 Global Volume Share by Company (Volume Where Applicable)
- 6.2.3 Regional Revenue Share
- 6.2.4 Market Share Evolution (the historical period vs. 2024)
- 6.2.5 Company Market Share by Key Segment
- 6.2.6 Company Market Share by Customer Group
- 6.3 Operating Scale, Capacity & Infrastructure Analysis
- 6.3.1 Global Operating Scale & Supply Capacity
- 6.3.2 Resource Utilization & Operating Efficiency
- 6.3.3 Output, Service Delivery & Activity Metrics
- 6.3.4 Operating Footprint & Infrastructure Map
- 6.3.5 Planned Operational & Capacity Expansion
- 6.4 Fortified Biscuit Competitive Benchmarking Matrix
- 6.4.1 Revenue, Growth, Profitability & Operating Metric Comparison
- 6.4.2 Channel Revenue Mix
- 6.4.3 Geographic Revenue Exposure
- 6.4.4 R&D Intensity
- 6.4.5 Sustainability Maturity
- 6.5 Strategic Developments in Fortified Biscuit (Last 24 Months)
- 6.5.1 Mergers, Acquisitions & Divestments
- 6.5.2 New Products, Services & Solutions in Fortified Biscuit
- 6.5.3 Operational & Infrastructure Expansions
- 6.5.4 Strategic Alliances, Joint Ventures & Partnerships
- 6.5.5 Distribution Expansion & Market Entry
- 6.5.6 Sustainability & ESG Initiatives
- 6.6 Competitive Strategy Mapping
- 6.6.1 Leader, Challenger, Follower & Niche Classification
- 6.6.2 Pricing Strategy Comparison
- 6.6.3 Channel Strategy Matrix
Note: Strategic developments are included based on their materiality and the availability of reliable information.
Chapter 7. Global Fortified Biscuit Market – By Sales & Delivery Channel
- 7.1 Segment Overview
- 7.1.1 Volume & Revenue Split by Channel (2024 & 2032) (Volume Where Applicable)
- 7.1.2 Channel Mix Evolution (2024-2032)
Chapter 8. Regional Market Analysis – Global Overview
- 8.1 Global Regional Overview
- 8.1.1 Regional Volume Share (Volume Where Applicable)
- 8.1.2 Regional Revenue Share
- 8.1.3 Regional Volume by Region (Volume Where Applicable)
- 8.1.4 Regional Revenue by Region
- 8.1.5 Regional Forecast Through 2032
- 8.2 Cross-Regional Segment Analysis
- 8.2.1 By Sales & Delivery Channel
- 8.2.2 By Competitive Positioning & Price Tier
Chapter 9. North America Fortified Biscuit Market
- 9.1 United States
- 9.2 Canada
- 9.3 Mexico
Chapter 10. Europe Fortified Biscuit Market
- 10.1 Germany
- 10.2 France
- 10.3 Italy
- 10.4 United Kingdom
- 10.5 Spain
- 10.6 Poland
- 10.7 Russia
- 10.8 Netherlands
- 10.9 Belgium
- 10.10 Sweden
- 10.11 Denmark
- 10.12 Norway
- 10.13 Rest of Europe
Chapter 11. Asia Pacific Fortified Biscuit Market
- 11.1 China
- 11.2 India
- 11.3 Japan
- 11.4 South Korea
- 11.5 Thailand
- 11.6 Indonesia
- 11.7 Vietnam
- 11.8 Malaysia
- 11.9 Australia
- 11.10 Rest of Asia Pacific
Chapter 12. Latin America Fortified Biscuit Market
- 12.1 Brazil
- 12.2 Argentina
- 12.3 Colombia
- 12.4 Chile
- 12.5 Rest of Latin America
Chapter 13. Middle East Fortified Biscuit Market
- 13.1 Saudi Arabia
- 13.2 United Arab Emirates
- 13.3 Turkey
- 13.4 Israel
- 13.5 Iran
- 13.6 Rest of the Middle East
Chapter 14. Africa Fortified Biscuit Market
- 14.1 South Africa
- 14.2 Egypt
- 14.3 Nigeria
- 14.4 Morocco
- 14.5 Rest of Africa
Chapter 15. Fortified Biscuit Company Profiles
- 15.1 [Company 01]
- 15.1.1 Company Overview
- 15.1.2 Key Management Personnel
- 15.1.3 Products & Services Portfolio
- 15.1.4 Financial Performance
- 15.1.5 Key Market Focus & Geographic Presence
- 15.1.6 Recent Developments & Strategic Initiatives
Note: The company profile list is preliminary and may change based on research findings, market developments, data availability, and client requirements.
Chapter 16. Appendices
- Appendix A – List of Abbreviations & Acronyms
- Appendix B – Industry Classification Code Reference – Full Series
- Appendix C – Supply, Output & Operating Capacity Data Tables
- Appendix D – End-Use & Demand Base Tables
- Appendix E – Demand, Adoption & Usage Assumptions
- Appendix F – Pricing & Revenue Metric Reference Tables
- Appendix G – Company Operations & Infrastructure Database
- Appendix H – Cross-Border Trade & Activity Data Tables (Where Applicable)
- Appendix I – Regulatory Summary Tables
- Appendix J – Primary Research Participant List (Anonymized)
- Appendix K – Primary Research Questionnaire Framework
- Appendix L – Data Sources & Bibliography
- Appendix M – Market Size Divergence & Source Comparison
Chapter 17. Research Methodology
- 17.1 Research Framework & Philosophy
- 17.2 Secondary Research – Sources, Hierarchy & Data Extraction
- 17.3 Data Modeling – Bottom-Up & Top-Down Market Sizing
- 17.4 Primary Research – Stakeholder Framework, LOI & Sample Sizes
- 17.5 Forecast Methodology – Regression, Scenario & Sensitivity Analysis
- 17.6 Quality Control – Four-Layer Validation Framework
- 17.7 Limitations & Standard Assumptions
- 17.8 Disclaimer
