
Market Overview
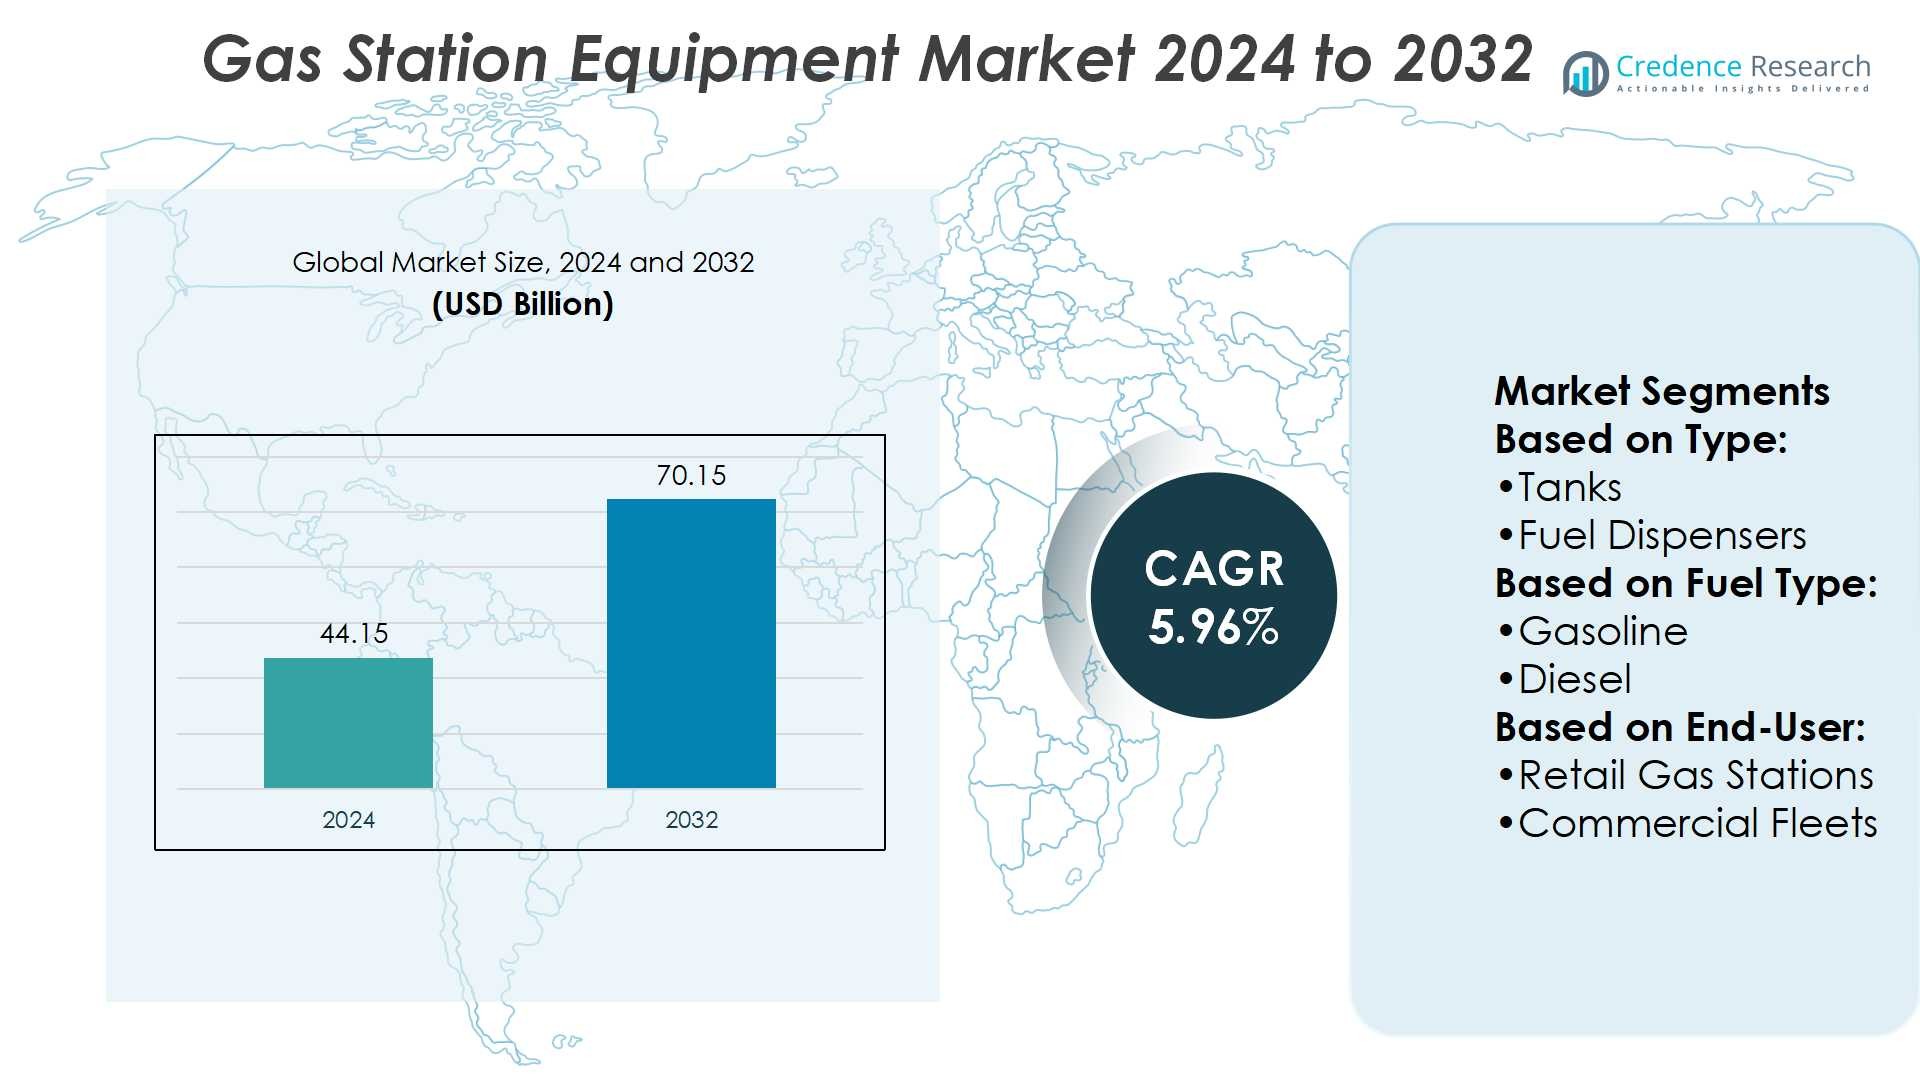
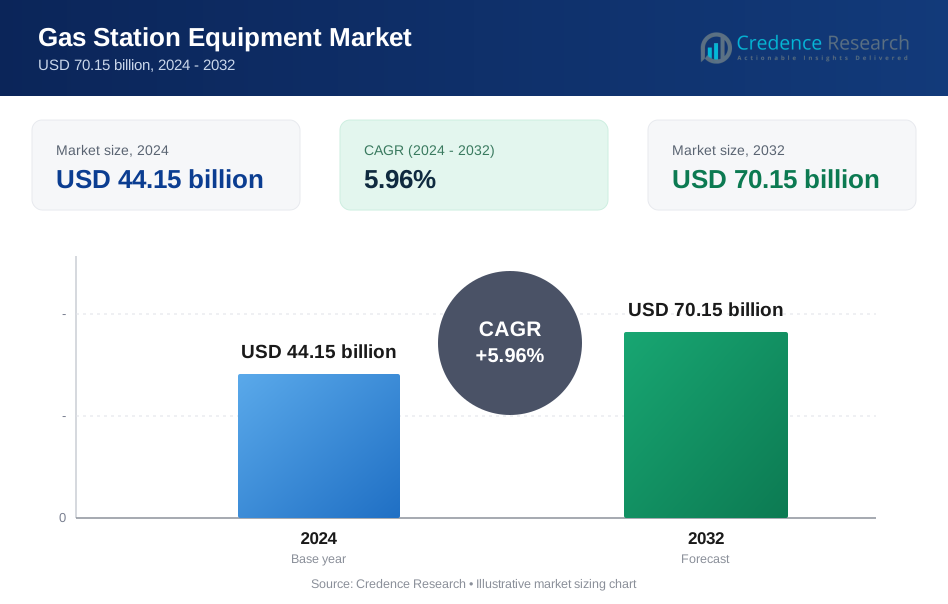
Gas Station Equipment Market size was valued at USD 44.15 billion in 2024 and is anticipated to reach USD 70.15 billion by 2032, at a CAGR of 5.96% during the forecast period.
| REPORT ATTRIBUTE | DETAILS |
|---|---|
| Historical Period | 2020-2023 |
| Base Year | 2024 |
| Forecast Period | 2025-2032 |
| Gas Station Equipment Market Size 2024 | USD 44.15 Billion |
| Gas Station Equipment Market, CAGR | 5.96% |
| Gas Station Equipment Market Size 2032 | USD 70.15 Billion |
The Gas Station Equipment Market grows through strong drivers and evolving trends that reshape fueling infrastructure. Rising demand for automated dispensers, secure digital payment systems, and eco-friendly storage solutions fuels adoption. Strict environmental regulations encourage vapor recovery and leak detection technologies, while growing vehicle ownership supports expansion of modern fueling stations. It also benefits from IoT integration, enabling predictive maintenance and real-time monitoring to reduce downtime. Trends such as contactless transactions, sustainability-focused equipment, and alternative fuel infrastructure, including hydrogen and LNG, highlight the shift toward innovation. Together, these drivers and trends ensure steady modernization and long-term growth opportunities.
The Gas Station Equipment Market shows strong geographical diversity, with North America leading through advanced infrastructure and Europe holding significant share driven by strict environmental regulations. Asia-Pacific emerges as the fastest-growing region, supported by rapid urbanization and rising vehicle ownership. Latin America and the Middle East & Africa record steady but smaller contributions. Key players shaping the market include Gilbarco Veeder-Root, Dover Corporation, Franklin Fueling Systems, Beijing Sanki Petroleum Technology, Censtar Science and Technology Corp. Ltd., and Bennett Pump Company.
Market Insights
- The Gas Station Equipment Market was valued at USD 44.15 billion in 2024 and is expected to reach USD 70.15 billion by 2032, growing at a CAGR of 5.96%.
- Rising demand for automated dispensers, secure digital payments, and eco-friendly storage solutions drives consistent market growth.
- IoT integration enables predictive maintenance, real-time monitoring, and improved operational efficiency for fuel stations.
- The market faces restraints from high upgrade costs, strict compliance requirements, and risks of technical failures.
- North America leads with advanced infrastructure, while Europe grows through strict environmental regulations and sustainability mandates.
- Asia-Pacific records the fastest growth due to urbanization, vehicle ownership, and investments in modern fueling systems.
- Competition is shaped by leading companies focusing on innovation, digital solutions, and eco-friendly equipment for long-term growth.
Market Drivers
Rising Demand for Fuel Dispensing and Payment Automation Systems
The Gas Station Equipment Market is driven by the growing need for advanced dispensing systems and secure payment solutions. Increasing customer preference for contactless transactions is pushing fuel stations to modernize point-of-sale infrastructure. Integration of digital technologies such as EMV chip card readers and mobile wallets supports seamless operations. Equipment upgrades ensure compliance with financial security regulations and enhance customer trust. It strengthens operational efficiency and reduces transaction delays at busy fuel stations. This combination of convenience and compliance creates sustained demand across regions.
- For instance, Gilbarco Retail Solutions is deploying Invenco iNFX payment systems across nearly 13,000 Shell retail sites. Integration of digital technologies such as EMV chip readers and mobile wallets supports seamless operations.
Expanding Focus on Environmental Regulations and Safety Standards
Stringent environmental guidelines fuel demand for equipment that reduces emissions and improves safety. Gas stations are upgrading storage tanks, vapor recovery systems, and leak detection tools to meet compliance. Equipment that limits fuel loss and prevents contamination supports both sustainability and cost efficiency. It aligns with government mandates aimed at reducing carbon footprint and protecting groundwater. Growing public awareness of safety further accelerates investment in advanced fueling infrastructure. The Gas Station Equipment Market benefits from regulatory-driven modernization initiatives worldwide.
- For instance,The MagShell® expanded pump motor assembly, a product of Franklin Fueling Systems, increases the pump’s flow area by 45%, enabling faster fueling without sacrificing safety. Remote monitoring systems from Franklin Electric now include the EVO™ 200 and EVO™ 400 consoles, which support up to 6 and 14 sensors, respectively, offering real-time data on inventory, pump status, and leak detection.
Increasing Vehicle Ownership and Fuel Consumption Growth
Rising global vehicle ownership directly boosts demand for efficient fueling infrastructure. The expansion of urban areas increases traffic flow and requires more stations with advanced capacity. Gas stations invest in modern dispensers, storage tanks, and monitoring equipment to serve higher volumes. It enables operators to deliver faster refueling services while reducing downtime. This trend drives continuous adoption of automated and durable equipment across emerging economies. The Gas Station Equipment Market responds to both consumer demand and infrastructure expansion.
Technological Integration with Smart and Sustainable Solutions
Integration of smart technologies creates a strong growth path for fueling equipment. Remote monitoring systems, IoT-enabled sensors, and predictive maintenance tools enhance station performance. Operators gain insights into inventory, fuel flow, and equipment health, reducing operational risks. It allows proactive maintenance, minimizing unexpected failures and service interruptions. Adoption of sustainable equipment, including energy-efficient lighting and solar-powered systems, reflects growing environmental focus. The Gas Station Equipment Market evolves with innovation that combines sustainability and smart automation.
Market Trends
Growing Integration of Digital and Contactless Payment Solutions
The Gas Station Equipment Market is witnessing a strong shift toward digital payment adoption. Contactless transactions through NFC cards, mobile wallets, and QR-based systems are becoming standard. Fuel stations upgrade point-of-sale systems to support faster and more secure customer experiences. It enhances efficiency while meeting growing expectations for safety and convenience. Integration with loyalty apps and digital receipts strengthens customer engagement. This trend continues to expand across both developed and emerging regions.
- For instance, Bennett's MaxFlow™ UHF truck dispenser delivers hydrogen at an average fill-rate exceeding 10 kilograms per minute, marking a new industry standard for high-speed hydrogen fueling.
Rising Adoption of Automated and Smart Dispensing Systems
Automation is transforming the way fuel stations manage daily operations. Advanced dispensers with real-time monitoring and data capture capabilities are gaining prominence. It supports accuracy in fuel measurement, reduces manual errors, and optimizes flow management. Smart systems enable operators to track fuel levels, maintenance needs, and equipment performance remotely. Increased demand for faster service has accelerated investment in automation. The Gas Station Equipment Market benefits from growing preference for reliability and operational efficiency.
- For instance, the SK-SP300 magnetostrictive probe transmits real-time fuel and water level data with precision of ±0.5 mm and resolution of 0.01 mm, using five integrated temperature sensors.
Expansion of Sustainable and Eco-Friendly Equipment Solutions
Sustainability is shaping the evolution of gas station infrastructure worldwide. Equipment that supports vapor recovery, leak prevention, and energy-efficient lighting is in focus. It aligns with stricter environmental policies and consumer awareness of eco-friendly practices. Fuel stations are investing in double-walled tanks and green-certified materials to enhance safety. Solar-powered canopy lighting and low-emission systems highlight a shift toward sustainable operations. The Gas Station Equipment Market continues to adapt to environmental priorities.
Increasing Role of IoT and Predictive Maintenance Technologies
The deployment of IoT solutions is redefining station equipment management. Sensors track equipment health, fuel flow, and storage conditions in real time. It allows predictive maintenance that prevents costly downtime and enhances safety compliance. Data-driven insights help operators plan inventory, streamline logistics, and cut operational costs. Adoption of cloud platforms and analytics supports more informed decision-making. The Gas Station Equipment Market is advancing with connected technologies that ensure long-term efficiency.
Market Challenges Analysis
High Costs of Equipment Upgrades and Regulatory Compliance
The Gas Station Equipment Market faces significant pressure from rising upgrade and compliance costs. Meeting strict safety and environmental regulations requires advanced storage tanks, leak detection tools, and vapor recovery systems. It creates financial strain for small and independent operators who manage limited budgets. Rapid technology advancements further increase replacement cycles, raising total ownership costs. Frequent equipment upgrades demand skilled installation and maintenance teams, which are not always available. This challenge often slows modernization efforts and limits adoption in price-sensitive regions.
Operational Risks from Technical Failures and Cybersecurity Threats
Gas station operators deal with operational risks that hinder seamless equipment performance. Unexpected technical failures in dispensers or storage systems disrupt service and reduce customer trust. It leads to revenue losses and higher maintenance expenses for operators. Growing reliance on digital payment solutions exposes stations to cybersecurity threats and data breaches. Limited expertise in managing advanced IoT-enabled systems creates vulnerabilities. The Gas Station Equipment Market must overcome these risks to maintain reliability and ensure long-term growth.
Market Opportunities
Expansion of Smart and Connected Fueling Infrastructure
The Gas Station Equipment Market offers strong opportunities through adoption of smart and connected systems. IoT-enabled dispensers, automated monitoring tools, and predictive maintenance solutions enhance operational efficiency. It allows operators to reduce downtime, optimize fuel management, and improve service quality. Growing demand for real-time data analytics supports advanced inventory planning and customer engagement. Integration with mobile apps and digital loyalty platforms creates value-added services for consumers. This opportunity is shaping long-term investments in technology-driven fueling infrastructure.
Growth Potential in Sustainable and Alternative Fuel Solutions
Environmental priorities create new opportunities for gas station equipment suppliers. Stations are investing in energy-efficient lighting, vapor recovery systems, and low-emission storage tanks. It aligns with government sustainability initiatives and evolving consumer demand for eco-friendly options. The rise of alternative fuels such as biofuels, LNG, and hydrogen expands equipment needs. Vendors offering adaptable and green-certified systems gain competitive advantage. The Gas Station Equipment Market stands to benefit from global momentum toward clean and sustainable energy infrastructure.
Market Segmentation Analysis:
By Type
The Gas Station Equipment Market covers a broad range of product categories that ensure safe and efficient fueling operations. Tanks, dispensers, pumps, and nozzles form the backbone of fueling infrastructure, with demand driven by durability and compliance standards. Hoses and tire inflators provide essential support, strengthening the overall customer experience at service stations. C-store equipment such as point-of-sale systems, refrigeration, and vending units expands station profitability by diversifying revenue streams. It also includes specialized components like pump filters, which safeguard fuel quality and prevent system failures. Strong investment in automated and smart dispensing systems highlights a trend toward efficiency and reduced maintenance.
- For instance, Korea EnE supplies high-speed fuel dispensers capable of delivering between 160 L/min and 300 L/min, ideal for refueling lorries and buses efficiently.Dispensers are available with 2, 4, or 6 hoses, offering flexibility to suit different service station needs.
By Fuel Type
Segmentation by fuel type reflects the evolving nature of global energy demand. Gasoline and diesel remain dominant, supported by large-scale vehicle usage in both developed and emerging regions. Biofuels are steadily gaining traction as governments encourage renewable energy adoption. Compressed natural gas (CNG) and liquefied natural gas (LNG) stations are expanding to meet cost-efficient and lower-emission requirements. Hydrogen fueling stations, though in early stages, present strong long-term potential with the rise of fuel cell vehicles. It is clear that equipment manufacturers are aligning product designs with this diversification of fuel sources. Other categories support niche applications where localized demand is evident.
- For instance, Censtar’s CS52 and CS42-Legend dispensers deliver flow rates between 5 to 50 L/min or 8 to 80 L/min, with precision accuracy of ±0.25%. These units operate across –40 °C to +55 °C and support suction intake vacuum of at least 54 kPa, providing consistent performance in challenging environments.
By End User
End-user segmentation highlights the varying priorities across industries. Retail gas stations remain the largest segment, with growing emphasis on automation, payment security, and customer experience. Commercial fleets demand reliable equipment that ensures faster fueling and minimal downtime. Aviation requires highly specialized pumps, tanks, and safety systems designed to meet stringent standards. Marine applications focus on large-capacity dispensing solutions that handle unique operational conditions. It reflects a diverse customer base that continues to create sustained demand for equipment upgrades and technological innovations. The Gas Station Equipment Market benefits from this broad end-user landscape, offering suppliers multiple growth avenues.
Segments:
Based on Type:
- Tanks
- Fuel Dispensers
Based on Fuel Type:
- Gasoline
- Diesel
Based on End-User:
- Retail Gas Stations
- Commercial Fleets
Based on the Geography:
- North America
- U.S.
- Canada
- Mexico
- Europe
- Germany
- France
- U.K.
- Italy
- Spain
- Rest of Europe
- Asia Pacific
- China
- Japan
- India
- South Korea
- South-east Asia
- Rest of Asia Pacific
- Latin America
- Brazil
- Argentina
- Rest of Latin America
- Middle East & Africa
- GCC Countries
- South Africa
- Rest of the Middle East and Africa
Regional Analysis
North America
North America holds 33% of the Gas Station Equipment Market, making it one of the largest regions. The U.S. dominates with strong manufacturing capacity for dispensers, tanks, and payment systems. It benefits from strict regulatory compliance and early adoption of automation and contactless payment technologies. The presence of major equipment suppliers drives steady upgrades. It also exports equipment to emerging markets, strengthening global supply chains. High demand for modernization sustains market leadership across retail and fleet fueling stations.
Europe
Europe represents 29% of global share, supported by strong environmental regulations and advanced infrastructure. Countries like Germany, the U.K., and France lead modernization through adoption of vapor recovery systems and eco-friendly fueling equipment. It benefits from policies that encourage sustainability and alternative fuels. European stations integrate smart dispensers and digital payments to enhance efficiency. Growing demand for hydrogen and biofuel infrastructure expands opportunities. This region stands out for its structured and mature market profile.
Asia-Pacific
Asia-Pacific contributes 24% of the Gas Station Equipment Market, driven by rising vehicle ownership and urbanization. China, India, and Japan dominate demand with large-scale fueling infrastructure expansion. It benefits from rapid adoption of smart and automated dispensers. Governments push for integrated energy stations combining gasoline, EV charging, and hydrogen fueling. Growing disposable income accelerates demand for convenience store equipment. The region continues to expand at the fastest pace compared to others.
Latin America
Latin America accounts for 3.8% of the global market, with Brazil and Argentina leading adoption. Infrastructure development and gradual economic recovery drive moderate demand. It focuses on cost-effective equipment suited to local fuel stations. Growing interest in CNG fueling supports expansion in urban centers. It faces challenges from fiscal constraints but remains an emerging opportunity. Market players targeting affordable solutions see growth potential.
Middle East & Africa
The Middle East & Africa hold a combined 6% of global share. Countries like Saudi Arabia and the UAE lead investments in modern fueling infrastructure. It benefits from strong oil economies that fund advanced dispenser and tank upgrades. Africa, though smaller, shows rising demand through urban growth and retail fuel expansion. Regional climates require durable equipment suited for extreme conditions. Growth in alternative fuels like LNG and hydrogen is gradually emerging. This region remains an important growth frontier.
Key Player Analysis
- Gilbarco Veeder-Root
- Peltek
- Franklin Fueling Systems
- Jiangsu Furen Group
- Bennett Pump Company
- Beijing Sanki Petroleum Technology
- Korea EnE Co. Ltd.
- Censtar Science and Technology Corp. Ltd.
- Dover Corporation
- China Hongyang
Competitive Analysis
The Gas Station Equipment Market players including Gilbarco Veeder-Root, Dover Corporation, Franklin Fueling Systems, Beijing Sanki Petroleum Technology, Censtar Science and Technology Corp. Ltd., Bennett Pump Company, Jiangsu Furen Group, Korea EnE Co. Ltd., China Hongyang, and Peltek. The Gas Station Equipment Market is characterized by intense competition, with companies focusing on technology upgrades, safety standards, and operational efficiency. Innovation in smart dispensers, leak detection systems, and digital payment integration shapes the competitive landscape. Market participants invest heavily in research and development to deliver equipment that meets regulatory compliance and customer expectations. Sustainability also plays a key role, with growing demand for eco-friendly storage tanks, vapor recovery systems, and energy-efficient solutions. Companies differentiate themselves through global service networks, aftersales support, and localized product customization. It is evident that competitive advantage depends on balancing cost efficiency, advanced technology, and long-term reliability.
Recent Developments
- In March 2024, Honeywell International Inc. announced its participation as the inaugural gas detector manufacturer in the 'Made in Saudi' initiative, underscoring the company's dedication to promoting localization and economic diversification within Saudi Arabia.
- In January 2024, Teledyne FLIR, a separate subsidiary of Teledyne Technologies Incorporated, announced the launch of the Neutrino LC OGI, a camera module designed especially for UAV-based gas leak detection. This Mid-Wave Infrared (MWIR) imaging module can seamlessly integrate with Unmanned Aerial Vehicles (UAVs) and other devices to identify, quantify, and visualize methane and other hydrocarbon gas emissions.
- In October 2023, Gilbarco Veeder-Root announced the launch of its new Amps2Go EV charging solution, designed to help fuel retailers easily integrate electric vehicle charging into their existing forecourt infrastructure.
- In August 2023, Dover Fueling Solutions established a strategic partnership with GRUBBRR, a provider of self-ordering technology. This collaboration aims to introduce an innovative self-ordering solution named DX Market, which will be integrated into the DFS Anthem UX platform on Wayne Ovation fuel dispensers.
Report Coverage
The research report offers an in-depth analysis based on Type, Fuel Type, End-User and Geography. It details leading market players, providing an overview of their business, product offerings, investments, revenue streams, and key applications. Additionally, the report includes insights into the competitive environment, SWOT analysis, current market trends, as well as the primary drivers and constraints. Furthermore, it discusses various factors that have driven market expansion in recent years. The report also explores market dynamics, regulatory scenarios, and technological advancements that are shaping the industry. It assesses the impact of external factors and global economic changes on market growth. Lastly, it provides strategic recommendations for new entrants and established companies to navigate the complexities of the market.
Future Outlook
- The market will expand with rising adoption of smart dispensers and automated systems.
- Digital payment integration will become standard across fuel stations worldwide.
- Demand for eco-friendly storage tanks and vapor recovery systems will continue to grow.
- IoT-enabled monitoring tools will drive predictive maintenance and reduce downtime.
- Alternative fuels such as hydrogen and LNG will create new equipment opportunities.
- Convenience store integration will strengthen profitability for fuel station operators.
- Strict regulatory frameworks will accelerate investment in safety-compliant equipment.
- Emerging economies will see rapid expansion of modern fueling infrastructure.
- Advanced analytics will support inventory planning and operational efficiency.
- Sustainability and innovation will remain central to long-term market strategies.
Request a Free Sample
Fill in your details and we'll send you a free sample report.
- Sample data tables & charts
- Research methodology
Need a Custom Version of This Report?
Tailor the scope, geography, or segments to your exact requirements.
- Custom geography or segment scope
- Direct access to our analyst team
Frequently Asked Questions
What is the current market size for Gas Station Equipment Market, and what is its projected size in 2032?
At what Compound Annual Growth Rate is the Gas Station Equipment Market projected to grow between 2025 and 2032?
Which Gas Station Equipment Market segment held the largest share in 2024?
What are the primary factors fueling the growth of the Gas Station Equipment Market?
Who are the leading companies in the Gas Station Equipment Market?
Which region commanded the largest share of the Gas Station Equipment Market in 2024?
Table of Content
Chapter 1. Report Introduction
- 1.1 Report Description & Purpose
- 1.1.1 Report Title & Market Definition
- 1.1.2 Unique Selling Propositions (USP) & Key Differentiators
- 1.1.3 Value Proposition for Stakeholders
- 1.2 Research Objectives
- 1.2.1 Market Sizing Objectives (Volume & Revenue)
- 1.2.2 Segmentation Objectives
- 1.2.3 Competitive Intelligence Objectives
- 1.2.4 Forecast & Scenario Objectives
- 1.3 Report Scope
- 1.3.1 Gas Station Equipment Scope – Types & Subtypes Covered
- 1.3.2 Geographic Scope – Regions & Countries Covered
- 1.3.3 Historical Period, Base Year & Forecast Period (2024; forecast to 2032)
- 1.3.4 Inclusions & Exclusions
- 1.4 HS Code & Classification Framework
- 1.5 Currency, Units & Pricing Basis
- 1.6 Target Stakeholders
- 1.7 Limitations & Assumptions
Chapter 2. Executive Summary
- 2.1 Global Gas Station Equipment Market Snapshot
- 2.1.1 Market Size – Historical (2024) & Forecast (2024-2032) (2024: USD 44.15 billion → 2032: USD 70.15 billion)
- 2.1.2 Volume & Revenue – Global Totals
- 2.1.3 Key Market Highlights – Top Five Facts
- 2.2 Gas Station Equipment Market Segmentation Snapshot
- 2.2.1 Market Split by Region – 2024 vs. 2032
- 2.3 Competitive Snapshot
- 2.3.1 Top 10 Players by Revenue Share – 2024
- 2.3.2 Top 10 Players by Volume Share – 2024
- 2.3.3 Recent Strategic Developments (18-Month Summary)
- 2.4 Key Investment Highlights & Strategic Conclusions
Chapter 3. Gas Station Equipment Market Dynamics & Industry Analysis
- 3.1 Market Overview & Context
- 3.1.1 Gas Station Equipment Market Position in the Broader Automotive Value Chain
- 3.1.2 OEM vs. Replacement Market Dynamics
- 3.1.3 Market Maturity & Development Stage by Region
- 3.2 Gas Station Equipment Market Drivers
- 3.3 Gas Station Equipment Market Restraints & Challenges
- 3.4 Gas Station Equipment Market Opportunities
- 3.5 Porter's Five Forces Analysis
- 3.5.1 Threat of New Entrants
- 3.5.2 Bargaining Power of Suppliers
- 3.5.3 Bargaining Power of Buyers
- 3.5.4 Threat of Substitutes
- 3.5.5 Competitive Rivalry – Intensity Assessment
- 3.6 Gas Station Equipment Value Chain Analysis
- 3.6.1 Upstream – Raw Material/Input Suppliers
- 3.6.1.1 Raw Material/Input 1
- 3.6.1.2 Raw Material/Input 2
- 3.6.1.3 Raw Material/Input 3
- 3.6.2 Midstream – Production/Manufacturing/Service Delivery
- 3.6.2.1 Production/Process Overview
- 3.6.2.2 Key Facility Locations & Capacity by Manufacturer
- 3.6.3 Downstream – Distribution & End Consumer
- 3.6.3.1 Primary Channel – B2B/OEM
- 3.6.3.2 Secondary Channels – Dealer, Retail, Online, Direct
- 3.6.4 Value Chain Profitability Analysis
- 3.6.1 Upstream – Raw Material/Input Suppliers
- 3.7 PESTEL Analysis
- 3.7.1 Political Factors
- 3.7.2 Economic Factors
- 3.7.3 Social Factors
- 3.7.4 Technological Factors
- 3.7.5 Environmental Factors
- 3.7.6 Legal Factors
- 3.8 Gas Station Equipment Supply Chain Analysis
- 3.8.1 Raw Material/Input Supply Risk Assessment
- 3.8.2 Manufacturing Concentration Risk (Geographic Exposure)
- 3.8.3 Trade Disruption Impact Analysis
- 3.9 Regulatory & Policy Landscape
Note: The regulatory and policy landscape section covers regulations based on their applicability to the market, Gas Station Equipment category, geography, and scope of the study. Only regulatory frameworks with a material impact on operations, compliance, trade, sustainability, or market access are analyzed in detail.
Chapter 4. Key Investment Pockets & Opportunity Analysis
- 4.1 Gas Station Equipment Market Attractiveness Analysis
- 4.1.1 By Region – Investment Attractiveness Matrix (Volume × CAGR)
- 4.2 Absolute Revenue Growth Opportunity
- 4.2.1 By Region – Absolute USD Growth Through 2032
- 4.3 Incremental Volume Opportunity
- 4.3.1 By Region – Incremental Volume Through 2032
- 4.3.2 Segment – Incremental Volume
- 4.4 Emerging Submarket Opportunity Deep Dive (Subject to Applicability)
- 4.5 Emerging Market Opportunity Scorecards
- 4.5.1 United States
- 4.5.2 Europe
- 4.5.3 Asia
- 4.5.4 Middle East & Africa
Note: Emerging Market Opportunity Scorecards will be included based on relevance and strategic importance. Regions listed are indicative and may vary depending on data availability and market dynamics.
Chapter 5. Gas Station Equipment Import-Export Analysis & Trade Flows
- 5.1 Global Trade Overview
- 5.1.1 Global Export Value by Country (2024)
- 5.1.2 Global Export Volume by Country (2024)
- 5.1.3 Global Import Value by Country (2024)
- 5.1.4 Global Import Volume by Country (2024)
- 5.1.5 Net Trade Balance by Country (2024)
- 5.2 Export Analysis – Segment
- 5.2.1 Type 1 (HS Code)
- 5.2.2 Type 2 (HS Code)
- 5.2.3 Type 3 (HS Code)
- 5.2.4 Type 4 (HS Code)
- 5.2.5 Type 5 (HS Code)
- 5.3 Import Analysis – Segment
- 5.3.1 Type 1 (HS Code)
- 5.3.2 Type 2 (HS Code)
- 5.3.3 Type 3 (HS Code)
- 5.3.4 Type 4 (HS Code)
- 5.3.5 Type 5 (HS Code)
- 5.4 Average Unit Trade Prices
- 5.4.1 Average Export Price – Segment & Country
- 5.4.2 Average Import Price – Segment & Source Country
- 5.4.3 Price Trends (2024)
- 5.5 Key Trade Route Analysis
- 5.5.1 Trade Route 1
- 5.5.2 Trade Route 2
- 5.5.3 Trade Route 3
- 5.5.4 Trade Route 4
- 5.5.5 Trade Route 5
- 5.6 Trade Policy Impact Assessment
- 5.6.1 US Anti-Dumping & Section 301 Tariffs
- 5.6.2 EU Customs Union Impact
- 5.6.3 Major Free Trade Agreements
- 5.6.4 USMCA Rules of Origin
Note: Trade policy analysis will be included only where relevant to the Gas Station Equipment market.
Chapter 6. Competitive Landscape & Company Benchmarking
- 6.1 Gas Station Equipment Market Concentration & Structure
- 6.1.1 Herfindahl-Hirschman Index (HHI) – vs. 2024
- 6.1.2 Tier 1, Tier 2 & Tier 3 Market Structure
- 6.1.3 Global, Regional & Local Player Dynamics
- 6.2 Gas Station Equipment Market Share Analysis – 2024
- 6.2.1 Global Revenue Share by Company
- 6.2.2 Global Volume Share by Company
- 6.2.3 Regional Revenue Share
- 6.2.4 Market Share Evolution ( vs. 2024)
- 6.2.5 OEM Segment Share by Company
- 6.2.6 Replacement Segment Share by Company
- 6.3 Production/Delivery Capacity & Facility Analysis
- 6.3.1 Global Installed Capacity
- 6.3.2 Capacity Utilization Rates
- 6.3.3 Production/Output Volume
- 6.3.4 Facility Locations & Capacity Map
- 6.3.5 Planned Capacity Additions
- 6.4 Gas Station Equipment Competitive Benchmarking Matrix
- 6.4.1 Revenue, Volume, CAGR & Profitability Comparison
- 6.4.2 Channel Revenue Mix
- 6.4.3 Geographic Revenue Exposure
- 6.4.4 R&D Intensity
- 6.4.5 Sustainability Maturity
- 6.5 Strategic Developments in Gas Station Equipment (Last 24 Months)
- 6.5.1 Mergers, Acquisitions & Divestments
- 6.5.2 New Gas Station Equipment Launches
- 6.5.3 Facility Expansions
- 6.5.4 Strategic Alliances, Joint Ventures & Partnerships
- 6.5.5 Distribution Expansion & Market Entry
- 6.5.6 Sustainability & ESG Initiatives
- 6.6 Competitive Strategy Mapping
- 6.6.1 Leader, Challenger, Follower & Niche Classification
- 6.6.2 Pricing Strategy Comparison
- 6.6.3 Channel Strategy Matrix
Note: Strategic developments are included based on their materiality and the availability of reliable information.
Chapter 7. Global Gas Station Equipment Market – By Distribution Channel
- 7.1 Segment Overview
- 7.1.1 Volume & Revenue Split by Channel (2024 & 2032)
- 7.1.2 Channel Mix Evolution (2024-2032)
Chapter 8. Regional Market Analysis – Global Overview
- 8.1 Global Regional Overview
- 8.1.1 Regional Volume Share
- 8.1.2 Regional Revenue Share
- 8.1.3 Regional Volume by Region
- 8.1.4 Regional Revenue by Region
- 8.1.5 Regional Forecast Through 2032
- 8.2 Cross-Regional Segment Analysis
- 8.2.1 By Distribution Channel
- 8.2.2 By Brand/Price Tier
Chapter 9. North America Gas Station Equipment Market
- 9.1 United States
- 9.2 Canada
- 9.3 Mexico
Chapter 10. Europe Gas Station Equipment Market
- 10.1 Germany
- 10.2 France
- 10.3 Italy
- 10.4 United Kingdom
- 10.5 Spain
- 10.6 Poland
- 10.7 Russia
- 10.8 Netherlands
- 10.9 Belgium
- 10.10 Sweden
- 10.11 Denmark
- 10.12 Norway
- 10.13 Rest of Europe
Chapter 11. Asia Pacific Gas Station Equipment Market
- 11.1 China
- 11.2 India
- 11.3 Japan
- 11.4 South Korea
- 11.5 Thailand
- 11.6 Indonesia
- 11.7 Vietnam
- 11.8 Malaysia
- 11.9 Australia
- 11.10 Rest of Asia Pacific
Chapter 12. Latin America Gas Station Equipment Market
- 12.1 Brazil
- 12.2 Argentina
- 12.3 Colombia
- 12.4 Chile
- 12.5 Rest of Latin America
Chapter 13. Middle East Gas Station Equipment Market
- 13.1 Saudi Arabia
- 13.2 United Arab Emirates
- 13.3 Turkey
- 13.4 Israel
- 13.5 Iran
- 13.6 Rest of the Middle East
Chapter 14. Africa Gas Station Equipment Market
- 14.1 South Africa
- 14.2 Egypt
- 14.3 Nigeria
- 14.4 Morocco
- 14.5 Rest of Africa
Chapter 15. Gas Station Equipment Company Profiles
- 15.1 [Company 01]
- 15.1.1 Company Overview
- 15.1.2 Key Management Personnel
- 15.1.3 Products & Services Portfolio
- 15.1.4 Financial Performance
- 15.1.5 Key Market Focus & Geographic Presence
- 15.1.6 Recent Developments & Strategic Initiatives
Note: The company profile list is preliminary and may change based on research findings, market developments, data availability, and client requirements.
Chapter 16. Appendices
- Appendix A – List of Abbreviations & Acronyms
- Appendix B – Industry Classification Code Reference – Full Series
- Appendix C – Production & Capacity Data Tables
- Appendix D – End-Use & Demand Base Tables
- Appendix E – Consumption & Replacement Rate Assumptions
- Appendix F – ASP Reference Tables
- Appendix G – Manufacturing & Facility Database
- Appendix H – Import-Export Data Tables
- Appendix I – Regulatory Summary Tables
- Appendix J – Primary Research Participant List (Anonymized)
- Appendix K – Primary Research Questionnaire Framework
- Appendix L – Data Sources & Bibliography
- Appendix M – Market Size Divergence & Source Comparison
Chapter 17. Research Methodology
- 17.1 Research Framework & Philosophy
- 17.2 Secondary Research – Sources, Hierarchy & Data Extraction
- 17.3 Data Modeling – Bottom-Up & Top-Down Market Sizing
- 17.4 Primary Research – Stakeholder Framework, LOI & Sample Sizes
- 17.5 Forecast Methodology – Regression, Scenario & Sensitivity Analysis
- 17.6 Quality Control – Four-Layer Validation Framework
- 17.7 Limitations & Standard Assumptions
- 17.8 Disclaimer
