Market Overview
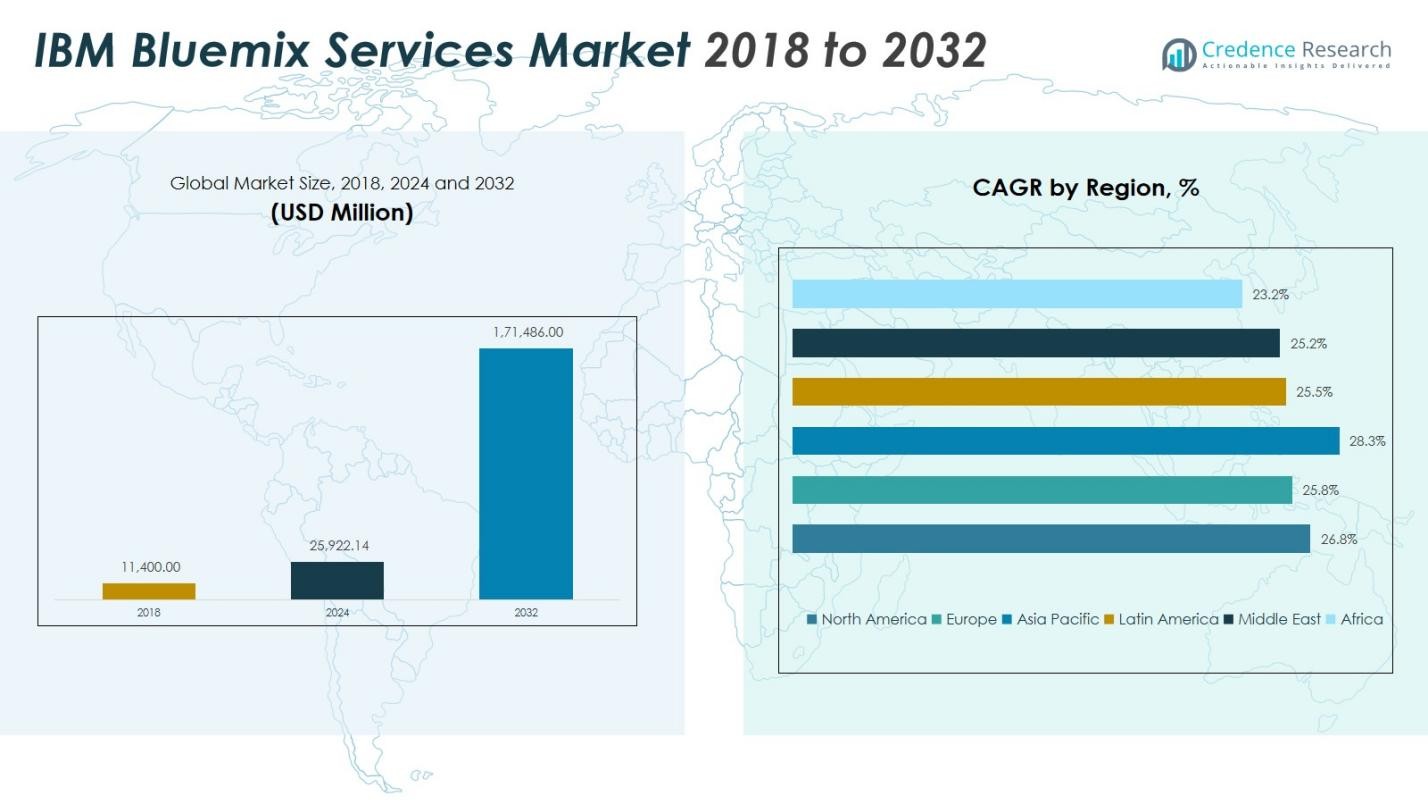
The IBM Bluemix Services Market size was valued at USD 11,400.00 million in 2018, increasing to USD 25,922.14 million in 2024, and is anticipated to reach USD 171,486.00 million by 2032, growing at a CAGR of 26.76% during the forecast period.
| REPORT ATTRIBUTE |
DETAILS |
| Historical Period |
2020-2023 |
| Base Year |
2024 |
| Forecast Period |
2025-2032 |
| IBM Bluemix Services Market Size 2024 |
USD 25,922.14 Million |
| IBM Bluemix Services Market, CAGR |
26.76% |
| IBM Bluemix Services Market Size 2032 |
USD 171,486.00 Million |
The IBM Bluemix Services Market is highly competitive, with key players such as Wipro Limited, Capgemini, Tech Mahindra Limited, Tata Consultancy Services (TCS), Infosys Limited, DXC Technology, Robert Bosch GmbH, Datamato Technologies, Prolifics Inc., Firebase, Google App Engine, Netify, Heroku, and Aquia Cloud driving innovation and service expansion. These companies focus on AI integration, DevOps automation, and hybrid cloud capabilities to strengthen their market presence. North America emerged as the leading region, commanding 38.1% of the global market share in 2024, supported by strong cloud adoption, advanced IT infrastructure, and a robust base of enterprise customers utilizing Bluemix for digital transformation initiatives across BFSI, healthcare, and IT & telecom sectors.
Access crucial information at unmatched prices!
Request your sample report today & start making informed decisions powered by Credence Research Inc.!
Download Sample
Market Insights
- The IBM Bluemix Services Market was valued at USD 11,400 million in 2018 and is projected to reach USD 171,486 million by 2032, growing at a CAGR of 26.76% during the forecast period.
- Growing enterprise demand for hybrid cloud integration, DevOps automation, and AI-driven platforms is fueling market expansion across multiple sectors.
- Emerging trends include the rapid adoption of IoT, analytics, and mobile-based Bluemix applications, along with rising investments in hybrid and multi-cloud environments.
- The competitive landscape features major players such as IBM, Wipro, TCS, Capgemini, Infosys, and DXC Technology, focusing on innovation, partnerships, and data-driven service optimization.
- North America dominates the market with a 38.1% share, followed by Asia Pacific at 31.7%, while the Defensive deployment model and DevOps application segment collectively account for over 42% of total market revenue, driven by strong adoption across BFSI and IT & telecom industries.
Market Segmentation Analysis:
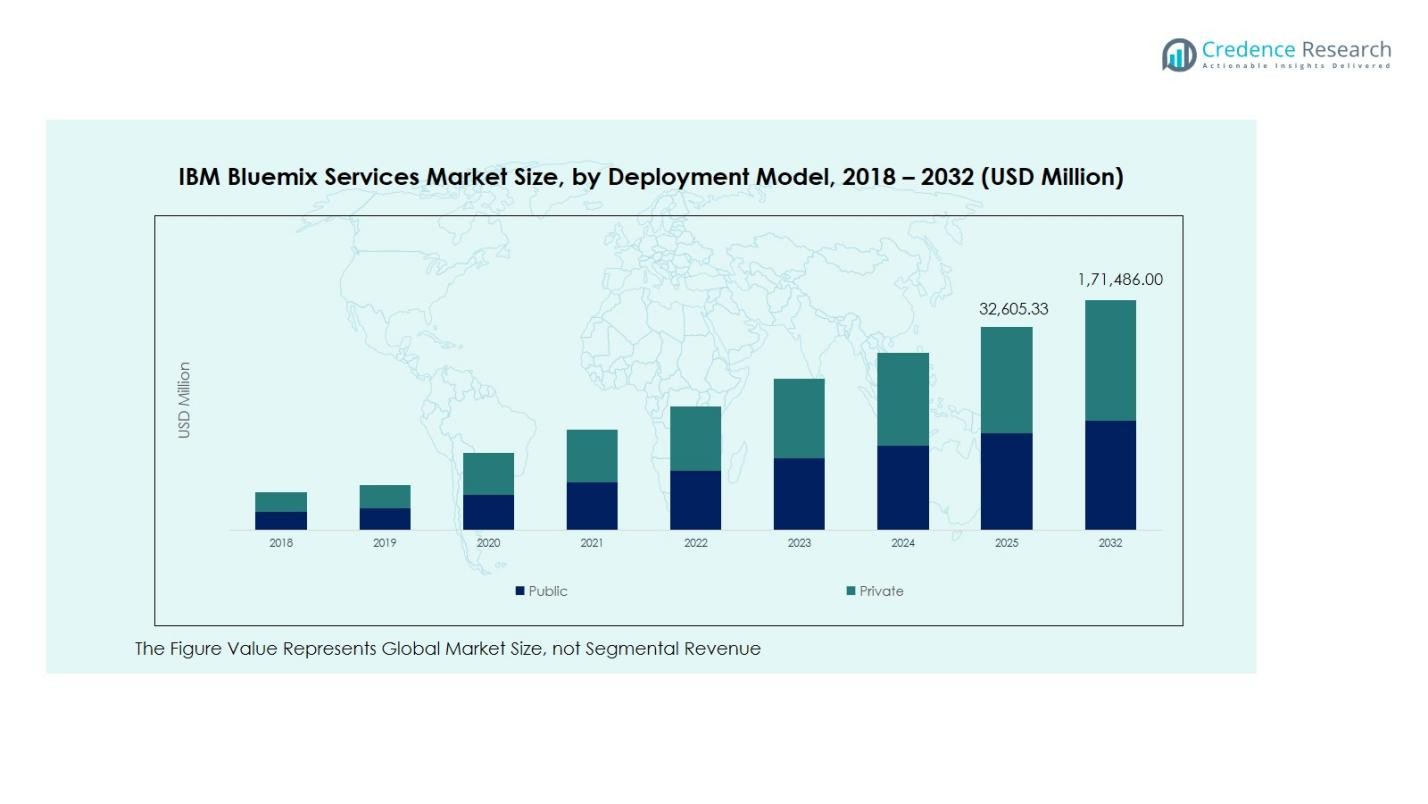
By Deployment Model
The IBM Bluemix Services Market by deployment model is segmented into Defensive and Offensive approaches. The Offensive segment dominated the market in 2024, accounting for around 63.4% of the total revenue share. This dominance is driven by enterprises’ growing focus on leveraging Bluemix for proactive application development, agile integration, and accelerated digital transformation. Offensive deployment emphasizes rapid innovation through DevOps, microservices, and API-driven architecture, aligning with businesses’ strategic goals to gain a competitive edge. Meanwhile, the Defensive model, holding 36.6% share, continues to support legacy system protection and risk mitigation strategies.
- For instance, American Airlines leveraged Bluemix’s DevOps integration to manage more than 350 production APIs, enabling seamless digital service updates across global platforms.
By Application
Based on application, the IBM Bluemix Services Market is divided into DevOps, Application Services, Analytics, Watson, Mobile, Internet of Things (IoT), and Others. The DevOps segment leads the market with 29.7% share in 2024, owing to its critical role in enabling continuous integration and delivery within hybrid cloud environments. The integration of AI-driven automation and containerization tools within Bluemix enhances developer productivity and scalability. Analytics and Watson applications follow, driven by growing adoption in predictive modeling and AI-based decision-making, while IoT and Mobile services are witnessing rising traction from smart manufacturing and digital customer engagement initiatives.
- For instance, IBM’s collaboration with Honda utilized IBM solutions, including potentially Watson Analytics and Bluemix, to process vehicle telemetry data, enhancing predictive maintenance insights.
By End-User
The IBM Bluemix Services Market by end-user includes BFSI, IT & Telecom, Healthcare, Retail, Federal (Government), Media and Entertainment, and Others. The IT & Telecom sector emerged as the leading segment, capturing about 31.2% market share in 2024, driven by the increasing demand for cloud-native solutions, data integration, and network automation. The BFSI segment, holding 25.4%, follows closely due to accelerated adoption of Bluemix for fraud detection and digital banking platforms. Healthcare and Retail sectors are also expanding rapidly as organizations deploy AI-based analytics and IoT connectivity to enhance patient care, operational efficiency, and personalized shopping experiences.
Key Growth Drivers
Rising Adoption of Cloud-Native Application Development
The growing demand for scalable, cloud-native applications is a major driver of the IBM Bluemix Services Market. Organizations are increasingly migrating workloads to hybrid and multi-cloud environments to achieve agility, flexibility, and faster deployment cycles. IBM Bluemix offers integrated DevOps tools, container orchestration, and microservices architecture that enhance application lifecycle management. This trend is particularly strong among IT, telecom, and BFSI sectors, where enterprises seek to accelerate innovation, reduce operational costs, and streamline software delivery pipelines.
Integration of Artificial Intelligence and Machine Learning
The incorporation of AI and ML capabilities into Bluemix services has significantly boosted market growth. IBM Watson integration enables businesses to analyze large data sets, automate workflows, and improve decision-making through predictive insights. Companies across industries, such as healthcare and retail, are leveraging AI-driven Bluemix solutions for intelligent automation, real-time analytics, and customer personalization. The combination of cognitive computing and Bluemix’s flexible cloud infrastructure continues to attract enterprises looking to enhance operational efficiency and business intelligence.
- For instance, JPMorgan Chase has implemented thousands of microservices, powered by a Spring-Boot-based framework and leveraging cloud platforms (including the specific use of the Thought Machine Vault platform for core banking), to modernize its core banking applications, enabling faster updates across global systems.
Expanding Internet of Things (IoT) Ecosystem
The rapid expansion of IoT applications has become a key growth catalyst for the IBM Bluemix Services Market. Bluemix’s IoT platform allows enterprises to connect, manage, and analyze data from millions of devices securely. Industries such as manufacturing, logistics, and smart cities are adopting these services to optimize asset performance and improve real-time monitoring. The growing emphasis on connected ecosystems, predictive maintenance, and automation is driving demand for Bluemix’s scalable and secure IoT solutions, reinforcing IBM’s position in the enterprise cloud landscape.
- For instance, IBM partnered with Bosch to integrate over 10 million connected devices through the Bosch IoT Suite on IBM Bluemix, enhancing data analytics for industrial automation systems.
Key Trends & Opportunities
Rise of Hybrid and Multi-Cloud Strategies
A major trend shaping the IBM Bluemix Services Market is the increasing shift toward hybrid and multi-cloud deployment models. Enterprises are adopting Bluemix to seamlessly integrate private and public cloud infrastructures while maintaining control over sensitive data. This approach enhances interoperability and resilience, allowing businesses to optimize costs and performance. The flexibility of IBM Bluemix in supporting cross-platform integration provides a strategic opportunity for organizations aiming to future-proof their digital ecosystems and enable scalable cloud transformations.
- For instance, Wipro Ltd. built an industry-focused “Data Discovery Platform” on IBM Bluemix, utilising IBM BigInsights and IBM dashDB, delivering analytics solutions across sectors like energy, retail, manufacturing and mining.
Growing Focus on Industry-Specific Cloud Solutions
Another emerging opportunity lies in the growing demand for customized, industry-focused Bluemix solutions. IBM is developing sector-specific offerings tailored for BFSI, healthcare, and government applications to address unique compliance, security, and operational needs. These specialized cloud services enable enterprises to accelerate digital transformation while maintaining regulatory standards. As industries seek more targeted and value-driven cloud applications, IBM Bluemix’s adaptability positions it favorably to capture growth across diverse verticals and emerging economies.
- For instance, IBM has developed a cloud Kubernetes service for a healthcare provider that enabled the migration of patient systems to a secure, scalable cloud environment, improving delivery speed and lowering IT costs.
Key Challenges
High Implementation and Integration Costs
Despite its advantages, the high cost of implementing and integrating IBM Bluemix services poses a significant challenge for small and medium-sized enterprises. Deploying advanced Bluemix capabilities such as AI, IoT, and analytics often requires substantial investments in infrastructure and skilled personnel. Additionally, integration with legacy systems can lead to operational complexity and increased expenditure. These cost barriers limit adoption rates, especially among cost-sensitive organizations seeking affordable cloud alternatives with lower maintenance requirements.
Data Security and Compliance Concerns
Data protection and regulatory compliance remain critical challenges within the IBM Bluemix ecosystem. As enterprises increasingly rely on cloud-based services, concerns over data privacy, security breaches, and cross-border data transfers have intensified. Industries such as finance and healthcare face strict compliance standards that demand advanced encryption, monitoring, and governance capabilities. Failure to address these security challenges may hinder broader adoption, compelling IBM and its partners to continuously strengthen cybersecurity frameworks and compliance protocols across global markets.
Regional Analysis
North America
North America dominated the IBM Bluemix Services Market in 2024, accounting for 38.1% market share, with revenues increasing from USD 4,395.84 million in 2018 to USD 9,881.36 million in 2024. The region is projected to reach USD 65,285.03 million by 2032, expanding at a CAGR of 26.8%. Growth is driven by strong cloud infrastructure adoption, widespread digital transformation, and high investment in AI, IoT, and hybrid cloud platforms. The United States leads the region with extensive enterprise integration of Bluemix for application modernization and data-driven operations across BFSI, healthcare, and IT sectors.
Europe
Europe holds a significant 28.9% share of the global IBM Bluemix Services Market, growing from USD 2,815.80 million in 2018 to USD 6,137.65 million in 2024, and expected to reach USD 38,198.96 million by 2032 at a CAGR of 25.8%. Market growth is supported by stringent data protection regulations, digital innovation policies, and rapid adoption of hybrid cloud strategies. Key markets such as the UK, Germany, and France are investing heavily in AI-enabled cloud platforms, enabling enterprises to enhance automation, compliance, and operational agility through IBM’s Bluemix ecosystem.
Asia Pacific
Asia Pacific is the fastest-growing region, capturing 24.6% of the IBM Bluemix Services Market with a CAGR of 28.3%. The market increased from USD 2,895.60 million in 2018 to USD 6,865.37 million in 2024, and is forecasted to reach USD 49,954.01 million by 2032. Growth is fueled by large-scale digital transformation initiatives in China, Japan, India, and South Korea. The expanding start-up ecosystem and government support for cloud computing accelerate adoption, particularly across IT, telecom, and manufacturing industries, where Bluemix enables scalable AI, IoT, and analytics-driven solutions.
Latin America
The Latin America IBM Bluemix Services Market accounted for 5.9% market share in 2024, expanding from USD 661.20 million in 2018 to USD 1,487.67 million in 2024, and projected to reach USD 9,066.46 million by 2032 at a CAGR of 25.5%. Brazil and Mexico dominate the regional market, driven by increased demand for cloud-based enterprise applications and cost-effective digital infrastructure. The growth of e-commerce, fintech, and smart city initiatives further supports Bluemix adoption, as businesses prioritize agility, automation, and integration to enhance competitiveness and operational efficiency.
Middle East
The Middle East region represented 4.7% of the IBM Bluemix Services Market in 2024, growing from USD 443.46 million in 2018 to USD 945.99 million in 2024, and is anticipated to reach USD 5,659.98 million by 2032 at a CAGR of 25.2%. Expansion is driven by smart government initiatives, digital transformation programs, and rising investments in cloud computing across the GCC countries. IBM Bluemix adoption is accelerating in sectors such as government, BFSI, and oil & gas, where organizations leverage its hybrid cloud capabilities to enhance operational resilience and data management efficiency.
Africa
Africa accounted for 3.4% share of the IBM Bluemix Services Market in 2024, with revenue increasing from USD 188.10 million in 2018 to USD 604.09 million in 2024, and projected to reach USD 3,321.56 million by 2032, growing at a CAGR of 23.2%. The region’s growth is supported by the gradual expansion of cloud infrastructure and increasing digitalization in South Africa, Egypt, and Nigeria. Government modernization programs, coupled with the adoption of AI-driven cloud solutions in telecom and financial sectors, are expected to accelerate Bluemix deployment and foster long-term market expansion.
Market Segmentations:
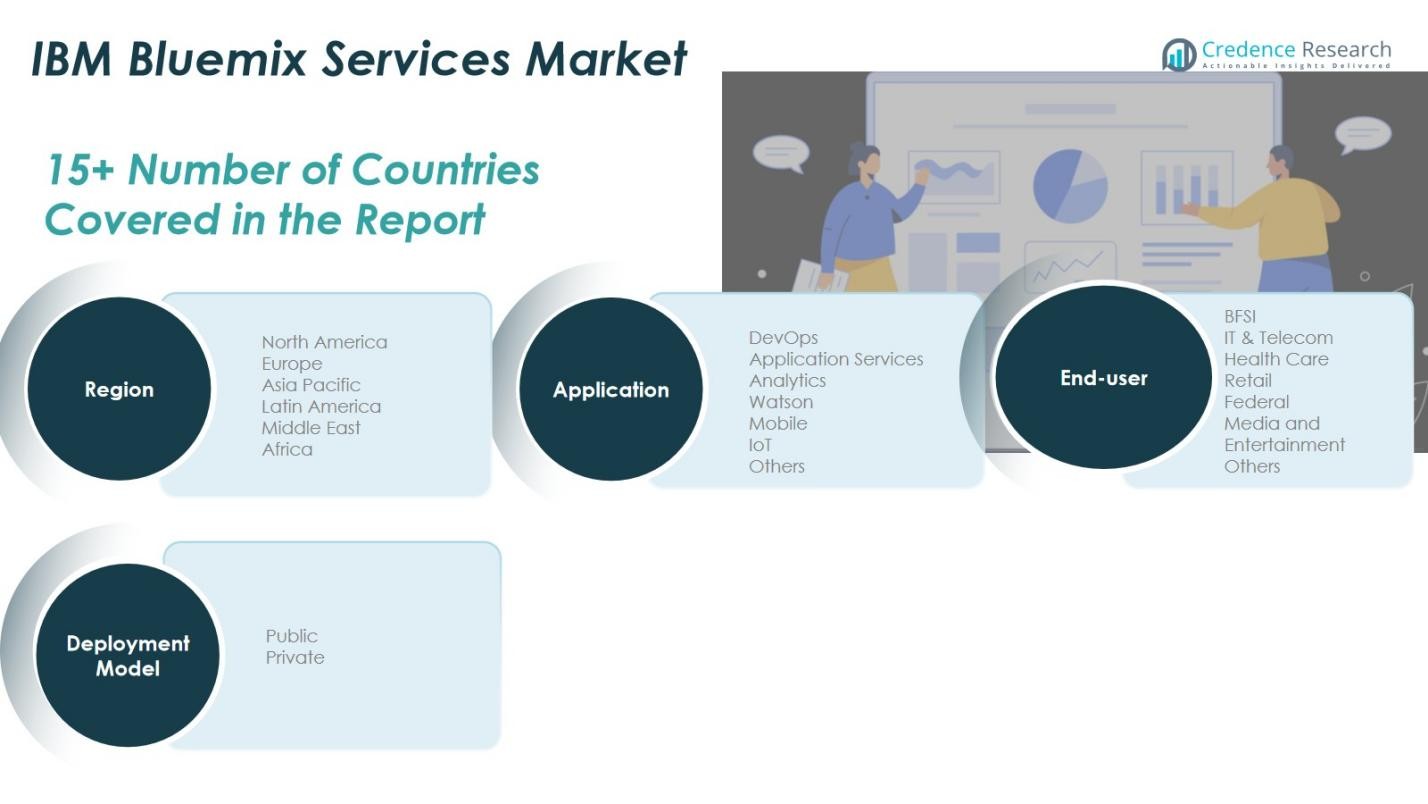
By Deployment Model
By Application
- DevOps
- Application Services
- Analytics
- Watson
- Mobile
- Internet of Things (IoT)
- Others
By End-User
- Banking, Financial Services, and Insurance (BFSI)
- IT & Telecom
- Healthcare
- Retail
- Federal (Government)
- Media and Entertainment
- Others
By Region
- North America
- Europe
- Asia Pacific
- Latin America
- Middle East
- Africa
Competitive Landscape
The competitive landscape of the IBM Bluemix Services Market is characterized by the strong presence of major technology providers such as Wipro Limited, Capgemini, Tech Mahindra Limited, Tata Consultancy Services (TCS), Infosys Limited, DXC Technology, Robert Bosch GmbH, Datamato Technologies, Prolifics Inc., Firebase, Google App Engine, Netify, Heroku, and Aquia Cloud. The market is moderately consolidated, with these players focusing on expanding cloud service portfolios, enhancing AI-driven integration, and developing industry-specific solutions. Strategic collaborations, product innovation, and investments in hybrid and multi-cloud capabilities are common growth strategies. IBM’s partnerships with system integrators and regional service providers strengthen its market reach, especially in emerging economies. Furthermore, increased competition in DevOps, IoT, and analytics-driven cloud services is prompting players to emphasize automation, cybersecurity, and compliance offerings. The rising demand for scalable, secure, and intelligent cloud platforms continues to intensify competition, encouraging continuous technological advancement across the global ecosystem.
Shape Your Report to Specific Countries or Regions & Enjoy 30% Off!
Key Player Analysis
- Wipro Limited
- Capgemini
- Tech Mahindra Limited
- Tata Consultancy Services Limited (TCS)
- Infosys Limited
- DXC Technology Limited
- Robert Bosch GmbH
- Datamato Technologies Pvt. Ltd.
- Prolifics, Inc.
- Firebase
- Google App Engine
- Netify
- Heroku
- Aquia Cloud
Recent Developments
- In July 2024, IBM completed its acquisition of StreamSets and webMethods from Software AG, strengthening its capabilities in data ingestion, API management, and integration enhancements that align with Bluemix’s integration and services ecosystem.
- In January 2025, e& (UAE telecom) announced a collaboration with IBM to deploy an end-to-end AI governance platform using IBM’s watsonx governance suite.
- In October 2025, IBM entered into a strategic partnership with Bharti Airtel to augment Airtel Cloud, enabling enterprises in India to deploy AI workloads and hybrid cloud services, and strengthening IBM’s footprint in the regulated-industry cloud segment.
- In April 2025, BNP Paribas signed a multi-year partnership agreement with IBM Cloud to expand its infrastructure, enhance resilience, and support generative AI workloads.
Report Coverage
The research report offers an in-depth analysis based on Deployment Mode, Application, End User and Region. It details leading market players, providing an overview of their business, product offerings, investments, revenue streams, and key applications. Additionally, the report includes insights into the competitive environment, SWOT analysis, current market trends, as well as the primary drivers and constraints. Furthermore, it discusses various factors that have driven market expansion in recent years. The report also explores market dynamics, regulatory scenarios, and technological advancements that are shaping the industry. It assesses the impact of external factors and global economic changes on market growth. Lastly, it provides strategic recommendations for new entrants and established companies to navigate the complexities of the market.
Future Outlook
- The IBM Bluemix Services Market is expected to witness strong growth driven by increasing enterprise cloud adoption.
- Integration of AI, machine learning, and automation will continue to enhance service capabilities.
- Hybrid and multi-cloud deployment models will become the preferred choice for global enterprises.
- Expansion in IoT-based applications will strengthen demand for scalable Bluemix platforms.
- Industry-specific cloud solutions will gain traction across BFSI, healthcare, and government sectors.
- Strategic partnerships and collaborations will play a key role in market expansion and innovation.
- Emerging economies in Asia Pacific and Latin America will offer significant growth opportunities.
- Enhanced data security and compliance features will remain critical for market competitiveness.
- Continuous innovation in DevOps and analytics services will drive digital transformation initiatives.
- The market will see increasing investments in cloud infrastructure modernization and automation tools.


