Flat output pushes Indian producers toward digital recovery
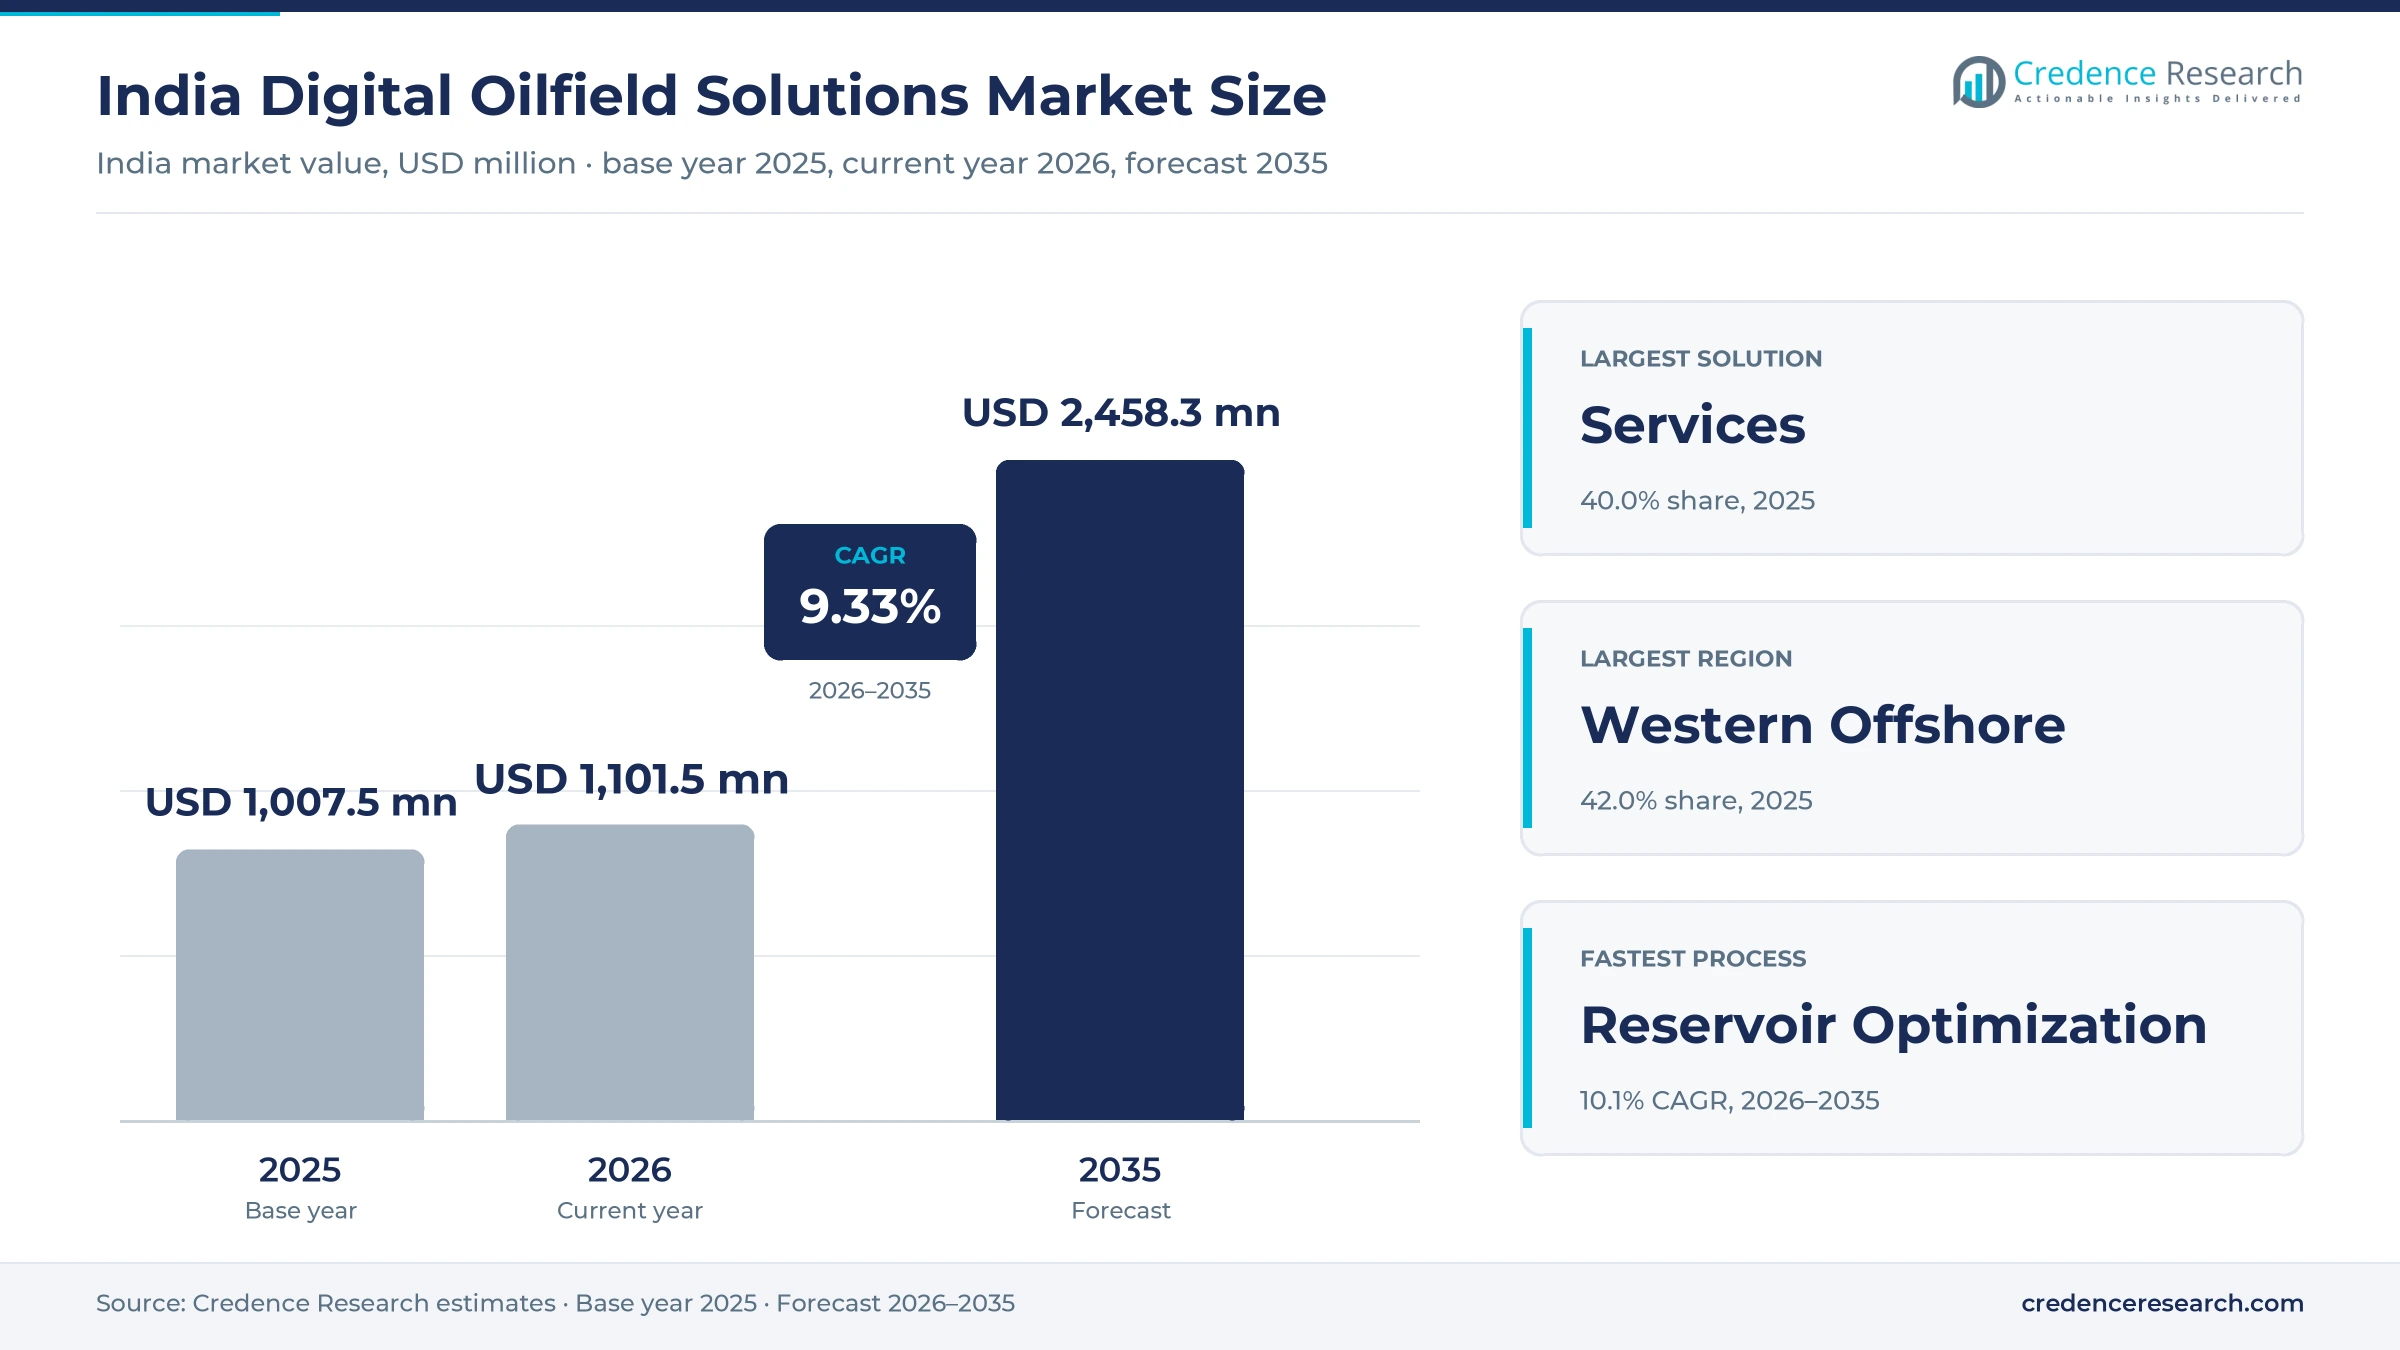
The India digital oilfield solutions market was valued at USD 1.01 billion in 2025 and is projected to increase from USD 1.10 billion in 2026 to USD 2.46 billion by 2035, registering a CAGR of 9.33% during 2026–2035. Demand comes from ONGC, which runs most nomination fields, from Oil India in the Northeast, and from private and joint venture operators led by Cairn Oil & Gas in Rajasthan. Western Offshore held the largest regional share, 42.0% in 2025, because Mumbai High and nearby fields carry the largest share of crude reserves, platforms and control systems. East Coast is the fastest-growing zone at 10.4% a year, as deepwater wells off the Krishna-Godavari, Mahanadi and Andaman basins add seismic, logging and drilling data work. Producers are moving well data into central production control rooms and are paying outside technical partners for measured output gains, while flat national output keeps budgets tied to recovery rather than new capacity.
Which tools and services make up digital spending at Indian fields?
The market counts field sensors, wellhead telemetry, remote terminal units, control and safety systems, and the software and services that turn well, platform and reservoir data into operating decisions for producers in India. It covers reservoir modeling and seismic interpretation, production monitoring and optimization, real-time drilling and logging data services, and the integration, hosting, cybersecurity and remote support that keep these systems running.
Drilling rigs, platform steel, pipelines, completion hardware and seismic acquisition vessels are excluded, although much digital value reaches buyers inside the same platform, logging and well service contracts. Value flows from service companies, automation vendors and Indian IT firms to ONGC, Oil India, Cairn and other operators, mostly through public tenders and multiyear service agreements.
India Digital Oilfield Solutions Market Insights
- The India digital oilfield solutions market rises from USD 1.01 billion in 2025 to USD 2.46 billion by 2035, a 9.33% CAGR during 2026–2035, as recovery services add value.
- Western Offshore held 42.0% of 2025 value, because the zone holds 31.76% of crude reserves and the platforms that need the most control and monitoring.
- Services led with 40.0% of 2025 value, because ONGC and its partners buy logging, technical and IT services under multiyear contracts.
- India produced 28.70 million metric tons of crude oil in fiscal 2024-25, and ONGC output fell a further 1.1% in fiscal 2025-26, which keeps operators focused on recovery.
- ONGC named bp technical services provider for Mumbai High in February 2025 and extended the model to the Western Offshore Basin in June 2026.
Services lead while software and reservoir work gain
Services lead while software grows on AI and twin projects
Based on solution, the market is categorized into hardware, software and services. Services led with 40.0% of 2025 value because national operators buy data as a service, and Baker Hughes said in the second quarter of 2026 that ONGC awards will deploy up to 46 wireline logging units and seven drill stem testing kits from Mumbai High to the Assam-Arakan basin. Software grows fastest at 10.6% a year, as Cairn now runs a generative AI platform called iCAIRN on well completion reports and a digital twin that cuts flaring, CXOToday reported in May 2026.
Offshore wells lead while onshore fields instrument fastest
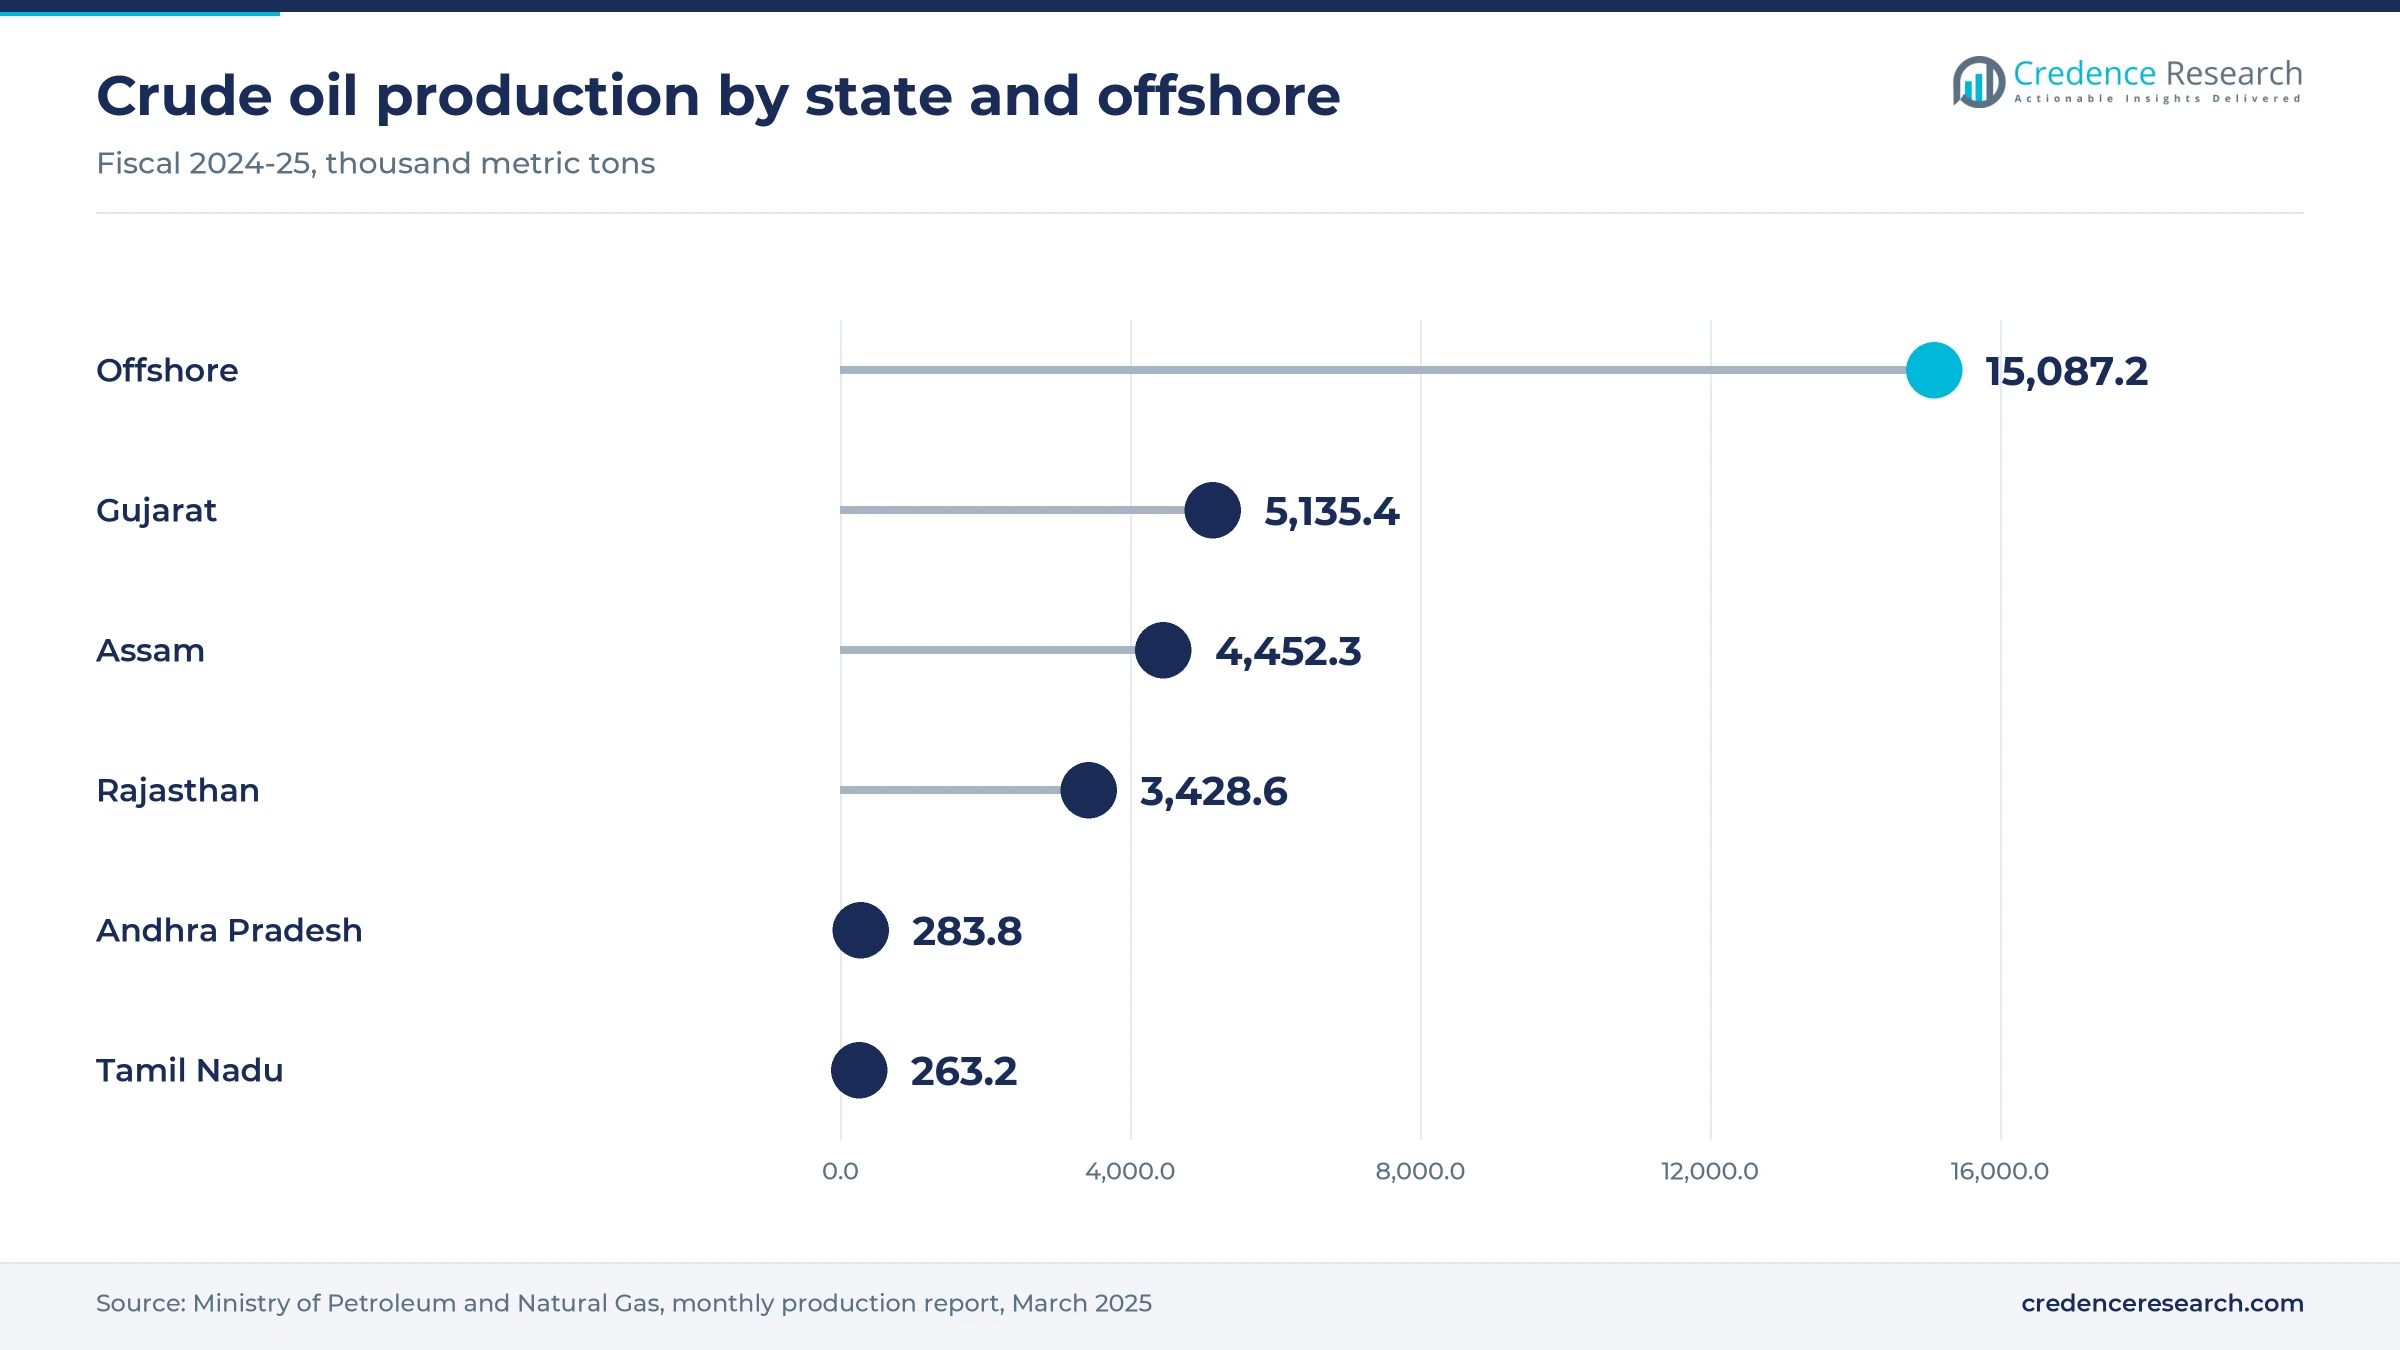
Based on application, the market is categorized into onshore and offshore. Offshore led with 60.0% of 2025 value because offshore fields produced 15,087 thousand metric tons of crude in fiscal 2024-25 against 13,614 thousand metric tons onshore, the petroleum ministry reported, and each platform carries more control and safety systems per barrel. Onshore grows fastest at 9.6% a year, as Oil India and Kellton put 77 production wells and 46 well plinths on a real-time wellhead monitoring platform in June 2026, and Kellton said the rollout took six months, which shows how fast scattered onshore wells can be connected.
Production work leads while reservoir modeling grows fastest
Based on process, the market is categorized into reservoir optimization, production optimization and drilling optimization. Production Optimization led with 45.0% of 2025 value because ONGC is building a production operation control center in Panvel that uses digital twins to tune artificial lift and AI to locate offshore trunkline leaks, the Society of Petroleum Engineers reported in September 2025. Reservoir Optimization grows fastest at 10.1% a year, as Cairn plans to extend alkaline-surfactant-polymer flooding across Mangala, Bhagyam and Aishwariya and uses AI-driven reservoir modeling, Hellenic Shipping News reported in February 2026.
On-premises systems lead while cloud services gain
Based on deployment, the market is categorized into on-premises and cloud-based. On-Premises led with 66.0% of 2025 value because national exploration data sits in the government National Data Repository, which Halliburton was contracted to build and run in February 2014, according to the Directorate General of Hydrocarbons. Cloud-Based grows fastest at 10.3% a year, as ONGC awarded CIPL a three-year, INR 125 crore contract in March 2026 that includes cloud-first strategies across 47 locations, PSU Connect reported. Platform control systems still stay on site because of latency and safety rules.
| Segment Group | Leading Sub-segment | Share, 2025 | Fastest-growing Sub-segment | CAGR, 2026–2035 |
|---|---|---|---|---|
| By Solution | Services | 40.0% | Software | 10.6% |
| By Application | Offshore | 60.0% | Onshore | 9.6% |
| By Process | Production Optimization | 45.0% | Reservoir Optimization | 10.1% |
| By Deployment | On-Premises | 66.0% | Cloud-Based | 10.3% |
Project fees and output-linked deals set digital prices
Digital oilfield work in India is priced in three ways, as fixed-price public sector tenders, as multiyear service and IT contracts, and increasingly as fees linked to measured output gains. Operators rarely publish the digital share of platform or well contracts, so the per-well and per-platform ranges below are Credence Research estimates with wide error bands. Lowest-bid tendering keeps unit prices low, while outcome-linked deals let suppliers with proven analytics earn more when production rises. Most software licenses are priced in U.S. dollars, so rupee moves change buyer costs.
| Offer or input | Typical price or fee | Basis |
|---|---|---|
| Digital wellhead monitoring rollout, Oil India, 77 wells and 46 plinths | About USD 2.5 million per project | Whalesbook, June 2026 |
| AI-led IT modernization, digitalization and cybersecurity for ONGC, three years | INR 125 crore in total | PSU Connect, March 2026 |
| Technical services provider model, Mumbai High | Fixed fee for two years, then a production-linked fee | bp, February 2025 |
| Production monitoring and optimization software, per producing well | USD 400 to USD 1,500 per well per month | Credence Research estimate; no public list price |
| Wellhead platform instrumentation, control and safety package | USD 2 million to USD 6 million per platform | Credence Research estimate from package scope |
Request a Free Sample
Fill in your details and we'll send you a free sample report.
- Sample data tables & charts
- Research methodology
Recovery targets, capex and offshore rework lift demand
Flat national output makes every recovered barrel count
Domestic output has stopped growing, so operators spend on tools that slow decline instead of waiting for new discoveries. India produced 28.70 million metric tons of crude oil in fiscal 2024-25, the petroleum ministry reported. ONGC crude output then fell another 1.1% in the following fiscal year, and its gas output also slipped, the company said in August 2026. ONGC realized USD 99.45 per barrel in the April to June 2026 quarter, well above a year earlier, which raises the value of each extra barrel that surveillance, well tests and lift tuning can add. Operators therefore judge digital projects by barrels saved from decline, which favors tools that show results within a single budget year.
Upstream capital budgets fund wells that need data
Large drilling and development budgets pull digital spending along, because each new well and platform needs logging, monitoring and control. ONGC said it invested more than INR 35,000 crore in fiscal 2025-26 and plans to keep capital spending above INR 30,000 crore a year, Business Today reported in September 2026. Oil India spent about INR 80 billion in fiscal 2024-25 against a plan of INR 68.80 billion and expected to exceed its INR 70 billion budget for fiscal 2025-26, Informist reported in November 2025. Cairn has set aside USD 4 billion for capital investment across its assets. Sustained budgets give service companies a steady base of well and platform work.
Western offshore redevelopment adds platforms and pipelines
The western offshore fields are being rebuilt, and each new structure arrives with instruments and control systems. Western Offshore assets account for about two-thirds of ONGC production, the company told its 2026 annual meeting, Business Today reported. L&T said in August 2026 that ONGC awarded it EPCIC contracts for four wellhead platforms and a subsea pipeline replacement project off the west coast, World Oil reported. ONGC expects its standalone output to reach about 40 million metric tons of oil and oil-equivalent gas in fiscal 2027-28, led by western offshore projects. Its June 2026 technical services deal with bp covers 43 blocks in the same basin. These awards favor automation suppliers and analytics providers that already know ONGC platform standards.
New acreage rounds and legal reform widen exploration data
Larger exploration acreage creates demand for seismic interpretation, basin modeling and data management. Parliament approved the Oilfields (Regulation and Development) Amendment Bill on March 12, 2025, replacing mining leases with petroleum leases, a wording change aimed at foreign operators that had found the old lease term confusing. OALP-X offers about 25 blocks over roughly 182,589 sq km, and OALP-XI, launched in March 2026, adds 21 blocks over about 80,228 sq km, Angel One reported. Category II and III blocks are awarded on committed work programs, which favors bidders that plan seismic and drilling data work early. Winners of these blocks will need basin studies, data room access and well planning software within their first work program phase.
Control centers and paid-for-results contracts spread
Central control rooms shift from pilots to daily operations
Indian producers are shifting from field-by-field readings toward central control rooms, which creates steady demand for visualization, analytics and integration services. ONGC inaugurated NETRA, an integrated digital platform for its production operation control center, at its IPEOT institute in April 2026, PSU Connect reported. The Panvel control center described above is designed to connect field instrumentation with ERP systems for real-time surveillance and failure forecasting, the Society of Petroleum Engineers reported. ABB said in April 2025 that it commissioned cloud-hosted SCADA systems for more than 20,000 km of IndianOil pipelines with a 10-year service contract. Suppliers that link field data, control rooms and service desks gain repeat work.
Producers shift toward fees tied to incremental output
ONGC is shifting from fixed-scope service orders toward contracts that pay partners for measured production gains, which favors suppliers with strong subsurface analytics. Under its Mumbai High deal, bp said in February 2025 that it receives a fixed fee for two years and then a service fee linked to incremental oil and gas output. ONGC extended bp to fields across the Western Offshore Basin in June 2026, a model built on Mumbai High results, bp said in a later release. bp also noted that ONGC produces 63% of the oil and gas in India. Outcome-based contracts reward providers that can prove gains through well and reservoir data.
Deepwater drilling program opens new subsurface data work
The planned deepwater campaign creates an opening for real-time drilling, logging and seismic processing services in basins with little producing history. ONGC plans to invest about INR 1 lakh crore over five years in deepwater and ultra-deepwater assets and to drill 87 wells by fiscal 2030-31, Business Today reported in September 2026. The government approved an INR 84,084 crore outlay for its Samudra Manthan deepwater program. ONGC said in August 2026 that it is drilling the first of four planned deepwater wells in the Mahanadi offshore basin. Frontier wells carry high uncertainty, so operators buy more pore-pressure, logging and live drilling data per well.
Mature onshore growth plans open room for EOR monitoring
Onshore producers that target higher output from old fields form a growing buyer group for well surveillance and enhanced oil recovery monitoring. Oil India plans to raise crude output from about 3.55 million metric tons in fiscal 2025-26 to 4 million metric tons in fiscal 2027-28, with gas at 4.6 billion cubic meters, Informist reported. Cairn targets 300,000 barrels of oil equivalent per day in the near term, against recent output above 103,000 a day. Polymer and chemical floods need close monitoring of injection and water cut. Suppliers that price telemetry and analytics per well can win these mid-sized onshore programs.
Single-buyer tenders, cyber risk and unrest weigh
One dominant buyer concentrates tender and pricing risk
ONGC nomination fields supplied about 64% of crude output in fiscal 2024-25, 18.47 of 28.70 million metric tons, ministry data show, so one tender calendar sets most supplier volumes. Public sector tenders favor the lowest compliant bid, which compresses margins on software and integration work. Smaller software vendors are most exposed when one large award slips. Partnering with qualified integrators and selling to Oil India and private operators spreads this risk.
Ransomware puts geoscience and business systems at risk
A ransomware attack hit Oil India headquarters in Duliajan on April 10, 2022, starting at a geology and reservoir workstation, and the attacker demanded USD 7.5 million, ThePrint reported. Drilling and production continued, but servers and desktops were taken offline. Operators connecting field networks to cloud analytics are most exposed, and spending on industrial cybersecurity raises the cost and approval time of every new digital project.
Northeast disruptions delay field programs and budgets
Oil India cut its fiscal 2025-26 crude estimate to about 3.55 million metric tons from 3.70 million metric tons, citing blockades in the Northeast that forced shutdowns, Informist reported in November 2025. Field crews cannot install or maintain sensors during closures, and lost output trims discretionary budgets. Telemetry and service suppliers in Assam and Arunachal Pradesh are most exposed. Remote monitoring reduces site visits but cannot replace physical access.
Slow bid rounds stretch exploration data demand
The government extended the OALP-X bid deadline a fourth time, by three months to May 29, 2026, as companies adjusted to new upstream rules, PSU Watch reported. Each delay pushes back the seismic interpretation, basin modeling and well planning work that new blocks would create. Subsurface software vendors and seismic data processors are the most exposed. Brownfield recovery work offsets part of the gap while new blocks remain unawarded.
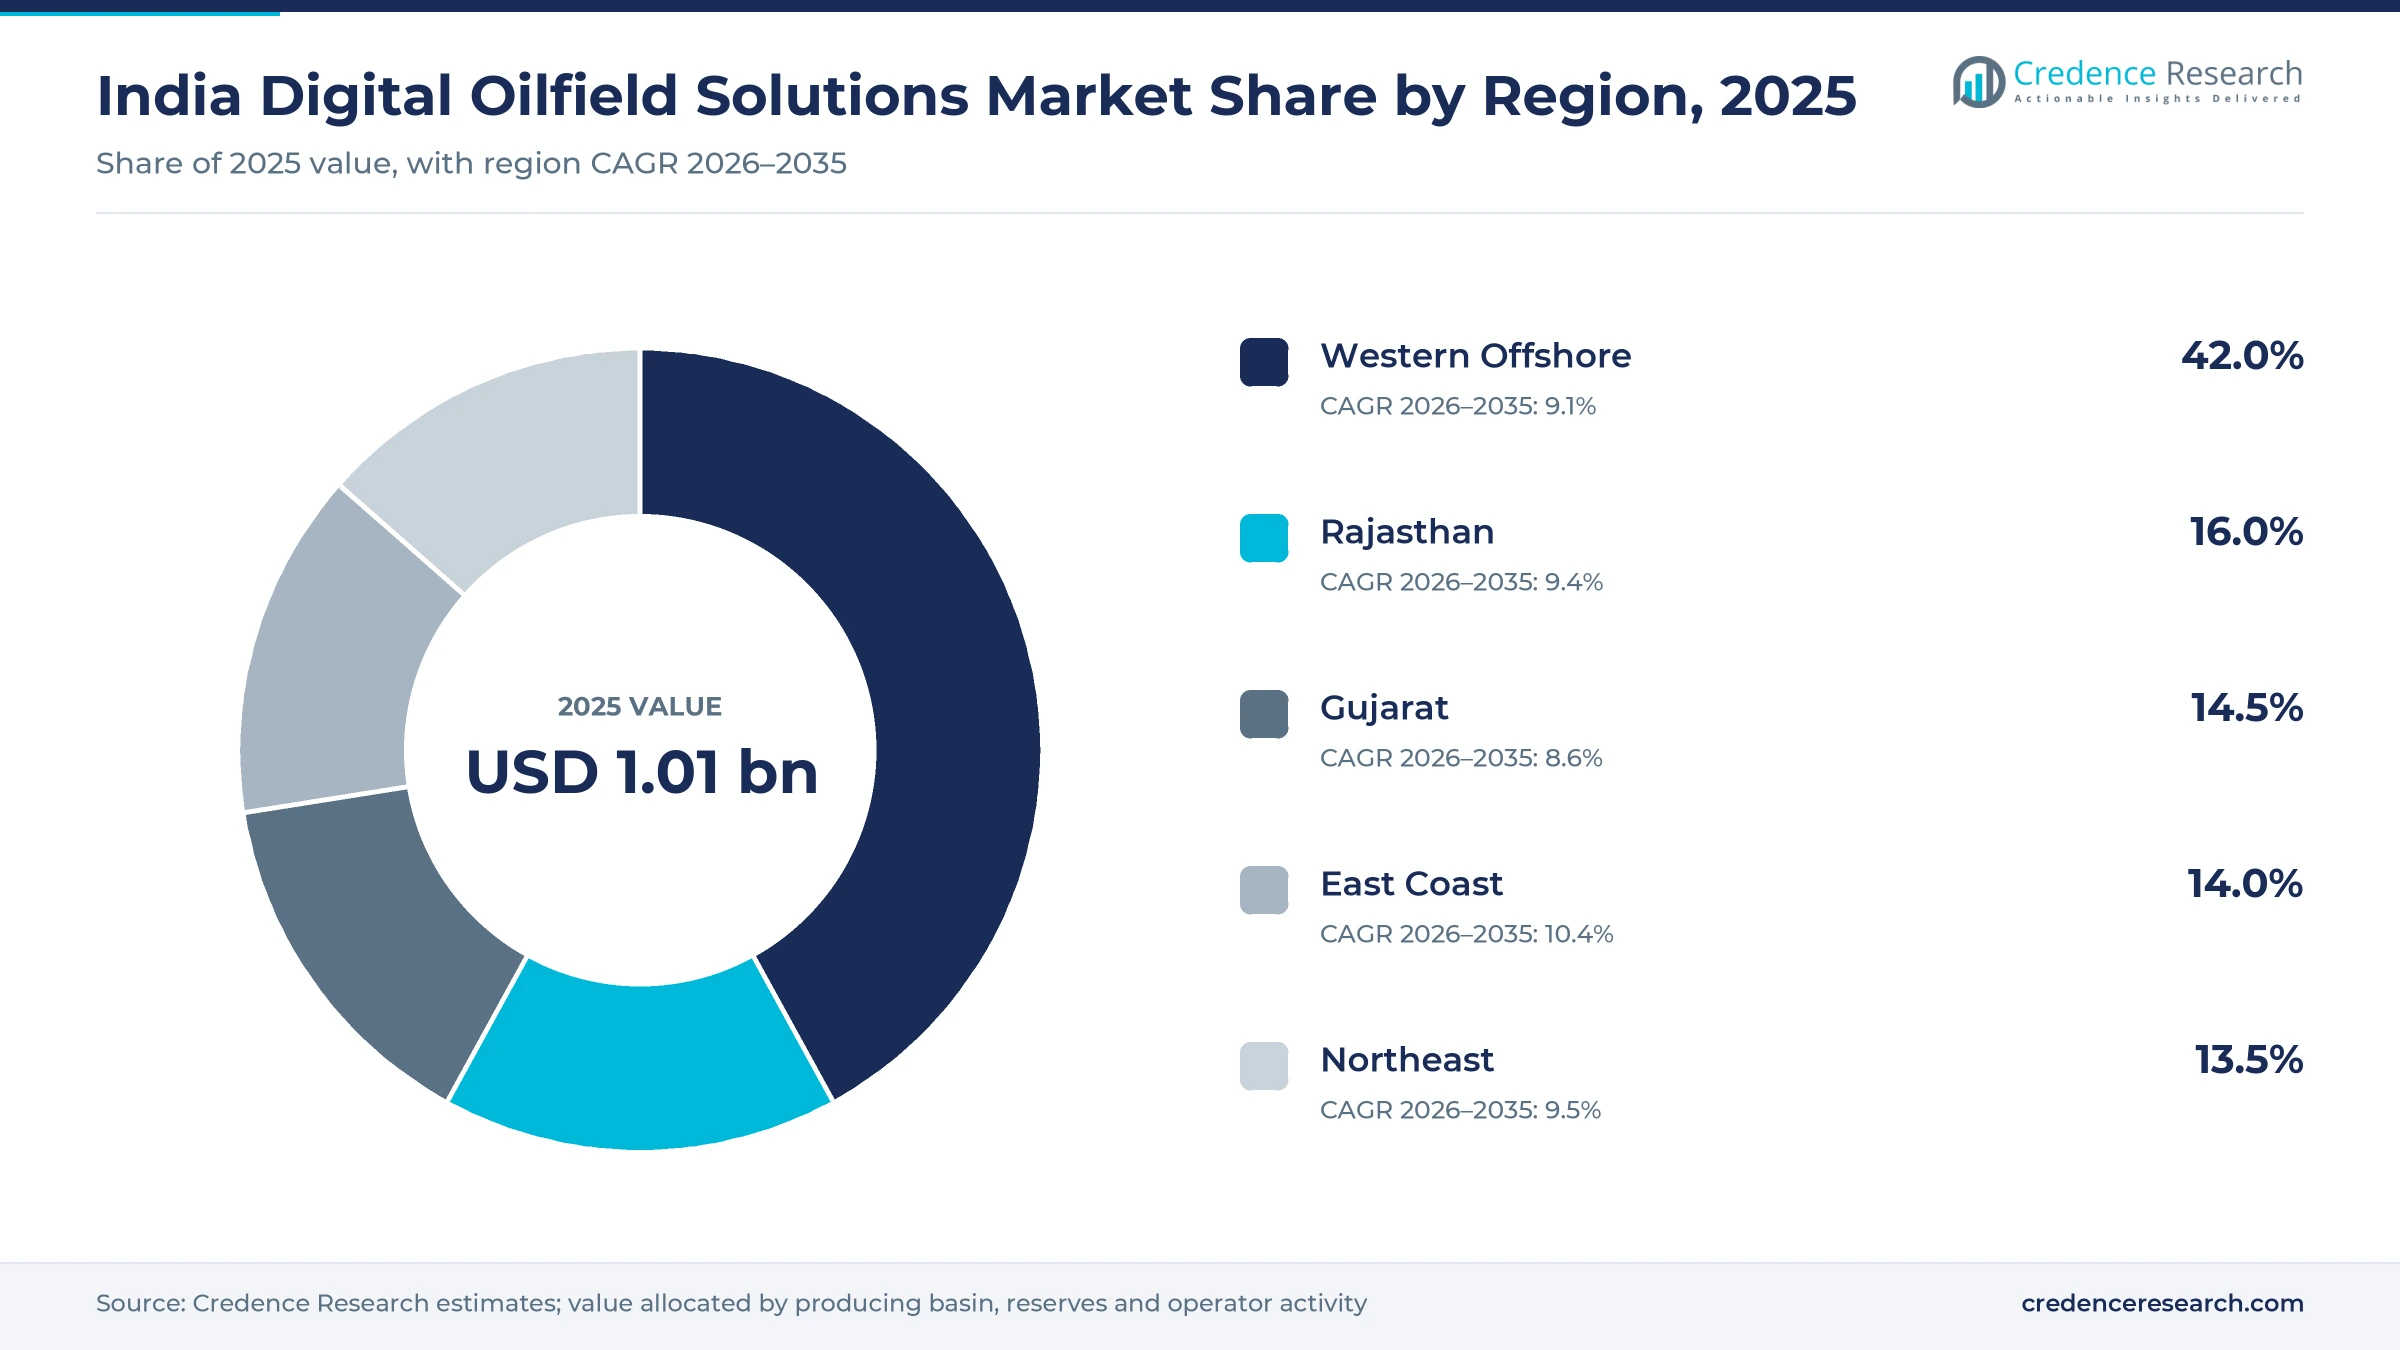
Western offshore leads while the East Coast grows fastest
Credence Research groups India into five zones, Western Offshore, Gujarat, Rajasthan, the Northeast and the East Coast. Regional shares are Credence Research estimates based on output, reserves and operator activity, and national statistics office data show how crude reserves were spread across these zones on April 1, 2024.
| Region | Value, 2025 (USD billion) | Share, 2025 | CAGR, 2026–2035 |
|---|---|---|---|
| Western Offshore | 0.42 | 42.0% | 9.1% |
| Rajasthan | 0.16 | 16.0% | 9.4% |
| Gujarat | 0.15 | 14.5% | 8.6% |
| East Coast | 0.14 | 14.0% | 10.4% |
| Northeast | 0.14 | 13.5% | 9.5% |
Western offshore leads on Mumbai High platforms and reserves
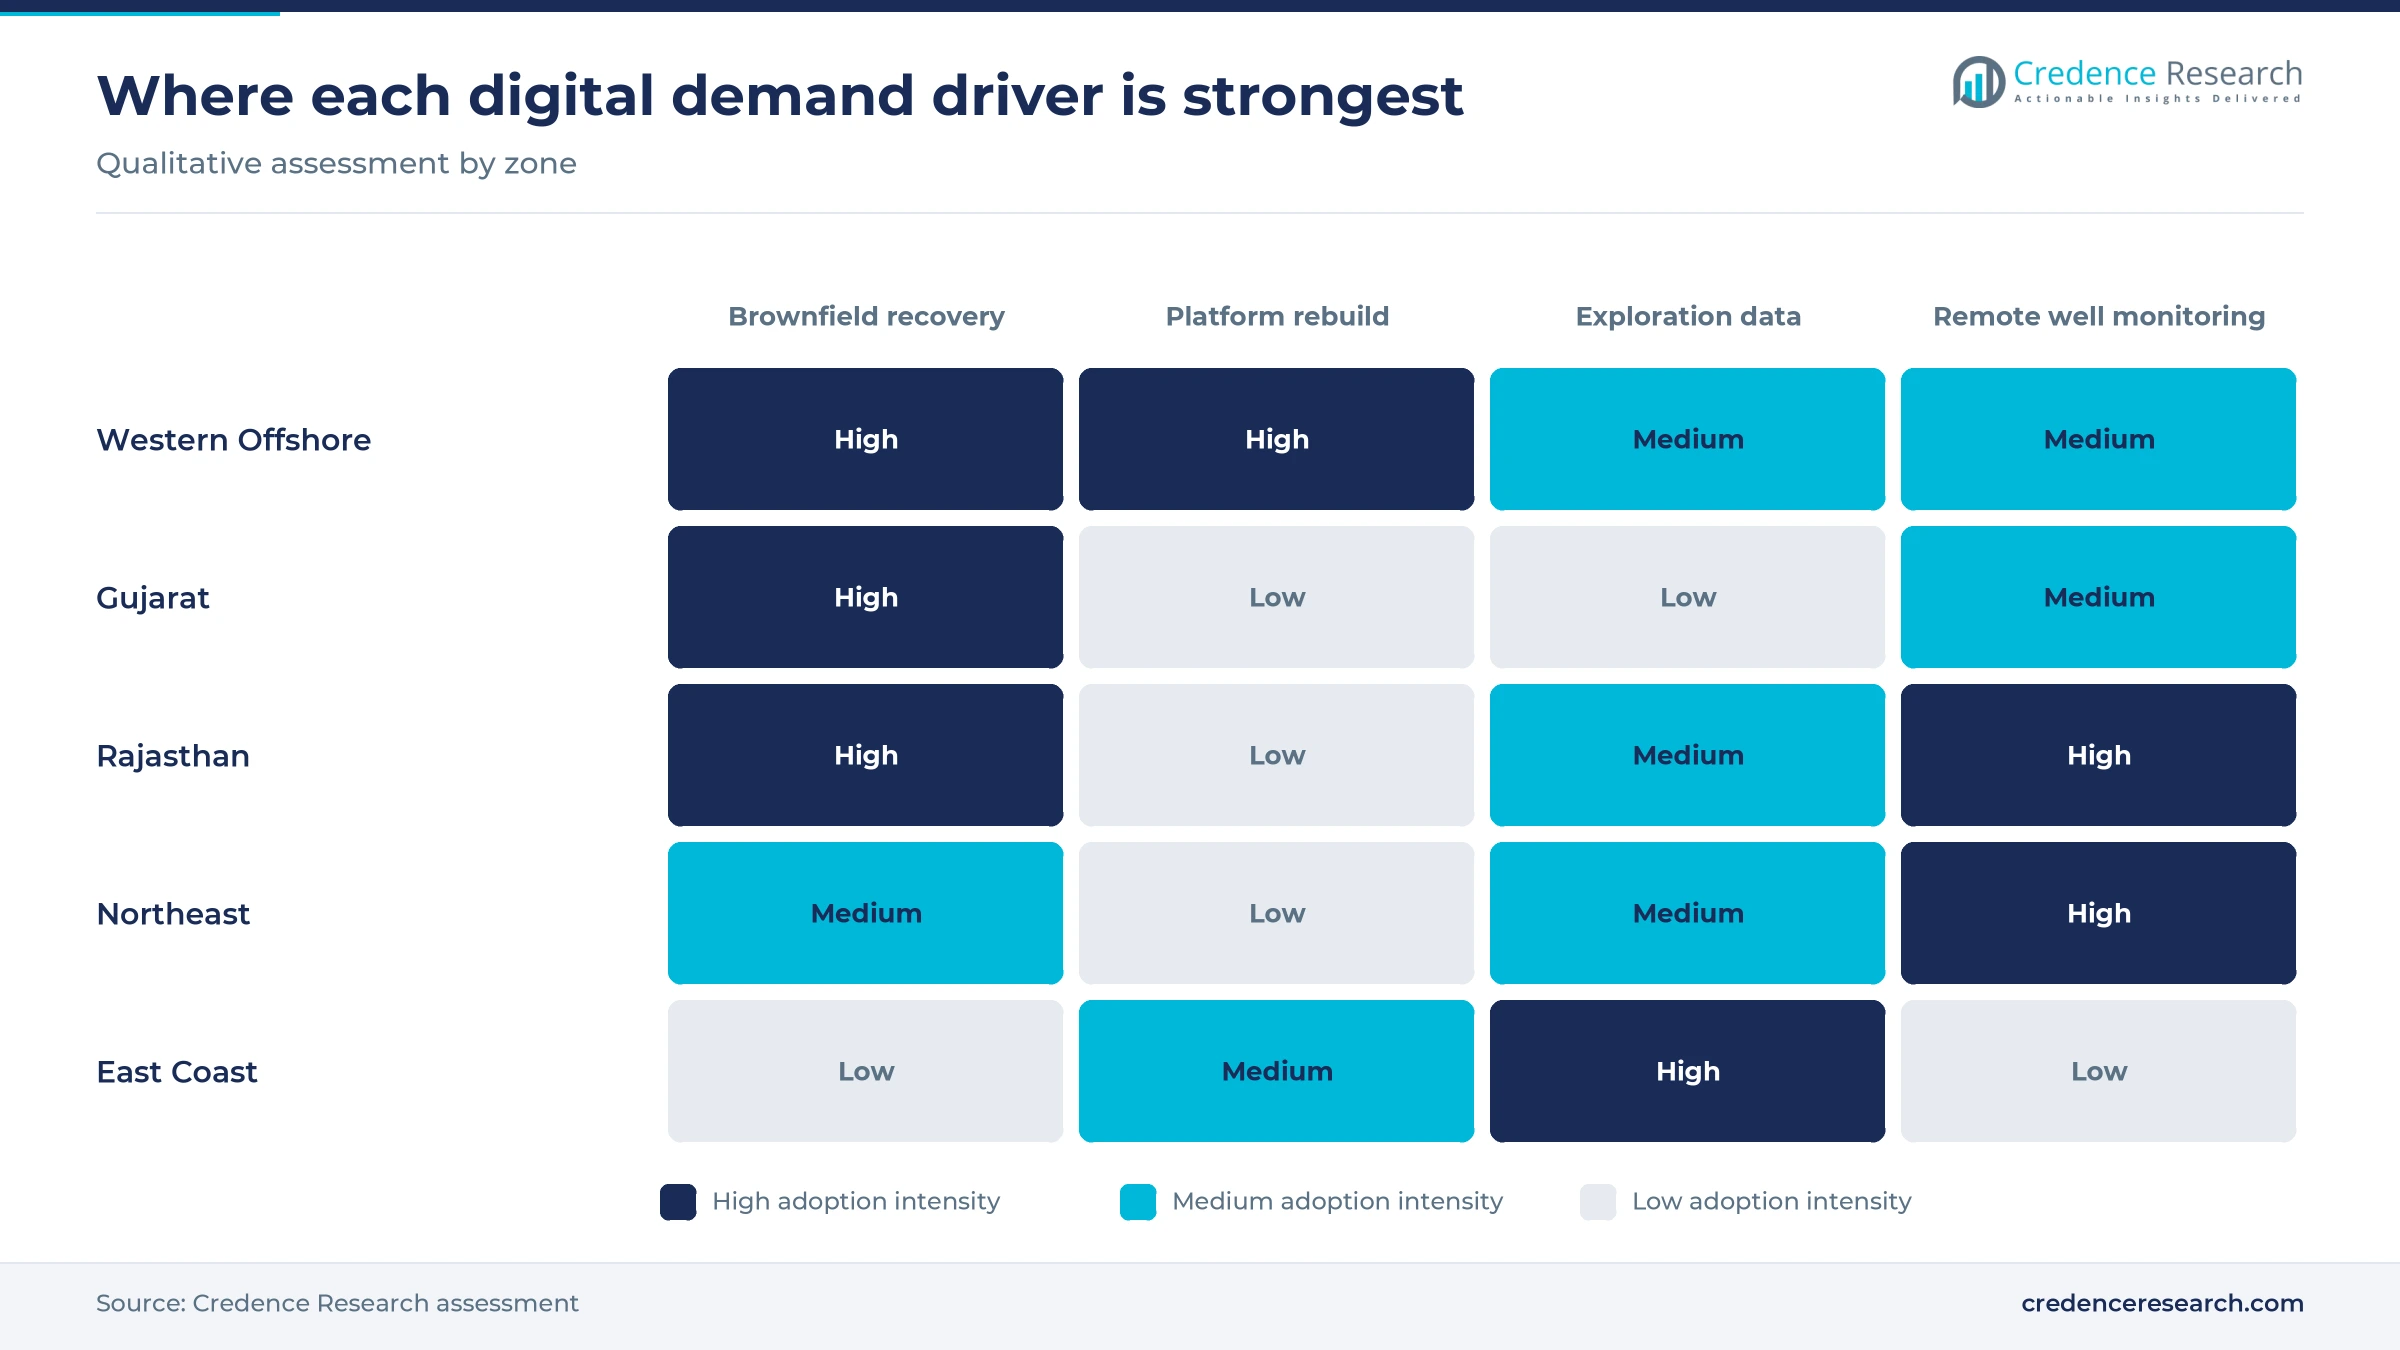
Western Offshore held a regional share of 42.0% in 2025 and grows at 9.1% a year. The zone holds 31.76% of crude reserves and 31.28% of gas reserves, the largest share of both, according to the national statistics office. Mumbai High, Bassein and Neelam Heera rely on networks of linked platforms and trunklines, so control, safety and surveillance systems carry the most value here. The bp technical services contracts described above keep reservoir and well analytics work concentrated in the zone.
Rajasthan grows on Cairn polymer floods and AI tools
Rajasthan held a regional share of 16.0% in 2025 and grows at 9.4% a year. The state produced 3,429 thousand metric tons of crude in fiscal 2024-25, about 12% of national output and almost all from private and joint venture fields, ministry data show and the state holds 19.59% of crude reserves, according to the national statistics office. Polymer and chemical floods across the Barmer fields need close injection monitoring, which keeps software and analytics spending per well higher than in older nomination fields.
Northeast digitizes old wells under Oil India programs
The Northeast held a regional share of 13.5% in 2025 and grows at 9.5% a year. Assam produced 4,452 thousand metric tons of crude in fiscal 2024-25, mostly from Oil India fields, and holds 21.66% of crude reserves. The Kellton wellhead project described above shows how Oil India is moving from manual readings to telemetry across old onshore wells. Spread-out fields, long distances and periodic blockades favor remote monitoring that cuts site visits.
Gujarat relies on mature onshore fields and artificial lift
Gujarat held a regional share of 14.5% in 2025 and grows at 8.6% a year, the slowest of the five zones. Onshore fields in the state produced 5,135 thousand metric tons of crude in fiscal 2024-25, mostly from ONGC assets around Ankleshwar, Mehsana and Ahmedabad, and the state holds 17.70% of crude reserves. Many wells depend on artificial lift, so spending centers on pump monitoring, well tests and lift optimization rather than new platform systems.
East Coast grows fastest on deepwater gas and frontier wells
The East Coast held a regional share of 14.0% in 2025 and grows at 10.4% a year, the fastest of the five zones. Eastern Offshore holds 24.07% of gas reserves but only 6.06% of crude reserves, the national statistics office reports, while onshore Andhra Pradesh and Tamil Nadu produced 284 and 263 thousand metric tons of crude in fiscal 2024-25. Deepwater wells in the Krishna-Godavari, Mahanadi and Andaman basins need real-time drilling and logging data.
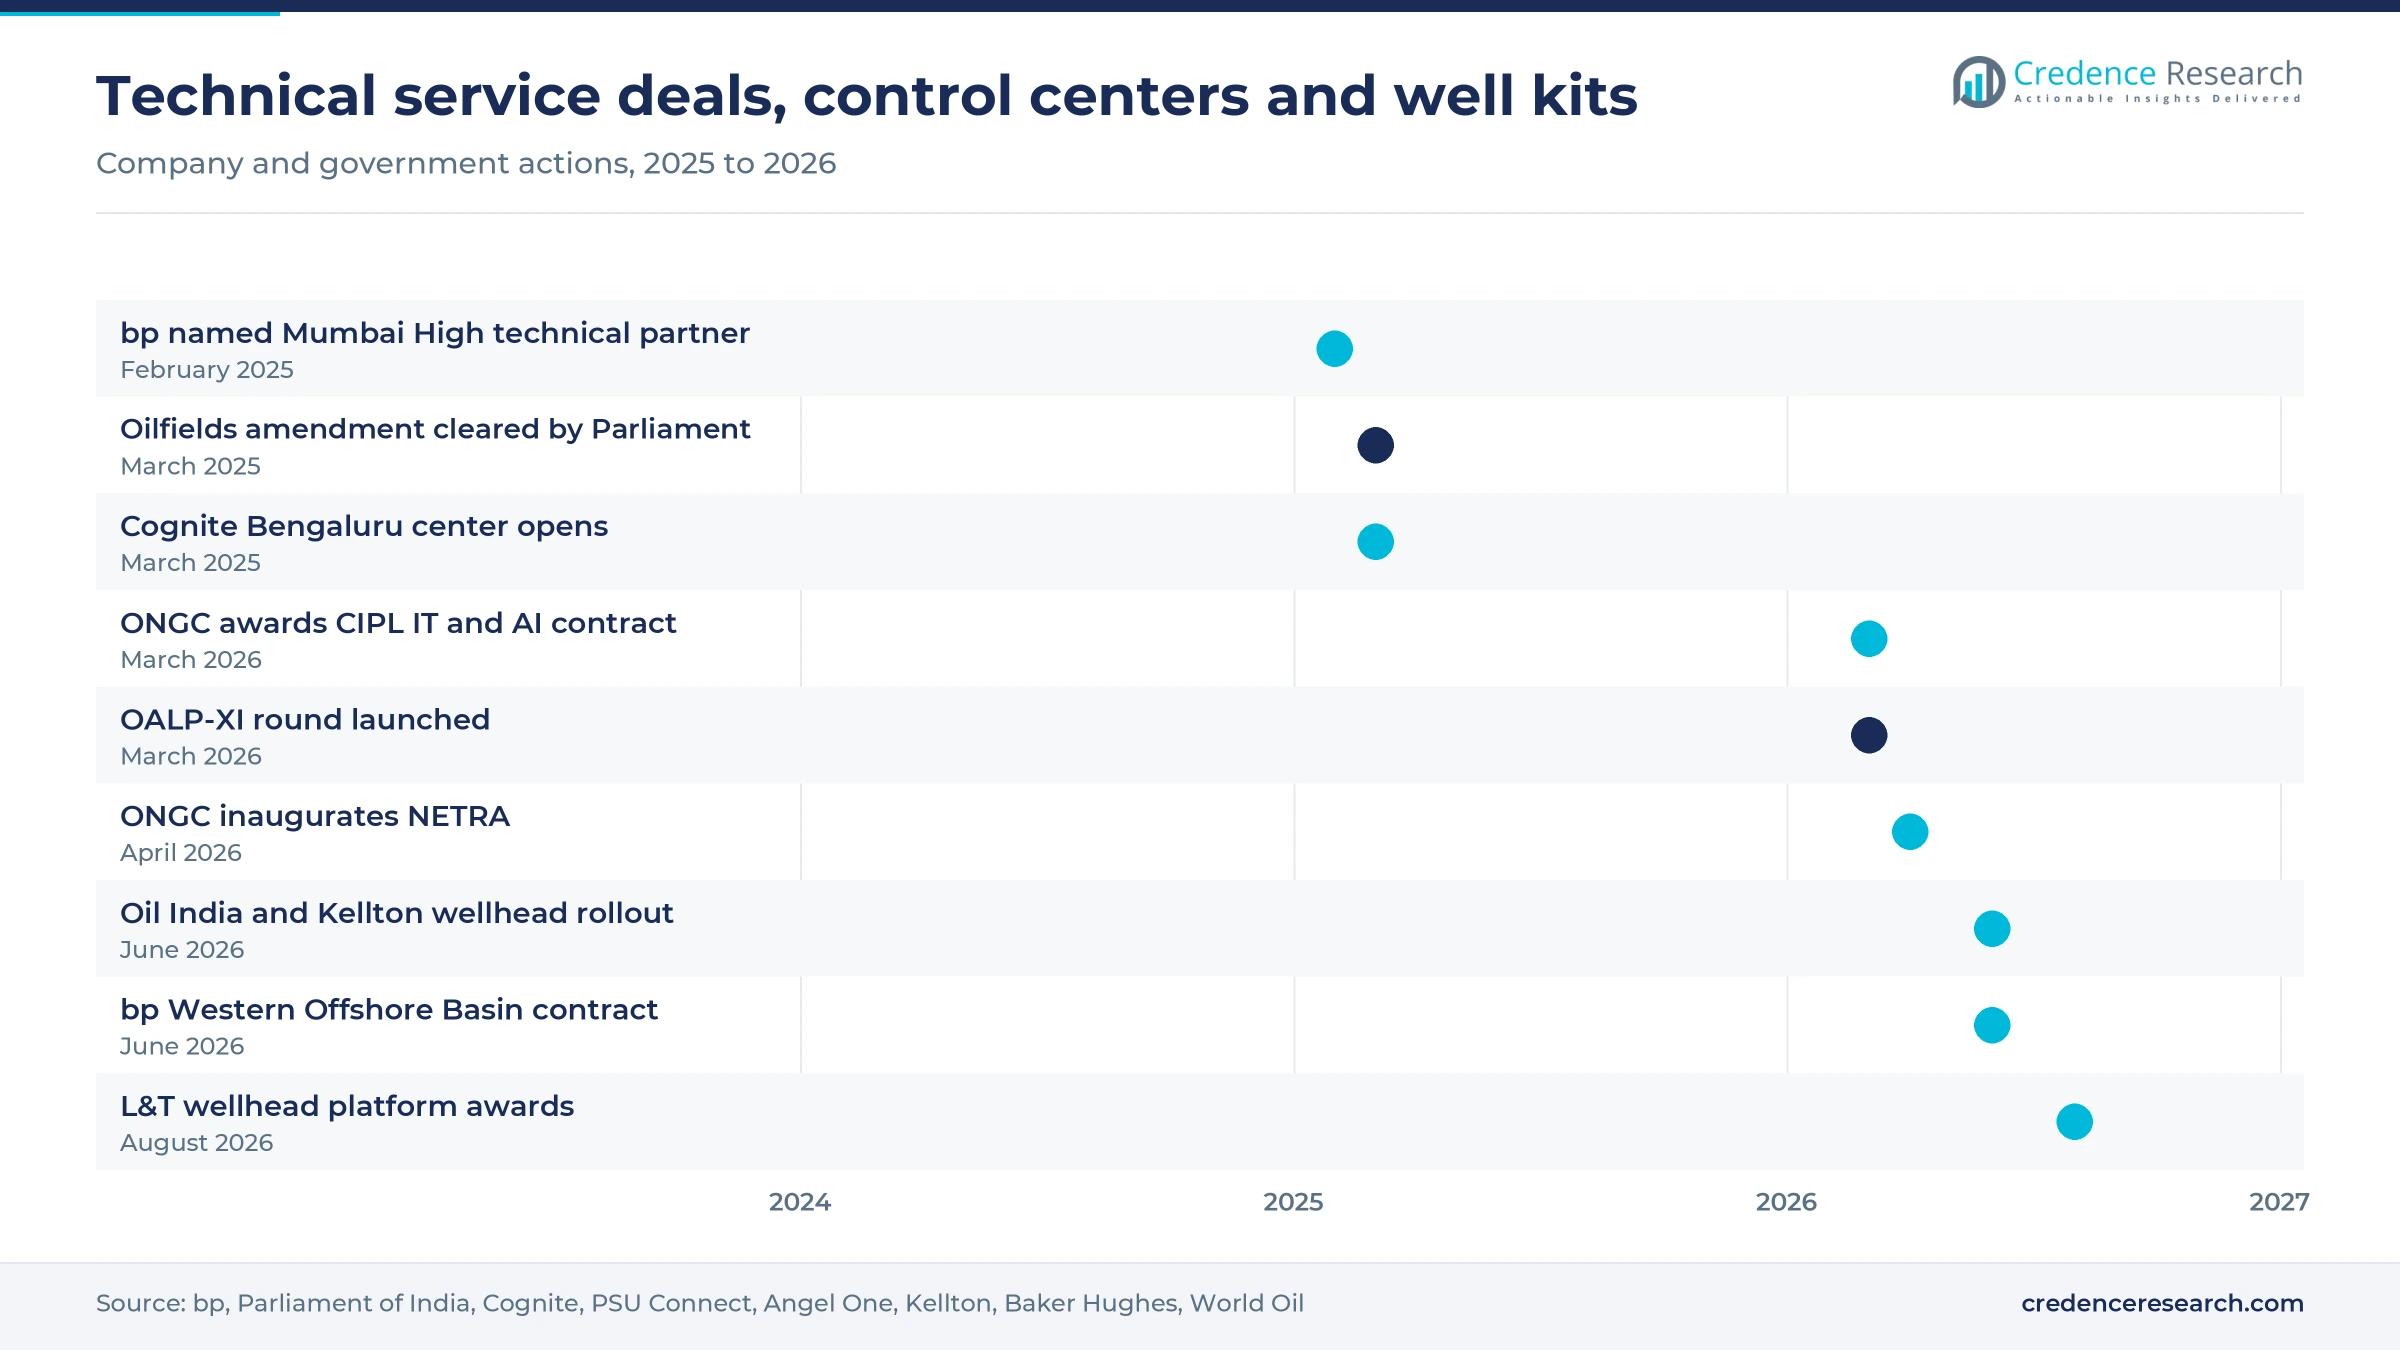
Technical service deals, control centers and well kits
| Development | Status and market relevance |
|---|---|
| In February 2025, ONGC signed a contract making bp the technical services provider for the Mumbai High field. | Contract signed; bp was due to start work by March 2025. |
| In March 2025, Cognite opened a center in Bengaluru to serve industrial customers in India, including oil and gas. | Operational launch; the company plans more than 100 hires. |
| In April 2026, ONGC inaugurated NETRA, the integrated digital platform for its production operation control center. | Operational launch at IPEOT under the "Bytes to Barrel" program. |
| In June 2026, Oil India and Kellton completed a digital wellhead monitoring rollout across onshore production wells. | Completed deployment, delivered within six months. |
| In June 2026, ONGC and bp signed a technical services contract for fields across the Western Offshore Basin. | Contract signed; it covers 43 blocks and extends the Mumbai High model. |
Wireline data, well telemetry, twins and AI search
- Wireline logging and drill stem testing give operators formation pressure and fluid data that set completion, perforation and recovery plans for each new or reworked well.
- Wellhead telemetry with edge gateways sends pressure, flow and pump data from remote onshore wells to central dashboards in real time, which cuts manual rounds across scattered fields.
- Digital twins of wells and lift systems let engineers test lift settings, choke positions and well choices on a model before changing live field operations.
- Generative AI search on technical records pulls answers from completion reports, field plans and contracts that engineers once read by hand.
Need a Custom Version of This Report?
Tailor the scope, geography, or segments to your exact requirements.
- Custom geography or segment scope
- Direct access to our analyst team
Service majors and local IT firms split the work
Competition in the India digital oilfield solutions market is led by integrated service companies that sell data and software inside well and logging contracts. Baker Hughes holds new ONGC wireline and well testing awards, Halliburton built and ran the national data repository, and SLB with Cognite won a Cairn contract for data-driven production and reservoir management. Weatherford supplies logging equipment that is used at ONGC onshore assets. ABB, Honeywell and Yokogawa compete for control, safety and SCADA systems, while Kellton has shown that Indian software firms can win wellhead monitoring work at Oil India. Buyers judge suppliers on public sector qualification, local field crews, integration with existing control systems and proven results in mature fields. Price pressure is strongest in ONGC tenders, while outcome-linked contracts reward suppliers that can show measured output gains.
How is the supply side organized?
The supply side serving Indian producers runs in three distinct tiers. Integrated service companies, led by SLB, Halliburton, Baker Hughes and Weatherford, sell logging, well testing, drilling data and reservoir software inside multiyear ONGC, Oil India and Cairn contracts. Automation vendors such as ABB, Honeywell and Yokogawa supply control, safety and SCADA systems, often through EPC contractors such as L&T. Indian IT and software firms, from Kellton to CIPL, compete with Cognite for telemetry, data and AI work. Entry barriers sit in public sector vendor qualification, while margins sit in software and long-term service.
Service, automation and software suppliers active in India
| Company | Type | Role in the market |
|---|---|---|
| SLB | Integrated service company | Sells reservoir and production software, with a Cairn data-driven reservoir management contract |
| Halliburton | Integrated service company | Built and ran the national E&P data repository and sells drilling services |
| Baker Hughes | Integrated service company | Provides wireline logging and drill stem testing across ONGC basins |
| Weatherford International | Well services provider | Supplies logging equipment used at ONGC Ankleshwar and Mehsana onshore assets |
| ABB | Automation supplier | Supplies cloud-hosted SCADA, control and electrical systems to Indian energy companies |
| Honeywell | Automation and software supplier | Supplied Forge operations software for Cairn inspection rounds and shift logs |
| Yokogawa Electric | Automation supplier | Sells control and safety systems in India through Yokogawa India |
| Kellton Tech Solutions | Indian software firm | Deployed the Optima wellhead monitoring platform across Oil India wells |
| Cognite | Industrial data software firm | Runs a Bengaluru center and partners SLB on Cairn data work |
Value moves from equipment toward recovery services
Credence Research's view is that value in Indian oilfield digitization is moving from equipment packages toward recovery services and production software. Services lead today because ONGC and Oil India buy logging, testing and IT work under long contracts, and the bp deals add a fee model tied to measured output. Central control rooms and wellhead telemetry then widen the base of connected wells. Suppliers that prove gains in mature fields, keep crews near the basins and secure field networks should gain the most share.
Estimates rest on output, capex and digital intensity
The report uses 2025 as the base year and 2026 to 2035 as the forecast period. The 2025 value carries forward the earlier Credence Research estimate for 2024 at its own growth rate, after a check against national oil and gas output, upstream capital and operating spending, and typical digital spending intensity supported that level. Market values come from the Credence Research model, and the regional, solution, application, process and deployment splits are Credence Research estimates informed by public data. Sources include petroleum ministry and national statistics office data, company releases and business publishers. No interviews or surveys were used to build these estimates.
Deepwater drilling and brownfield recovery set the path
Credence Research expects the market to reach USD 2.46 billion by 2035 as recovery contracts spread across offshore fields, Oil India and Cairn connect more onshore wells, and the deepwater campaign adds drilling and logging data work. Growth is steady before 2030, when brownfield work dominates, and could step up after 2030 if deepwater wells lead to new platforms. Reservoir optimization and cloud-based deployment add value fastest, as operators run larger subsurface and analytics workloads. Tender delays, cyber incidents and weaker oil prices are the main risks to that path.
Deepwater results and oil prices set the range
The range to 2035 depends mainly on whether the deepwater campaign finds commercial volumes and on oil prices, which decide how much ONGC and Oil India spend beyond core drilling. Brownfield recovery work supports every case, because the technical services and wellhead monitoring contracts are already signed. A large discovery would add platform and subsea control packages after 2030, while weak prices would push buyers to defer software and integration.
| Scenario | CAGR, 2026–2035 | Value, 2035 | What has to hold |
|---|---|---|---|
| Downside | 7.5% | USD 2.12 billion | Deepwater wells disappoint and lower oil prices push budgets back to core drilling |
| Base | 9.33% | USD 2.46 billion | Recovery contracts spread across offshore fields and Oil India instruments most onshore wells |
| Upside | 10.6% | USD 2.73 billion | A commercial deepwater find adds new platforms and subsea control systems after 2030 |
Frequently Asked Questions
How big is the India digital oilfield solutions market?
How much crude oil does India produce, and why does it matter here?
How do digital tools fit into oilfield services spending in India?
What did ONGC launch for mission-critical production visualization?
How is connectivity reaching Indian oil and gas wells?
Are cloud applications growing in Indian oil and gas?
Which region leads digital oilfield spending in India?
Who are the main suppliers in this market?
Table of Content
Chapter 1 Market Segmentation
- 1.1 Segmentation Framework
- 1.1.1 Product and Service Classification
- 1.1.2 Application and End-Use Classification
- 1.1.3 Technology and Solution Classification
- 1.1.4 Customer and Distribution Channel Classification
- 1.1.5 Geographic Segmentation
- 1.1.6 Market Segment Definitions and Boundaries
- 1.2 By Solution
- 1.2.1 Services
- 1.2.2 Hardware
- 1.2.3 Software
- 1.3 By Application
- 1.3.1 Offshore
- 1.3.2 Onshore
- 1.4 By Process
- 1.4.1 Production Optimization
- 1.4.2 Drilling Optimization
- 1.4.3 Reservoir Optimization
- 1.5 By Deployment
- 1.5.1 On-Premises
- 1.5.2 Cloud-Based
Chapter 2 Introduction
- 2.1 Report Objectives and Scope
- 2.2 Product Definition and Industry Terminology
- 2.3 Market Inclusions and Exclusions
- 2.4 Research Process
- 2.4.1 Primary Research and Expert Interviews
- 2.4.2 Secondary Research and Source Review
- 2.4.3 Top-Down and Bottom-Up Estimation
- 2.4.4 Data Triangulation and Verification
- 2.5 Market Size Measurement Basis
- 2.5.1 2025: USD 1.01 billion → 2035: USD 2.46 billion
- 2.6 Historical and Forecast Reference Periods
- 2.6.1 Historical Period: 2018-2025
- 2.6.2 Base Year: 2025
- 2.6.3 Forecast Period: 2025-2035
- 2.7 Research Assumptions and Limitations
Chapter 3 Executive Summary
- 3.1 Market Snapshot and Key Findings
- 3.2 Base-Year Market Size, 2025
- 3.3 Forecast Market Size, 2035
- 3.4 Revenue and Volume Growth Outlook
- 3.5 Key Demand and Supply Indicators
- 3.6 Leading Market Segments
- 3.7 Fastest-Growing Market Opportunities
- 3.8 Regional Performance Highlights
- 3.9 Technology and Industry Transformation
- 3.10 Competitive Landscape Summary
- 3.11 Analyst View and Strategic Implications
Chapter 4 India Digital Oilfield Solutions Market Trends and Developments
- 4.1 Historical Industry Development, 2018-2025
- 4.2 Recent Market Trends and Developments
- 4.3 Demand and Customer Behavior Trends
- 4.4 Technology and Product Innovation
- 4.5 Artificial Intelligence, Automation and Digitalization
- 4.6 Local Manufacturing and Supply Chain Realignment
- 4.7 Industry Partnerships, Mergers and Acquisitions
- 4.8 Sustainability and Circular Economy Developments
- 4.9 Government and Private Sector Investment Trends
- 4.10 Emerging Business Models and Commercialization
- 4.11 Industry Developments and Announcements
Chapter 5 India Digital Oilfield Solutions Market Production, Supply and Demand Analysis
- 5.1 Demand Trend and Consumption Analysis, 2018-2025
- 5.2 Demand Forecast, 2025-2035
- 5.3 Production and Output Trend, 2018-2025
- 5.4 Production and Output Forecast, 2025-2035
- 5.5 Installed Capacity and Capacity Utilization
- 5.6 Company-Wise Production Plants and Statistics
- 5.6.1 Installed Production Capacity
- 5.6.2 Actual Production
- 5.6.3 Planned Capacity and Expansion Targets
- 5.7 Supply Chain Structure and Procurement Trends
- 5.8 Supply-Demand Gap and Bottlenecks
- 5.9 Import Dependence and Sourcing Structure
- 5.10 Contract Manufacturing and Outsourcing
- 5.11 Regional Supply and Demand Concentration
Chapter 6 India Digital Oilfield Solutions Market Pricing Analysis
- 6.1 Pricing Structure and Measurement
- 6.2 Historical Pricing Trends, 2018-2025
- 6.3 Pricing Outlook, 2025-2035
- 6.4 Average Selling Price and Unit Economics
- 6.5 Pricing by Product and Market Segment
- 6.6 Geographic Pricing Differences
- 6.7 Key Input, Energy, Labor and Logistics Costs
- 6.8 Contract Pricing and Purchasing Models
- 6.9 Pricing Sensitivity and Competitive Positioning
- 6.10 Price, Margin and Profitability Implications
Chapter 7 India Digital Oilfield Solutions Market Dynamics
- 7.1 Market Growth Drivers
- 7.1.1 Demand-Side Drivers
- 7.1.2 Technology and Innovation Drivers
- 7.1.3 Infrastructure and Investment Drivers
- 7.1.4 Regulatory and Policy Drivers
- 7.2 Market Restraints
- 7.2.1 Cost and Affordability Constraints
- 7.2.2 Technology and Adoption Barriers
- 7.2.3 Supply Chain and Operational Constraints
- 7.3 Market Challenges
- 7.3.1 Competitive Pressure and Margin Erosion
- 7.3.2 Skills, Infrastructure and Implementation Gaps
- 7.4 Emerging Market Opportunities
- 7.5 Market Dynamics Impact and Time-Horizon Assessment
Chapter 8 India Digital Oilfield Solutions Value Chain Analysis
- 8.1 Industry Value Chain Overview
- 8.2 Upstream Suppliers and Critical Inputs
- 8.3 Technology and Component Providers
- 8.4 Manufacturing or Service Delivery
- 8.5 Distribution, Channel Partners and Integrators
- 8.6 Downstream Applications and End Users
- 8.7 Value Addition and Profit Pools
- 8.8 Vertical Integration and Outsourcing
- 8.9 Supplier Concentration and Risk
- 8.10 Supply Chain Localization and Resilience
Chapter 9 India Digital Oilfield Solutions Market Regulations and Policies
- 9.1 Relevant Laws, Standards and Compliance Frameworks
- 9.2 Product, Service, Safety and Quality Requirements
- 9.3 Government Policies, Incentives and Subsidies
- 9.4 Imports, Exports and Trade Barriers
- 9.5 Public Procurement and Local Content Requirements
- 9.6 Environmental and Sustainability Compliance
- 9.7 Upcoming Policy Changes and Market Implications
Chapter 10 India Digital Oilfield Solutions Market Hotspots and Opportunities
- 10.1 Market Opportunity Mapping and Growth Hotspots
- 10.2 High-Growth Applications and Customer Groups
- 10.3 Underserved Markets and White-Space Opportunities
- 10.4 Emerging Technology and Product Opportunities
- 10.5 New Capacity and Investment Hotspots
- 10.6 Market Entry and Expansion Opportunities
- 10.7 Distribution and Partnership Opportunities
- 10.8 Near-Term and Long-Term Commercial Potential
- 10.9 Opportunity Attractiveness and Execution Risks
Chapter 11 India Digital Oilfield Solutions Market Outlook, 2025-2035
- 11.1 Market Size and Analysis
- 11.1.1 Revenue (Market Measurement: 2025: USD 1.01 billion → 2035: USD 2.46 billion)
- 11.1.2 Market Volume and Quantity Sold
- 11.1.3 Historical Market Size, 2018-2025
- 11.1.4 Base-Year Market Size, 2025
- 11.2 Market Forecast, 2025-2035
- 11.2.1 Revenue Forecast to 2035
- 11.2.2 Volume Forecast to 2035
- 11.2.3 CAGR and Year-on-Year Growth
- 11.2.4 Incremental Revenue Opportunity
- 11.3 Forecast Assumptions and Scenario Analysis
- 11.3.1 Base-Case Forecast
- 11.3.2 Optimistic and Conservative Scenarios
- 11.3.3 Technology, Pricing and Policy Sensitivities
- 11.4 Market Attractiveness and Growth Outlook
Chapter 12 India Digital Oilfield Solutions Market Segmentation and Outlook
- 12.1 Segmentation Summary and Market Shares, 2025
- 12.2 Largest and Fastest-Growing Segments
- 12.3 By Solution - Market Size and Forecast, 2025-2035
- 12.3.1 Segment Definition and Scope
- 12.3.2 Historical Market Size, 2018-2025
- 12.3.3 Revenue Forecast, 2025-2035
- 12.3.4 Volume Forecast, 2025-2035
- 12.3.5 Base-Year Market Share, 2025
- 12.3.6 Segment CAGR and Growth Drivers
- 12.3.7 Subsegment Market Size and Forecast
- 12.3.7.1 Services
- 12.3.7.2 Hardware
- 12.3.7.3 Software
- 12.3.8 Subsegment Pricing and Adoption Trends
- 12.3.9 Leading Suppliers and Competition
- 12.3.10 Regional Demand and Opportunities
- 12.4 By Application - Market Size and Forecast, 2025-2035
- 12.4.1 Segment Definition and Scope
- 12.4.2 Historical Market Size, 2018-2025
- 12.4.3 Revenue Forecast, 2025-2035
- 12.4.4 Volume Forecast, 2025-2035
- 12.4.5 Base-Year Market Share, 2025
- 12.4.6 Segment CAGR and Growth Drivers
- 12.4.7 Subsegment Market Size and Forecast
- 12.4.7.1 Offshore
- 12.4.7.2 Onshore
- 12.4.8 Subsegment Pricing and Adoption Trends
- 12.4.9 Leading Suppliers and Competition
- 12.4.10 Regional Demand and Opportunities
- 12.5 By Process - Market Size and Forecast, 2025-2035
- 12.5.1 Segment Definition and Scope
- 12.5.2 Historical Market Size, 2018-2025
- 12.5.3 Revenue Forecast, 2025-2035
- 12.5.4 Volume Forecast, 2025-2035
- 12.5.5 Base-Year Market Share, 2025
- 12.5.6 Segment CAGR and Growth Drivers
- 12.5.7 Subsegment Market Size and Forecast
- 12.5.7.1 Production Optimization
- 12.5.7.2 Drilling Optimization
- 12.5.7.3 Reservoir Optimization
- 12.5.8 Subsegment Pricing and Adoption Trends
- 12.5.9 Leading Suppliers and Competition
- 12.5.10 Regional Demand and Opportunities
- 12.6 By Deployment - Market Size and Forecast, 2025-2035
- 12.6.1 Segment Definition and Scope
- 12.6.2 Historical Market Size, 2018-2025
- 12.6.3 Revenue Forecast, 2025-2035
- 12.6.4 Volume Forecast, 2025-2035
- 12.6.5 Base-Year Market Share, 2025
- 12.6.6 Segment CAGR and Growth Drivers
- 12.6.7 Subsegment Market Size and Forecast
- 12.6.7.1 On-Premises
- 12.6.7.2 Cloud-Based
- 12.6.8 Subsegment Pricing and Adoption Trends
- 12.6.9 Leading Suppliers and Competition
- 12.6.10 Regional Demand and Opportunities
- 12.7 Segment Growth Comparison
- 12.8 Segment Attractiveness and Priority Matrix
Chapter 13 India Digital Oilfield Solutions End-Use and Application Market Outlook
- 13.1 End-Use Industry and Customer Demand Structure
- 13.2 Leading Applications and Customer Groups
- 13.3 End-Use Market Size, Share and Forecast
- 13.4 Major End-Use Industry Deep Dives
- 13.4.1 Customer Requirements and Use Cases
- 13.4.2 Demand and Replacement Cycles
- 13.4.3 Technical and Regulatory Considerations
- 13.4.4 Purchasing and Procurement Models
- 13.4.5 Leading Vendors and Distribution Channels
- 13.4.6 Forecast and Commercial Opportunities
- 13.5 Emerging Applications and Cross-Segment Demand
- 13.6 End-Use Industry Investment Priorities
Chapter 14 India Digital Oilfield Solutions Geographic Market Outlook, 2025-2035
- 14.1 Domestic Market Distribution and Demand Clusters
- 14.2 State- or Province-Wise Market Size and Forecast, 2025-2035
- 14.3 City and Metropolitan Market Outlook
- 14.4 Industrial, Manufacturing and Commercial Clusters
- 14.5 Geographic Concentration of Key End Users
- 14.6 Local Pricing and Purchasing Differences
- 14.7 Domestic Production Facilities and Capacity Map
- 14.8 Local Infrastructure and Project Pipeline
- 14.9 State-Level Policy and Incentive Differences
- 14.10 Subnational Investment Hotspots and Opportunities
- 14.11 Distribution and Logistics Networks
- 14.12 Domestic Competitive Footprint
Chapter 15 India Digital Oilfield Solutions Technology, Innovation and Sustainability Outlook
- 15.1 Technology Landscape and Maturity
- 15.2 Product, Process and Service Innovation
- 15.3 AI, Automation and Digital Tools in the Industry
- 15.4 Technology Adoption and Performance Benchmarking
- 15.5 Innovation Pipeline and R&D Investment
- 15.6 Patent and Intellectual Property Trends
- 15.7 Energy Efficiency and Resource Management
- 15.8 Sustainability, Recycling and Circularity
- 15.9 Technology Roadmap, 2025-2035
- 15.10 Risks of Obsolescence and Technology Substitution
Chapter 16 India Digital Oilfield Solutions Market Key Strategic Imperatives
- 16.1 Growth and Market Entry Priorities
- 16.2 High-Return Products and Segments
- 16.3 Pricing, Profitability and Cost Optimization
- 16.4 Technology Investment and Product Differentiation
- 16.5 Supply Chain Localization and Resilience
- 16.6 Distribution and Customer Acquisition
- 16.7 Partnership, Acquisition and Capacity Strategy
- 16.8 Regional Expansion Priorities
- 16.9 Short-, Medium- and Long-Term Actions
Chapter 17 Competition Outlook
- 17.1 Industry Competition Characteristics
- 17.2 Market Structure and Concentration
- 17.3 Market Share and Competitive Positioning, 2025
- 17.4 Company-Wise Revenue and Product Benchmarking
- 17.5 Production and Service Capacity Benchmarking
- 17.6 Technology, Pricing and Differentiation
- 17.7 Regional Footprint and Distribution Strength
- 17.8 Mergers, Acquisitions and Strategic Alliances
- 17.9 New Entrants and Competitive Threats
- 17.10 Porter's Five Forces and Industry Attractiveness
- 17.11 Competitive Outlook, 2025-2035
Chapter 18 Company Profiles
- 18.1 Company Coverage and Selection Criteria
- 18.2 SLB
- 18.2.1 Business Description
- 18.2.2 Company Ownership and Geographic Presence
- 18.2.3 Product and Service Portfolio
- 18.2.4 Manufacturing and Operating Footprint
- 18.2.5 Production Capacity and Expansion Plans
- 18.2.6 Financial Performance and Investment
- 18.2.7 Market Share and Competitive Position
- 18.2.8 Technology and Innovation Capabilities
- 18.2.9 Strategic Alliances or Partnerships
- 18.2.10 Recent Developments
- 18.2.11 Growth Strategy and Outlook
- 18.3 Halliburton
- 18.4 Baker Hughes
- 18.5 Weatherford International
- 18.6 ABB
- 18.7 Honeywell
- 18.8 Yokogawa Electric
- 18.9 Kellton Tech Solutions
- 18.10 Cognite
- 18.11 Other Relevant Market Participants
Note: Every listed company is profiled on the structure shown under the first company. The company list is preliminary and may change based on research findings, market developments, data availability and client requirements.
Chapter 19 Disclaimer
- 19.1 Research and Forecast Disclaimer
- 19.2 Data Source and Estimation Limitations
Note: The depth of individual sections depends on data availability for this market. Volume, capacity, trade and other unit-based metrics are included where applicable.