
Poultry and goat meat anchor Indian protein spending
The India meat market was valued at USD 59.99 billion in 2025 and is projected to increase from USD 65.05 billion in 2026 to USD 131.89 billion by 2035, registering a CAGR of 8.17% during 2026–2035. Demand comes from households that cook chicken and mutton at home, from restaurants, caterers and quick-service chains, and from processors that turn meat into ready-to-cook products. South India held the largest regional share, 32.3% in 2025, because Andhra Pradesh, Telangana, Tamil Nadu, Karnataka and Kerala combine high per capita consumption with large poultry belts. East India is the fastest-growing region at 8.74% a year, as West Bengal and its neighbors add cold storage and branded outlets. Retail is also changing, because online sellers and quick commerce apps now deliver chilled, cleaned cuts within an hour in large cities. As a result, buyers who once relied only on the local butcher can now choose packed, dated and traceable products.
What does the estimate cover, from live-bird shops to chilled packs?
The estimate measures the value of poultry, buffalo, goat and sheep, pork and cattle meat consumed in India, whether sold as loose fresh cuts, tray-packed or vacuum-packed chilled meat, or frozen and processed packs. Values are stated at the prices that households, restaurants, caterers and food manufacturers pay through butcher shops, supermarkets, branded stores and online platforms.
The estimate excludes exports of buffalo meat, fish and seafood, eggs, live animal trade and plant-based meat substitutes. The value chain runs from feed mills, hatcheries and contract farms through slaughterhouses and processing plants to wholesalers, retail counters, delivery apps and commercial kitchens.

India Meat Market Insights
- The India meat market was valued at USD 59.99 billion in 2025 and is projected to reach USD 131.89 billion by 2035, registering a CAGR of 8.17% during 2026–2035.
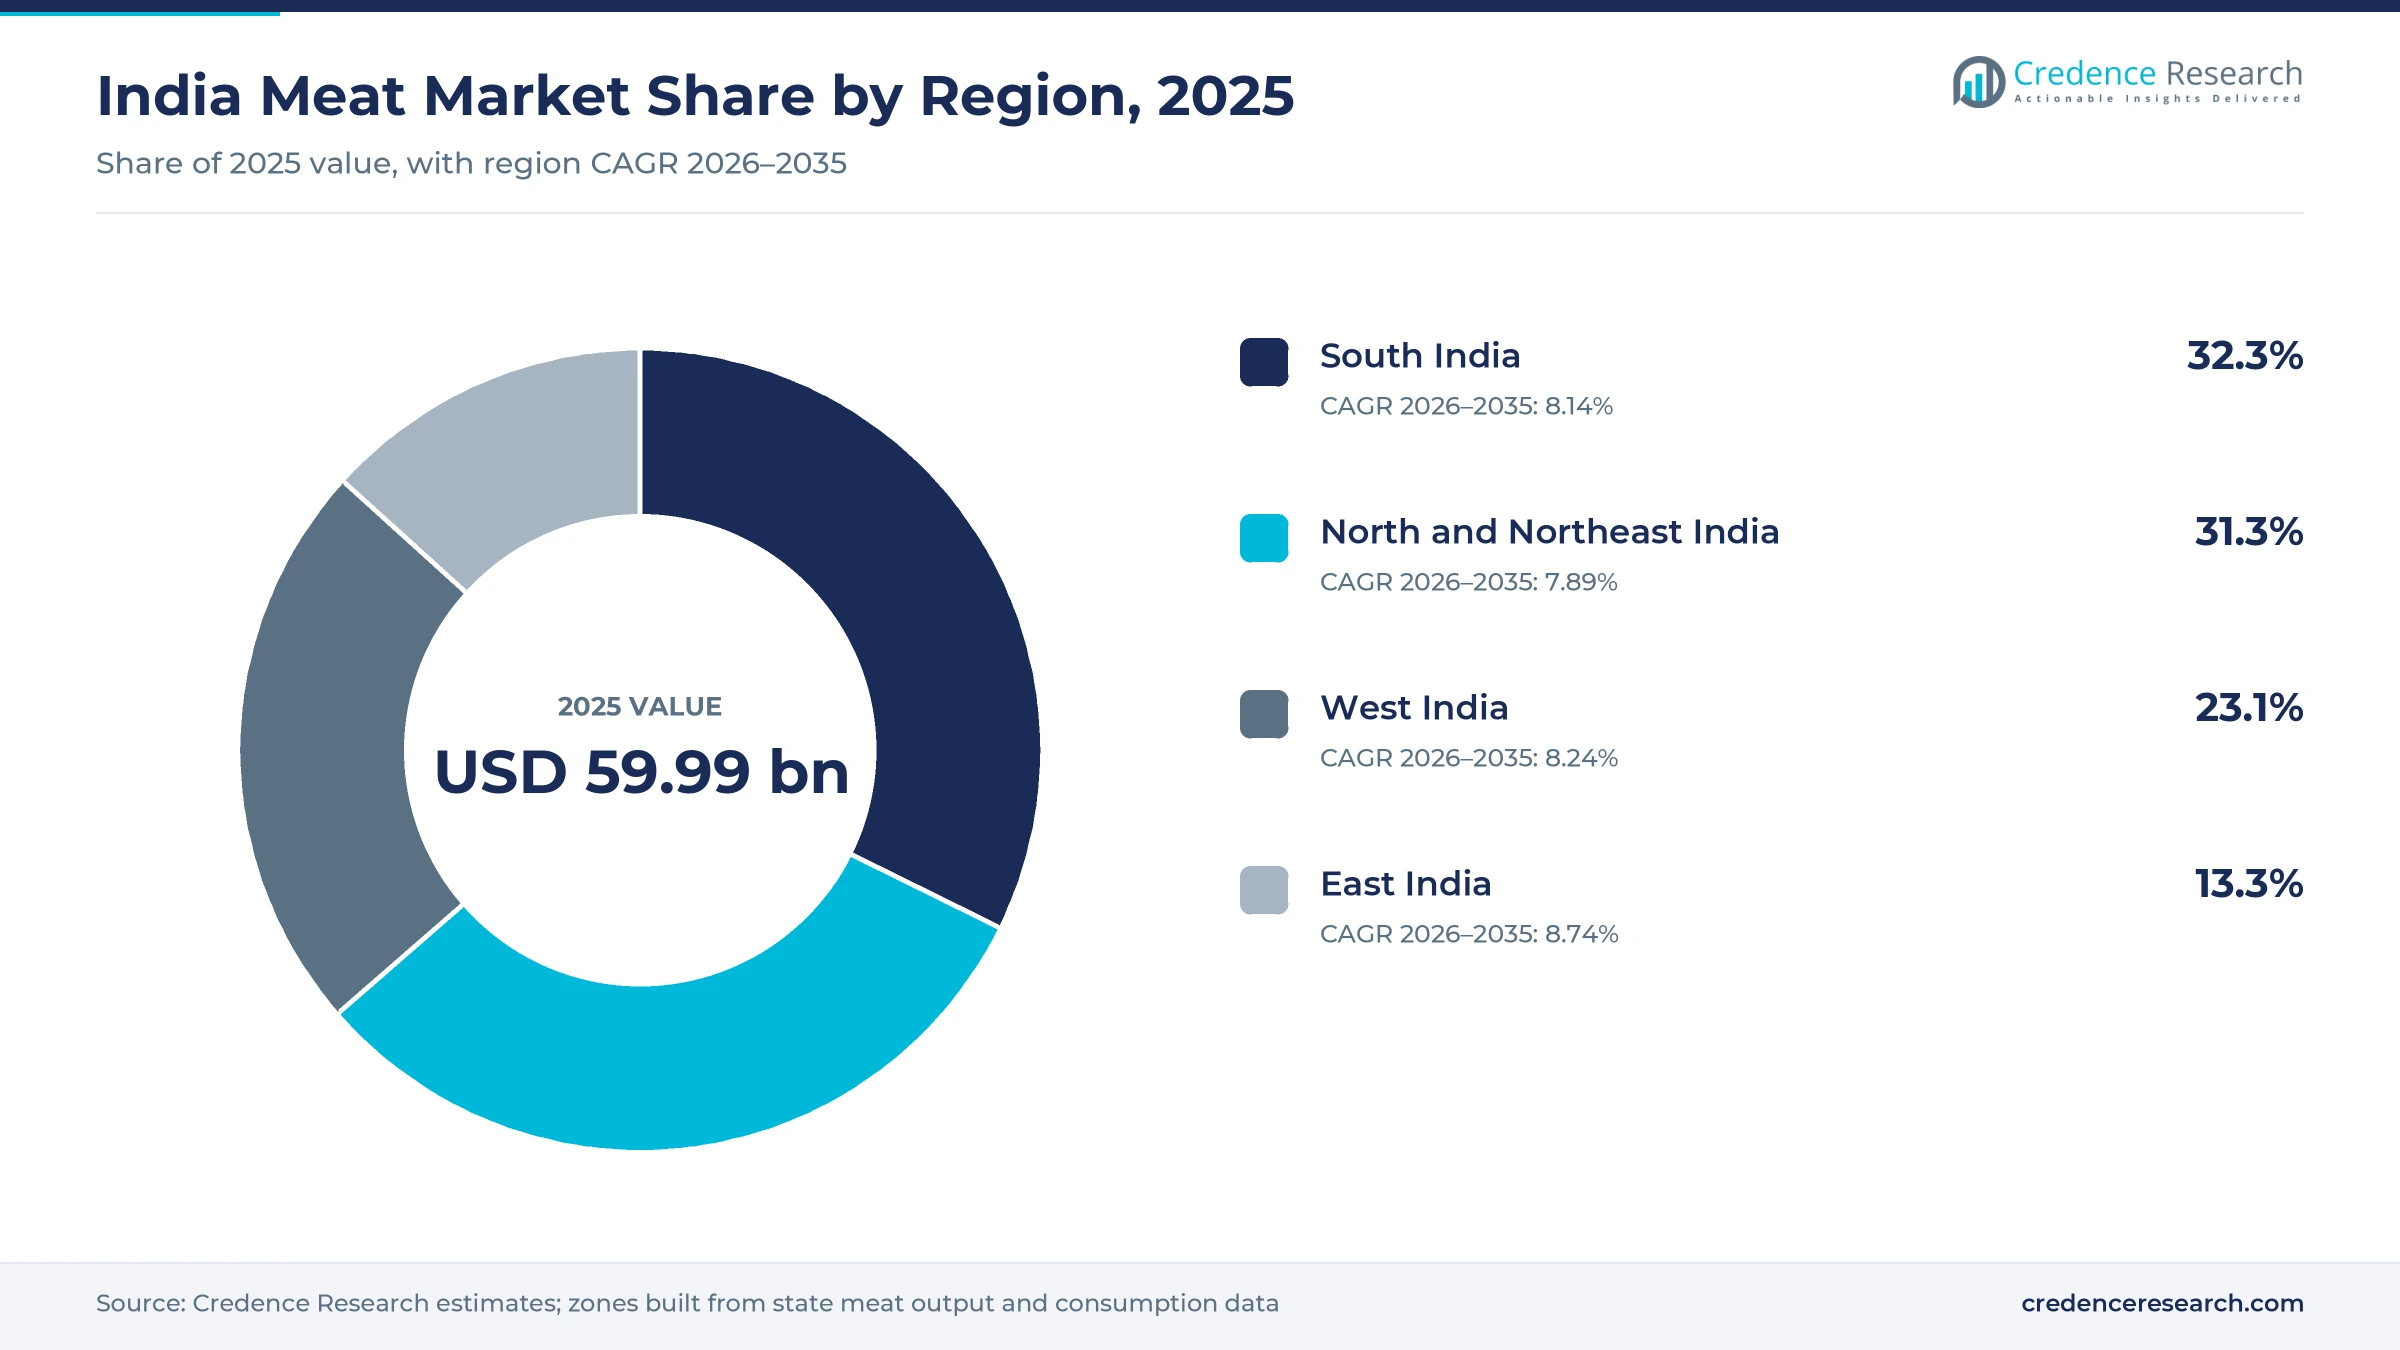
- South India held a 32.3% share of 2025 value, because Andhra Pradesh and Telangana combine large poultry belts with high per capita consumption.
- Poultry meat led with a 47.0% share of 2025 value, because chicken remains the most affordable meat and integrators keep adding supply.
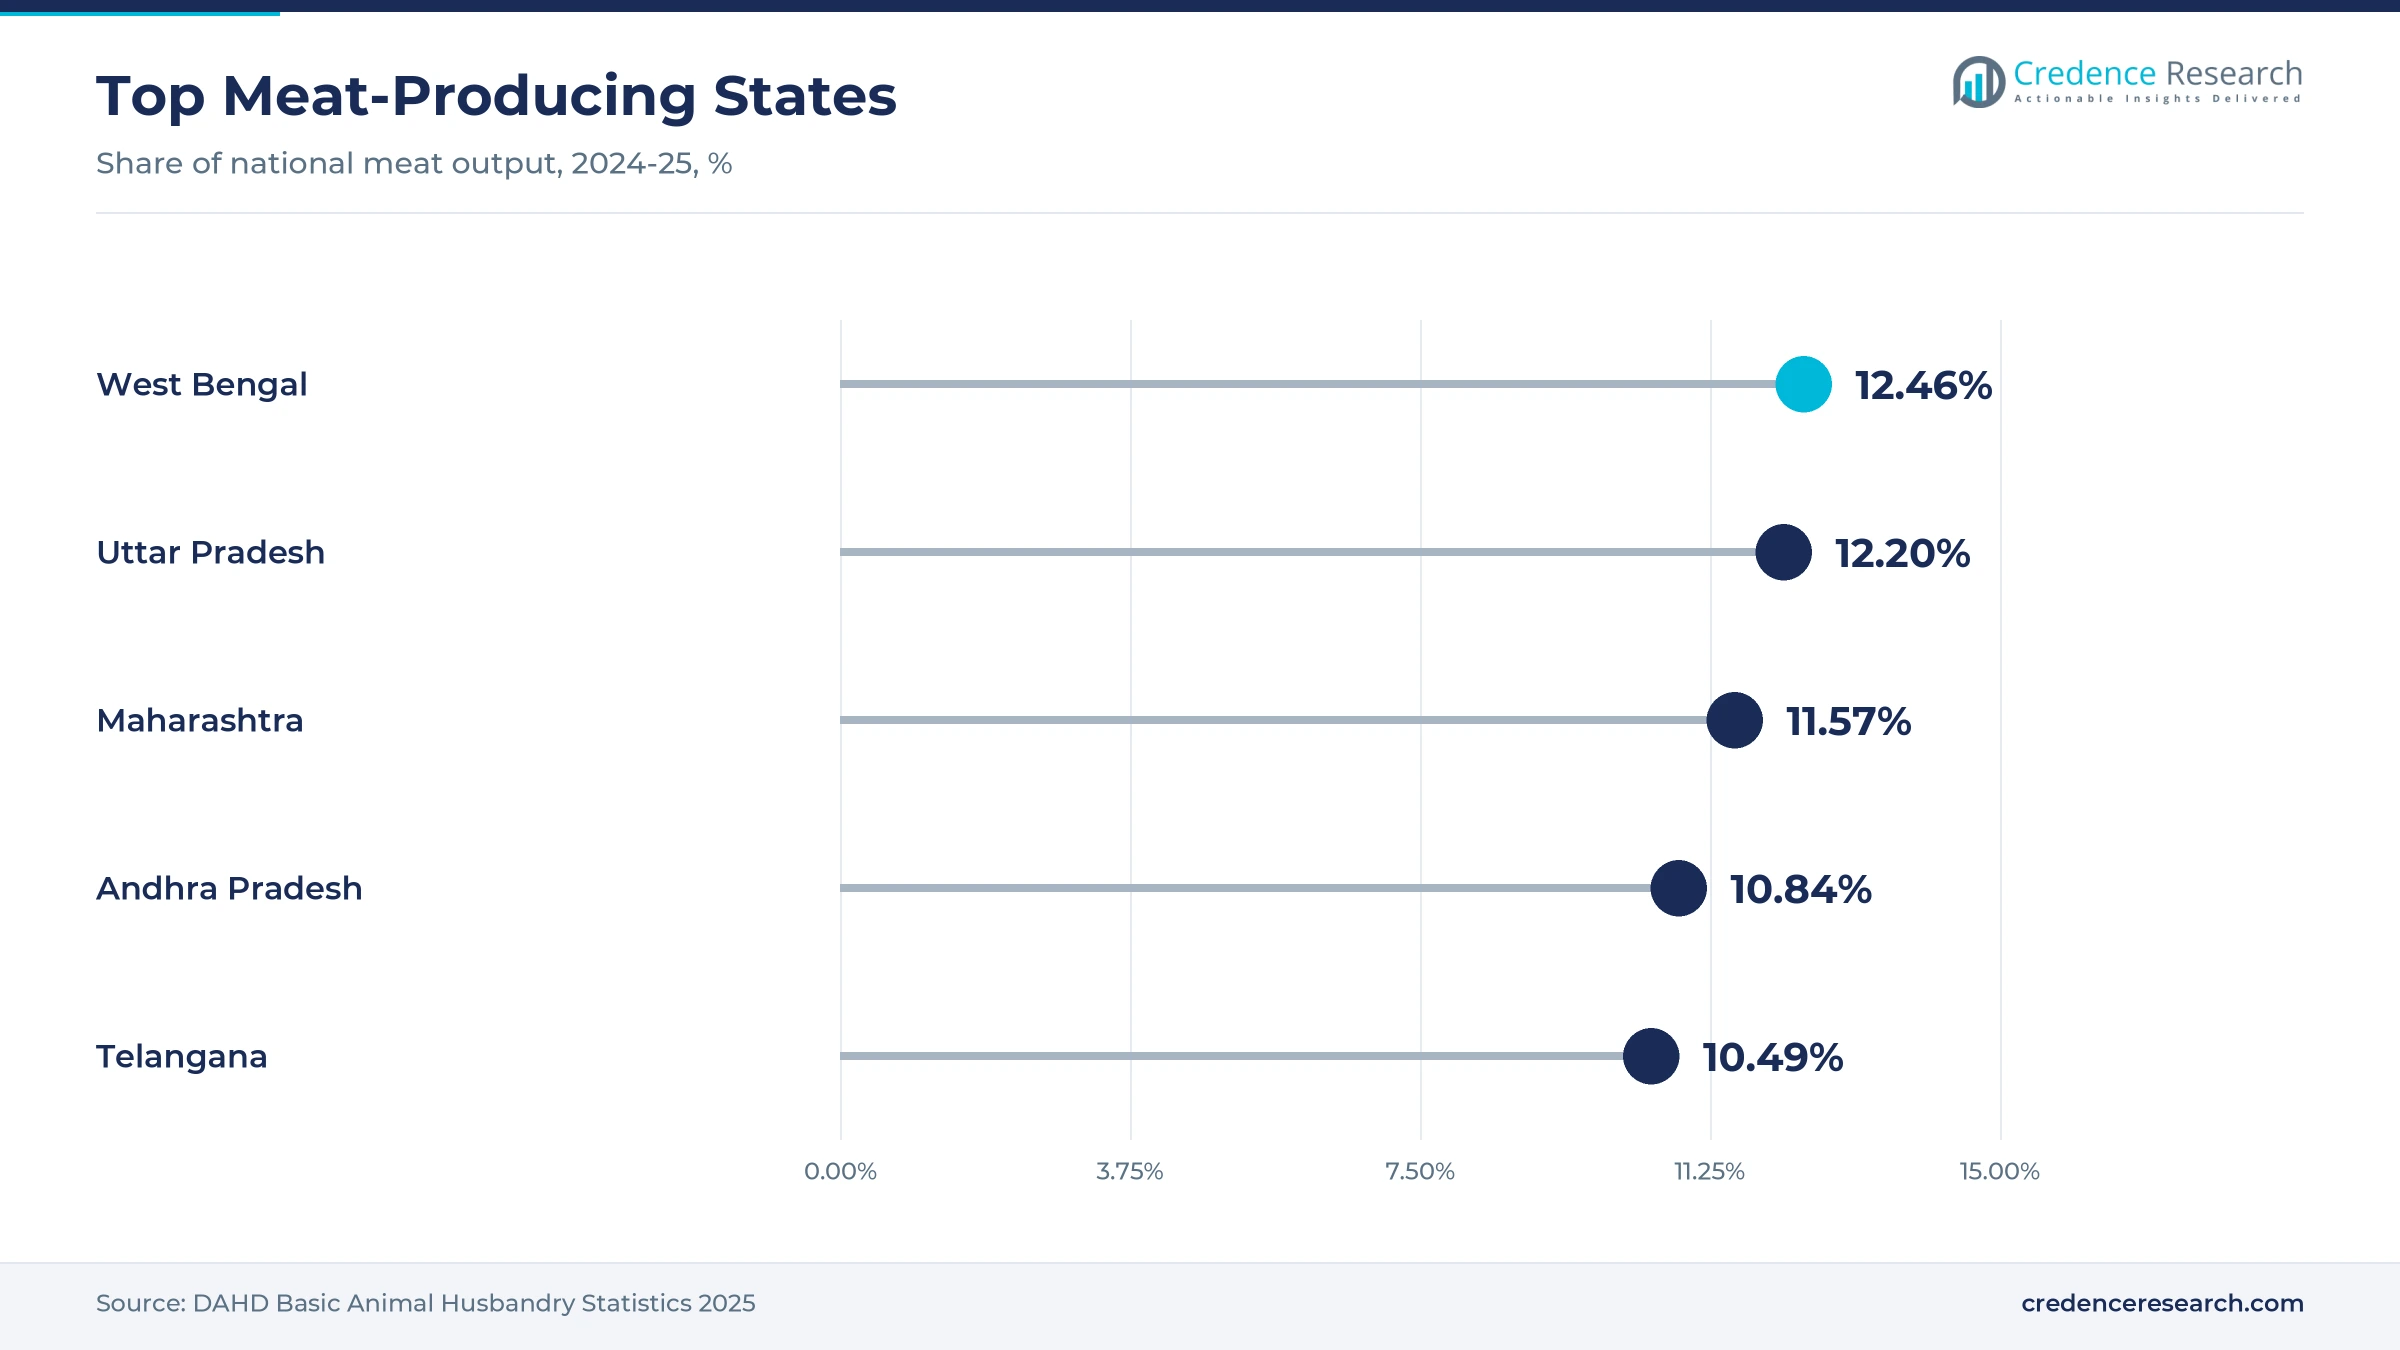
- Meat output reached 10.50 million metric tons in 2024-25, according to Basic Animal Husbandry Statistics 2025, with five states producing 57.55% of the total.
- Godrej Agrovet agreed in August 2024 to buy the 49% stake of Tyson Foods in Godrej Tyson Foods, taking full control of the Real Good Chicken brand.
Poultry leads while online and packed formats grow fastest
Why does poultry hold the largest share of meat spending?
Based on meat type, the market is categorized into poultry meat, buffalo meat, goat and sheep meat, and pork and cattle meat. Poultry Meat led with a 47.0% share of 2025 value, because chicken costs less per kilogram than mutton and faces few religious limits. Poultry Meat also grows fastest at 8.60% a year, as integrators add contract farms faster than goat and sheep flocks can expand.
How do restaurants and caterers shape meat purchases?
Based on customer type, the market is categorized into households, HoReCa and QSR operators, institutional caterers and food manufacturers. Households led with 68.0% of 2025 value, because most meat is still cooked at home for daily and weekend meals. HoReCa and QSR Operators grow fastest at 9.23% a year, as restaurant chains, cloud kitchens and delivery orders draw more chicken and mutton into commercial kitchens.
Which channels carry meat from farm to buyer?
Based on distribution channel, the market is categorized into traditional butcher shops, supermarkets and hypermarkets, branded meat stores and e-commerce and quick commerce. Traditional Butcher Shops led with 77.0% of 2025 value, because most buyers still pick live birds or fresh cuts at a neighborhood counter. E-Commerce and Quick Commerce grows fastest at 12.02% a year, as apps deliver chilled packs within an hour in large cities.
How fast are packed formats replacing loose cuts?
Based on packaging format, the market is categorized into loose fresh cuts, tray-packed chilled meat, vacuum-packed chilled meat and frozen and processed packs. Loose Fresh Cuts led with 76.0% of 2025 value, because buyers prefer meat cut in front of them on the day of cooking. Vacuum-Packed Chilled Meat grows fastest at 10.70% a year, as branded sellers use sealed packs to extend shelf life and prove freshness.
| Segment Group | Leading Sub-segment | Share, 2025 | Fastest-growing Sub-segment | CAGR, 2026–2035 |
|---|---|---|---|---|
| By Meat Type | Poultry Meat | 47.0% | Poultry Meat | 8.60% |
| By Customer Type | Households | 68.0% | HoReCa and QSR Operators | 9.23% |
| By Distribution Channel | Traditional Butcher Shops | 77.0% | E-Commerce and Quick Commerce | 12.02% |
| By Packaging Format | Loose Fresh Cuts | 76.0% | Vacuum-Packed Chilled Meat | 10.70% |
Request a Free Sample
Fill in your details and we'll send you a free sample report.
- Sample data tables & charts
- Research methodology
Supply growth, public funds and new retail lift demand
How does expanding domestic supply widen protein access?
Indian meat output keeps rising, which widens the supply of affordable animal protein for households and kitchens. Meat production reached 10.50 million metric tons in 2024-25, up 2.46% from the previous year, according to Basic Animal Husbandry Statistics 2025 data reported by Dairy News Today. West Bengal, Uttar Pradesh, Maharashtra, Andhra Pradesh and Telangana together produced 57.55% of that output. Poultry output rose from 4.47 million metric tons in 2020-21 to 5.18 million metric tons in 2024-25, according to Dataful, as integrators placed more chicks on contract farms fed with commercial broiler feed. As a result, poultry meat remains the largest meat type, because it is still the cheapest meat per kilogram for most families.
Why does public capital for processing and cold chain matter?
Public funding lowers the cost of building abattoirs, chilling rooms and freezers, which moves more meat into hygienic formal channels. The Union Cabinet extended the Animal Husbandry Infrastructure Development Fund on Feb. 1, 2024, with an outlay of INR 29,610.25 crore through 2025-26 and a 3% interest subvention on eligible loans. Under the cold chain scheme of PMKSY, 291 of 395 approved projects were operational by June 2025, adding 25.52 lakh metric tons a year of preservation capacity, according to the Press Information Bureau. In turn, more processors can hold product in cold storage and ship chilled packs to distant cities.
How are formal processing and omnichannel retail expanding?
Branded processors and online sellers are pulling buyers from loose cuts toward packed, traceable meat sold through stores and apps. Licious operated in 20 cities in February 2025 and had begun quick delivery in Gurugram, with plans to extend it to most markets, according to Bloomberg reporting carried by Vertex Ventures. By October 2025 it had passed 50 stores, aimed for 80 by December and offered 30-minute delivery to 60% of its users, according to D2C Insider. Godrej Agrovet agreed in August 2024 to take full ownership of Godrej Tyson Foods, which sells Real Good Chicken in more than 35 cities. As a result, online channels grow fastest at 12.02% a year, as quick commerce apps widen chilled delivery in large cities.
How do higher incomes change what families buy?
Higher household spending lets more families buy meat more often and trade up to cleaned, portioned and chilled cuts. Average monthly per capita consumption expenditure reached INR 4,122 in rural India and INR 6,996 in urban India in 2023-24, according to the Ministry of Statistics and Programme Implementation. Telangana already has per capita meat availability of 28.8 kg a year, nearly four times the national average, according to Dataful, which shows how far southern demand runs ahead. Restaurants add volume too, because Godrej Tyson Foods supplies processed chicken to hotel chains and quick-service restaurant operators. In turn, HoReCa and QSR operators grow fastest at 9.23% a year, while households keep the largest share.
Integrated poultry and packed chilled cuts reshape supply
How is the shift to integrated poultry changing supply?
Integrated poultry companies now control more of the chain from hatcheries and feed mills to processing and retail, which steadies supply and quality. Suguna Foods works with more than 40,000 farmers in over 15,000 villages across 18 states, according to the company. Sneha Farms, which runs a processing plant that handles 12,000 birds an hour, five hatcheries and six feed mills, received an investment from Mitsui & Co. in March 2024, according to SeafoodNews. Venky's approved about INR 70 crore in May 2025 to expand specific-pathogen-free egg capacity in Maharashtra, according to its stock exchange filing. As a result, poultry meat grows fastest at 8.60% a year, because integrators can add birds faster than red meat herds can expand.
Why is the rise of packed chilled cuts notable in large cities?
Packed chilled meat is rising as buyers in large cities look for cleaned, portioned and dated packs instead of cuts weighed at the counter. Quick commerce platforms are adding their own lines, and Zepto sells meat under its Relish brand, while FreshToHome counts Amazon as a backer, according to Bloomberg reporting carried by Vertex Ventures. Licious bought the Bengaluru chain My Chicken and More, which had 22 outlets, in 2024 and plans to enter smaller cities in 2026 after building stores in Mumbai and the National Capital Region. Venky's also planned 1,700 kg a day of ready-to-cook masala output in Maharashtra from mid-2025 to sell alongside chicken. Even so, loose fresh cuts held 76.0% of 2025 value, so packed formats still have a long runway.
Where can export-grade plants find buyers at home?
Export-grade buffalo meat plants offer an opening to supply hygienic chilled and frozen product to food manufacturers and caterers at home. India had 72 APEDA-registered integrated abattoir cum meat processing plants on a list dated June 11, 2024, with Uttar Pradesh hosting the largest group. Buffalo meat exports rose 25.6% to USD 5.1 billion in 2025-26, according to Siasat Daily, citing Commerce Ministry data. India's beef production, mostly carabeef, was forecast to rise to 4.64 million metric tons in 2025 from 4.57 million in 2024, according to the U.S. Department of Agriculture. In turn, certified plants can redirect part of their capacity to food manufacturers that need consistent frozen cuts.
What opening do disease scares create for branded sellers?
Traceable, branded and tested meat offers a premium opening, because many buyers lose trust during disease outbreaks. During the H5N1 outbreak in Andhra Pradesh in early 2025, chicken prices fell from INR 280 a kilogram on Feb. 2 to INR 170, and sales dropped sharply, according to SeafoodSource. About 540,000 birds died out of 107 million raised in the state, the state animal husbandry minister said on Feb. 13, 2025, while Telangana set up 24 border checkpoints. Branded sellers with farm-to-pack records can reassure buyers faster in such episodes. As a result, vacuum-packed chilled meat grows fastest among formats at 10.70% a year, as sellers use sealed, dated packs to prove freshness.
Disease scares and informal trade weigh on growth
How do bird flu outbreaks disrupt chicken demand?
Avian influenza outbreaks force culling, transport bans and shop closures in affected districts, and they scare buyers far beyond the outbreak zone. Poultry farmers and integrators lose income twice, because birds die and prices fall at the same time. As a result, demand shifts for several weeks toward fish and mutton. Integrators respond with farm biosecurity, wider use of poultry vaccines and faster public communication.
Why does the informal butcher trade slow quality upgrades?
Most meat is still sold through small shops that slaughter on site, often without chilling or regular inspection. These shops compete on price and convenience, which keeps pressure on branded sellers that pay for cold storage and testing. In turn, hygiene standards vary widely between cities and even neighborhoods. Stricter licensing of large slaughterhouses and municipal inspections slowly push more volume toward registered facilities.
How do feed costs squeeze poultry margins?
Feed is the largest cost in broiler farming, and maize and soybean meal prices move with monsoon harvests and global trade. When grain prices rise, integrators cannot always pass the increase to shoppers, because chicken prices are set daily in local markets. As a result, integrator margins can swing sharply from one quarter to the next. Larger players hedge through owned feed mills, longer supply contracts and better feed conversion breeds.
Why do cold chain gaps limit packed meat outside large cities?
Chilled and frozen meat needs unbroken refrigeration from plant to shelf, but reefer trucks and retail freezers remain scarce in smaller towns. Retailers there stock little packed meat, because power cuts and long transit times raise spoilage risk. In turn, buyers keep relying on live-bird shops and same-day cuts. Public cold chain grants and private delivery hubs are gradually extending reach into tier two and tier three cities.
South India leads while East India grows fastest
| Region | Value, 2025 (USD billion) | Share, 2025 | CAGR, 2026–2035 |
|---|---|---|---|
| South India | 19.38 | 32.3% | 8.14% |
| North and Northeast India | 18.78 | 31.3% | 7.89% |
| West India | 13.86 | 23.1% | 8.24% |
| East India | 7.98 | 13.3% | 8.74% |
What makes the southern states the biggest meat buyers?
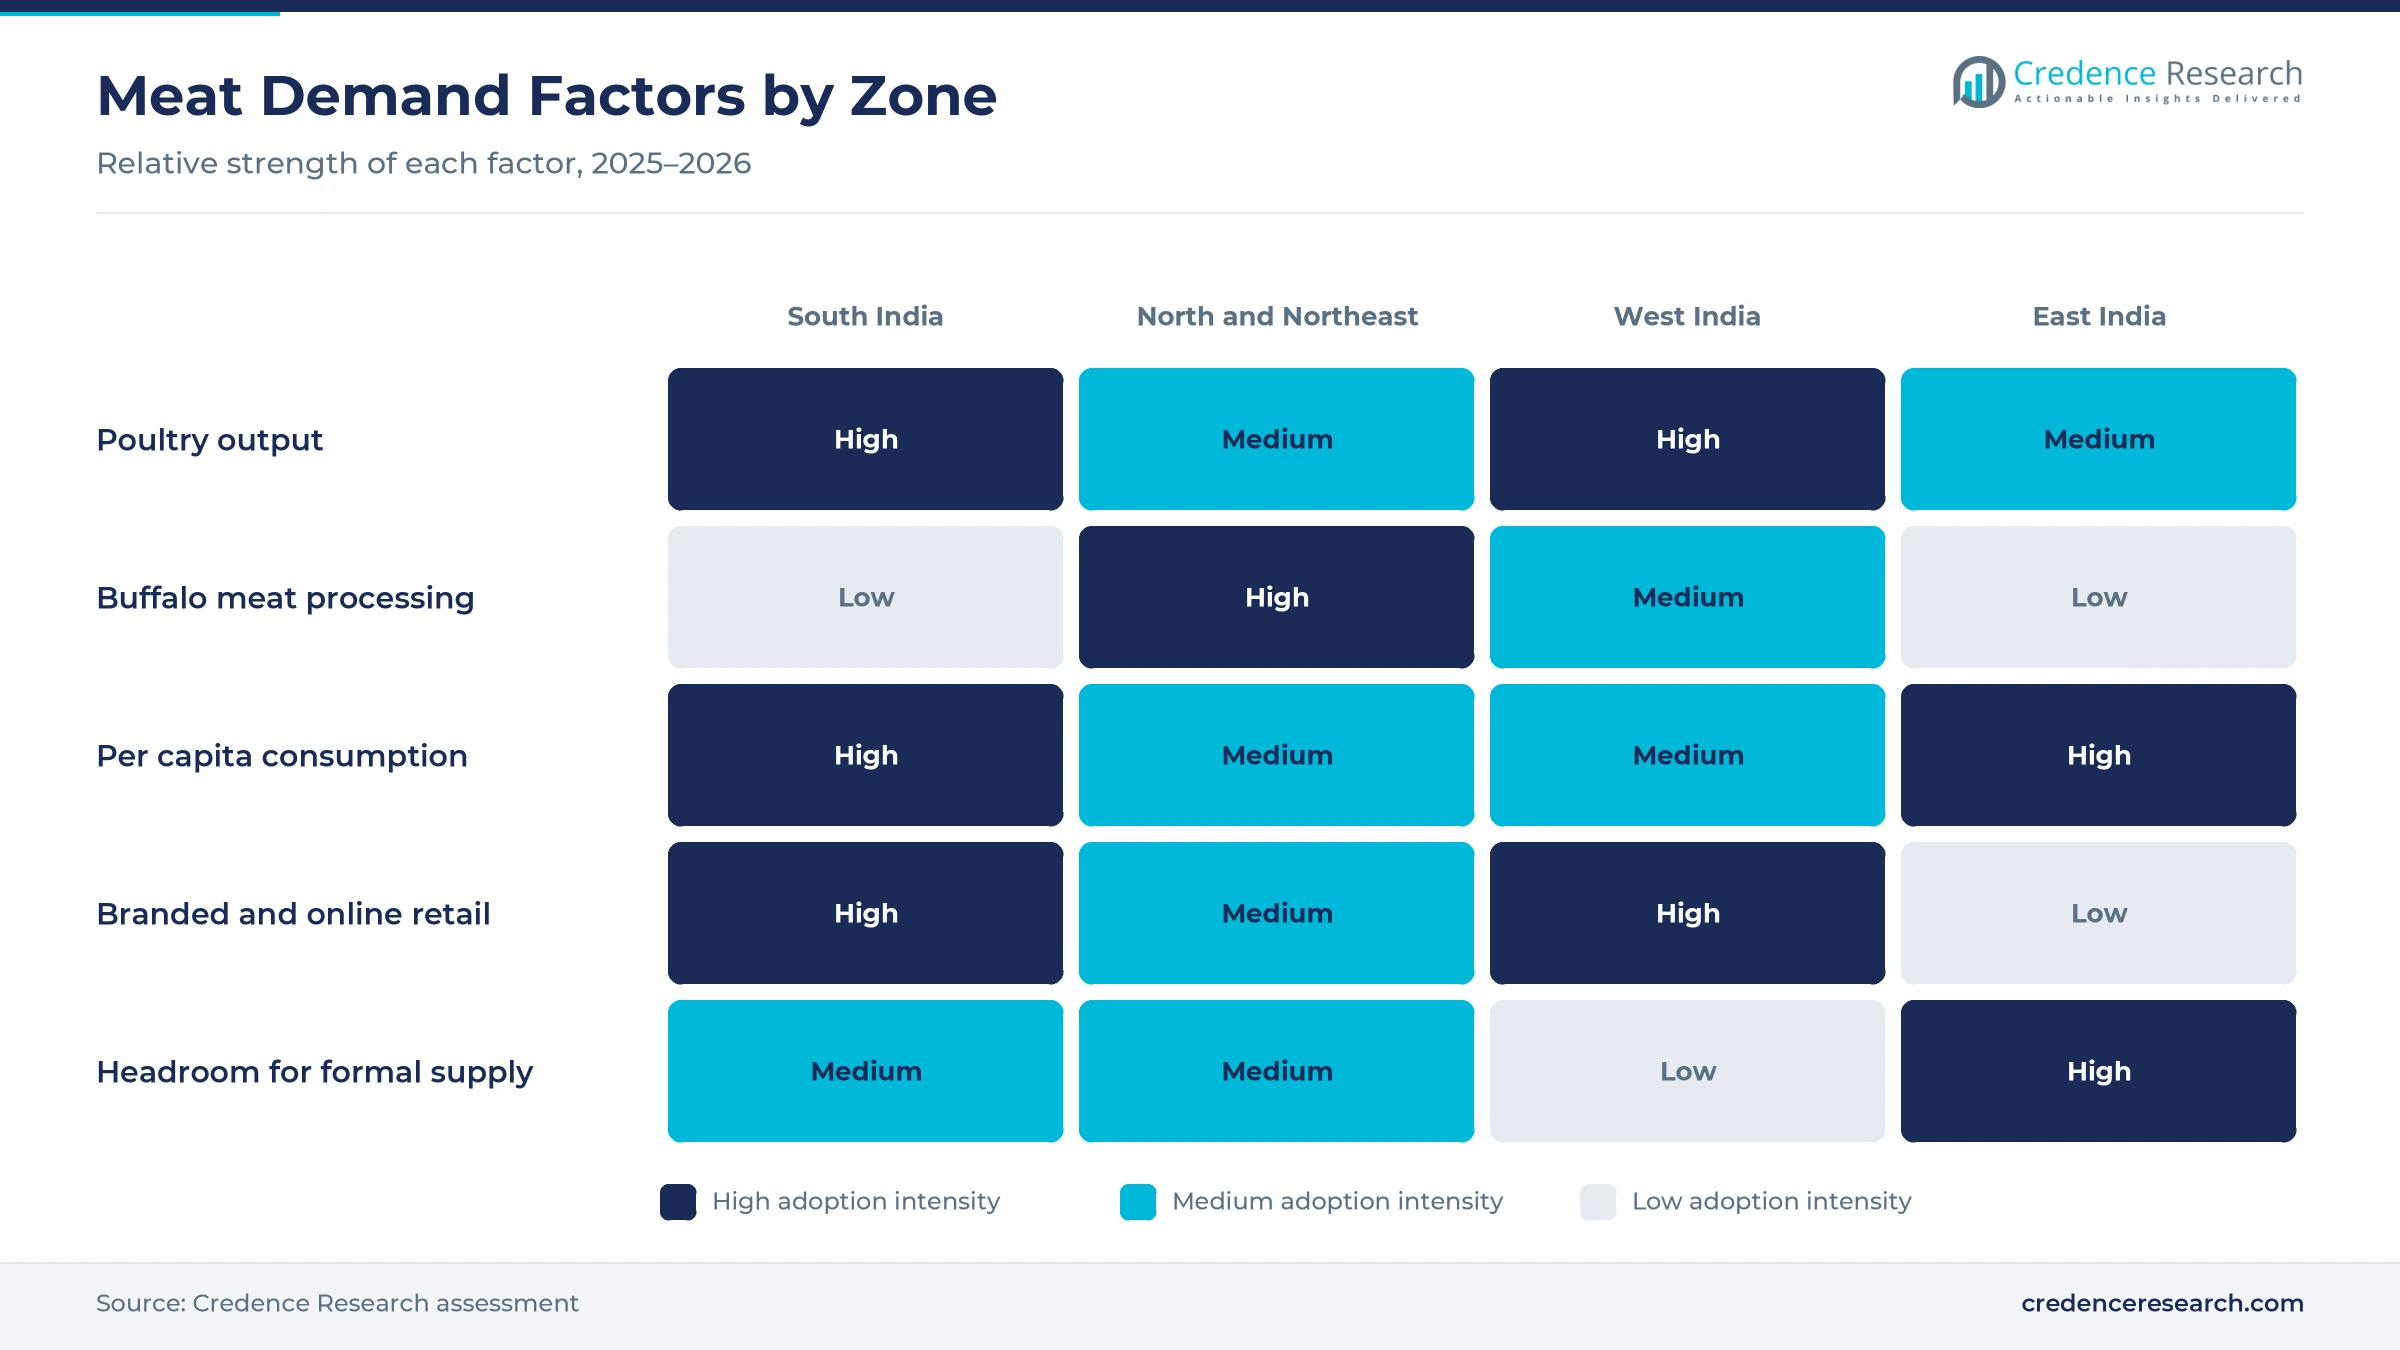
South India held 32.3% of 2025 value and grows at 8.14% a year, because Andhra Pradesh, Telangana, Tamil Nadu, Karnataka and Kerala eat meat often and host large broiler belts. Andhra Pradesh produced 10.84% and Telangana 10.49% of national meat output in 2024-25, according to Basic Animal Husbandry Statistics 2025. Sneha Farms runs its integrated poultry business from Hyderabad, while Licious bought the Bengaluru chain My Chicken and More in 2024. As a result, the zone combines dense supply with the highest per capita demand.
What keeps the north and northeast close behind?
North and Northeast India held 31.3% of 2025 value and grows at 7.89% a year, because Uttar Pradesh is both a large meat producer and the main center of buffalo processing. Uttar Pradesh produced 12.20% of national meat output in 2024-25 and about 39% of buffalo meat, according to Dataful. The largest group of APEDA-registered integrated abattoirs sits in the state, including a plant of Al Kabeer Exports, while HMA Agro Industries is based in Agra. In turn, the zone supplies buffalo meat to processors across the country.
How does Mumbai shape western meat buying?
West India held 23.1% of 2025 value and grows at 8.24% a year, because Maharashtra combines large urban demand with poultry breeding and processing. Maharashtra produced 11.57% of national meat output in 2024-25, according to Basic Animal Husbandry Statistics 2025. Venky's is expanding breeder egg and ready-to-cook spice capacity at its Maharashtra facilities, and Licious named Mumbai a priority market for its stores. As a result, Mumbai anchors branded meat sales in the zone, while Gujarat consumes comparatively little meat.
Where does Bengal-led eastern demand find its headroom?
East India held 13.3% of 2025 value and grows fastest at 8.74% a year, because West Bengal, Odisha, Bihar and Jharkhand eat meat widely but still buy mostly through small shops. West Bengal was the largest meat-producing state in 2024-25 with 12.46% of national output, and it produces about 31% of goat meat, according to Dataful. Because packed and branded meat still reaches few buyers there, formal supply has the most room to expand in this zone over the forecast period.
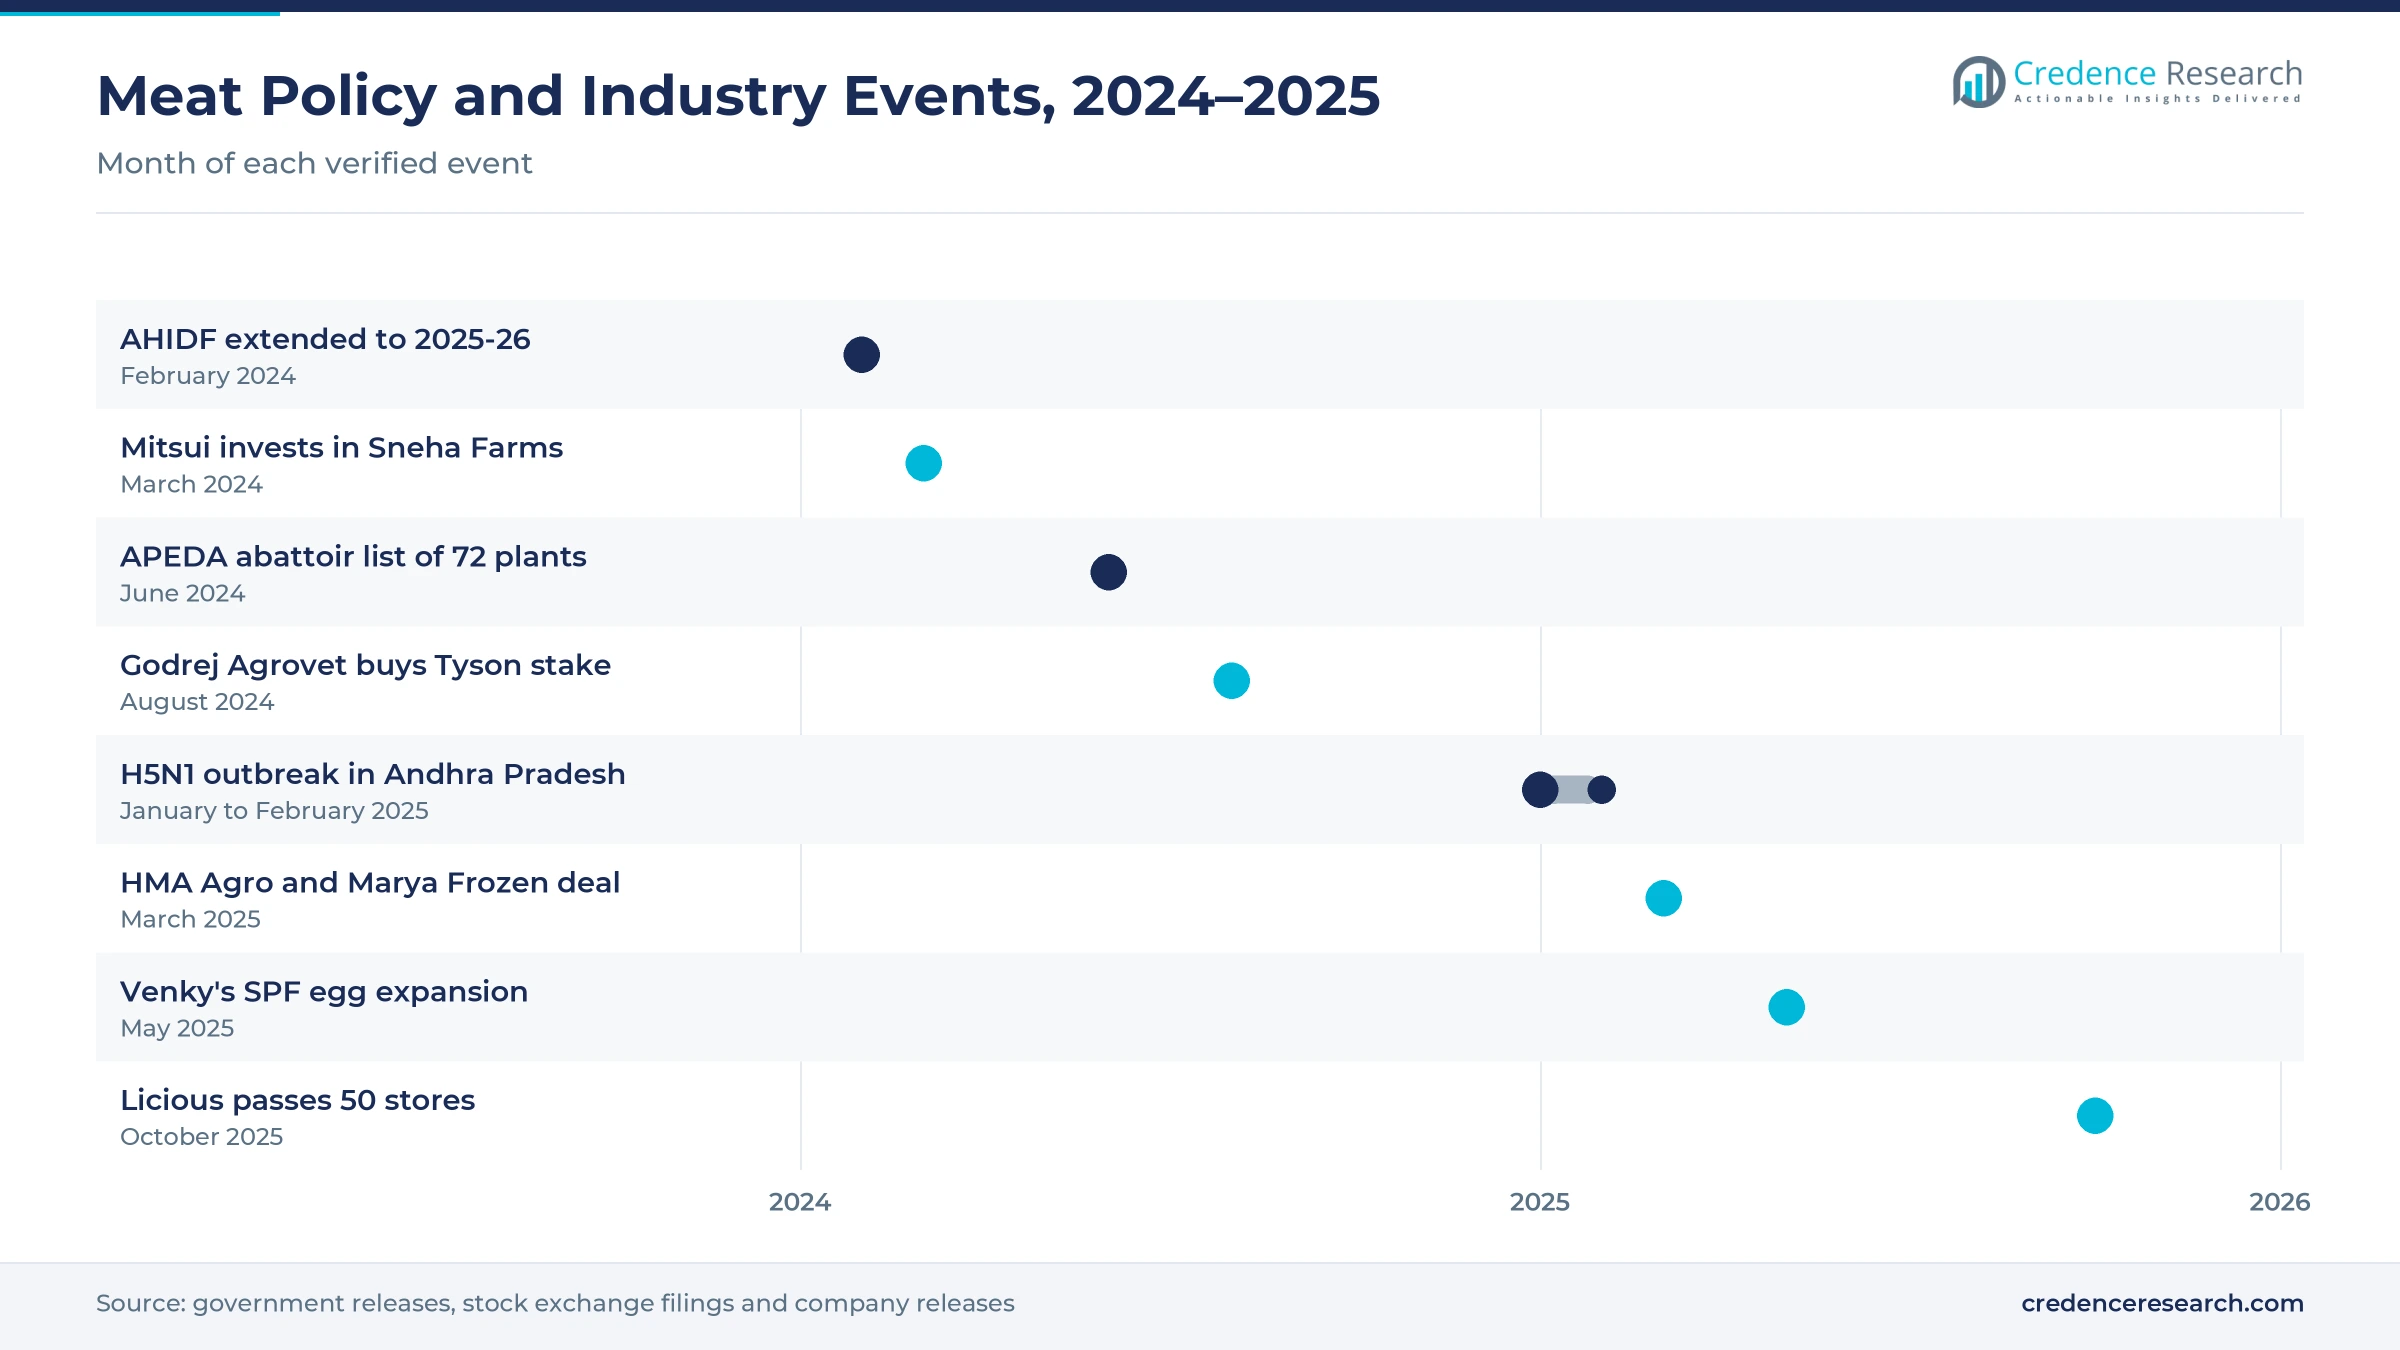
Stake deals, plant tie-ups and store growth marked 2024–2025
| Development | Status and market relevance |
|---|---|
| In February 2024, the Union Cabinet extended the Animal Husbandry Infrastructure Development Fund with INR 29,610.25 crore through 2025-26. | Supports new meat processing, feed and breeding plants with interest subvention |
| In March 2024, Mitsui & Co. invested in Sneha Farms, an integrated poultry producer based in Hyderabad. | Adds capital for feed, hatchery, processing and retail operations in South India |
| In August 2024, Godrej Agrovet agreed to buy the 49% stake of Tyson Foods in Godrej Tyson Foods. | Gives Godrej Agrovet full control of Real Good Chicken and Yummiez |
| In March 2025, HMA Agro Industries signed a two-year facilities agreement with Marya Frozen Agro Food Products. | Adds access to a buffalo meat plant with 298 metric tons a day of capacity |
| In October 2025, Licious passed 50 stores and set a target of 80 branded outlets by December 2025. | Expands branded offline meat retail alongside quick delivery |
Chilling, packaging and farm tracking shape quality
- Blast chilling and freezing brings carcasses and cuts below safe temperatures within hours, which extends shelf life for chilled and frozen packs.
- Vacuum and tray packaging seals cuts in film or modified atmosphere, which keeps color and freshness for several days on retail shelves.
- Digital contract-farm tracking records flock placement, feed and health data on mobile apps, which IB Group says it uses with more than 25,000 farmers.
- Integrated abattoir lines combine slaughter, deboning, chilling and rendering in one plant, which helps APEDA-registered units meet export and domestic hygiene rules.
Need a Custom Version of This Report?
Tailor the scope, geography, or segments to your exact requirements.
- Custom geography or segment scope
- Direct access to our analyst team
Integrators, exporters and online brands compete
Competition centers on integrated supply, plant certification, brand trust and delivery speed, and it varies by meat type. Suguna Foods, Venky's, IB Group, Sneha Farms and Srinivasa Farms run contract-farm poultry networks with their own feed mills and hatcheries. Godrej Tyson Foods, now fully owned by Godrej Agrovet, sells Real Good Chicken and Yummiez to shoppers, hotels and quick-service chains. Allanasons, HMA Agro Industries and Al Kabeer Exports operate APEDA-registered buffalo meat plants and focus mainly on exports, with some domestic supply. Licious competes online and in stores against quick commerce lines such as Relish from Zepto. Because poultry is the largest meat type, companies with scale in broiler supply and cold chain hold an advantage.
Companies profiled and their roles in this market
| Company | Type | Role in the market |
|---|---|---|
| Suguna Foods Pvt Ltd | Integrated poultry producer | Works with 40,000+ farmers in 18 states; Delfrez stores |
| Venky's (India) Ltd | Integrated poultry and breeding company | Expanding SPF egg capacity in Maharashtra from May 2025 |
| Godrej Tyson Foods Ltd | Branded poultry processor | Real Good Chicken in 35+ cities; fully owned by Godrej Agrovet |
| IB Group | Integrated poultry producer | Digital contract-farm systems for 25,000+ farmers |
| Sneha Group | Integrated poultry producer | Hyderabad based; 12,000 birds an hour plant; Mitsui investment |
| Srinivasa Farms Pvt Ltd | Integrated poultry company | Founded in 1965; breeding, feed and consumer products |
| Allanasons Pvt Ltd | Buffalo meat processor and exporter | Among the top buffalo meat exporters; APEDA-registered plants |
| HMA Agro Industries Ltd | Buffalo meat processor and exporter | Agra based; Marya Frozen facilities deal in March 2025 |
| Al Kabeer Exports Pvt Ltd | Buffalo meat processor | APEDA-registered integrated abattoir in Uttar Pradesh |
| Delightful Gourmet Pvt Ltd (Licious) | Online and store meat brand | 50+ stores by October 2025; 30-minute delivery |
Credence Research view on Indian meat demand
Credence Research's view is that Indian meat demand will grow faster than food spending overall, because poultry supply, rising incomes and new retail formats keep adding buyers and meals. Poultry keeps the largest share and grows fastest, while goat and sheep meat stays the premium staple for festivals and weekend meals. Packed chilled and online sales will grow quickly from a small base, but neighborhood butcher shops will still carry most volume through 2035. East India should grow fastest as cold storage and branded outlets reach its towns. Suppliers that pair integrated farms with trusted brands should gain the most share.
Livestock output, prices and filings anchor the model
The report uses 2025 as the base year on a calendar basis, and market values come from the Credence Research model. That model combines state meat output from Basic Animal Husbandry Statistics, household spending surveys, retail meat prices, trade attaché data, scheme releases and company filings. Segment splits, zone growth rates and channel shares are Credence Research estimates built from these inputs. Sources used are official statistics, government releases, U.S. Department of Agriculture reports, stock exchange filings, company releases and news reports, and no interviews or surveys were used.
Formal supply and packed retail carry growth to 2035
Sales in the India meat market are expected to reach USD 131.89 billion by 2035, an 8.17% CAGR during 2026–2035, as poultry supply, household spending and formal retail keep demand rising. Growth should stay firm through 2030 as public funds add processing and cold storage capacity and integrators expand contract farms. After that, packed chilled meat, online delivery and restaurant demand will set the pace. A serious disease outbreak or a feed price spike could slow poultry for a season, while faster cold chain growth would lift packed formats. Vacuum-packed chilled meat is expected to gain the most format share through 2035.
Frequently Asked Questions
How big is the India meat market?
Which meat type leads demand in India?
Which region leads the Indian meat market?
How much meat does India produce?
How does public funding support meat processing?
Which distribution channel grows fastest?
Who are the leading companies in India?
What are the main challenges for meat suppliers?
Table of Content
Chapter 1 Market Segmentation
- 1.1 Segmentation Framework
- 1.1.1 Product and Service Classification
- 1.1.2 Application and End-Use Classification
- 1.1.3 Technology and Solution Classification
- 1.1.4 Customer and Distribution Channel Classification
- 1.1.5 Geographic Segmentation
- 1.1.6 Market Segment Definitions and Boundaries
- 1.2 By Meat Type
- 1.2.1 Poultry Meat
- 1.2.2 Buffalo Meat
- 1.2.3 Goat and Sheep Meat
- 1.2.4 Pork and Cattle Meat
- 1.3 By Customer Type
- 1.3.1 Households
- 1.3.2 HoReCa and QSR Operators
- 1.3.3 Institutional Caterers
- 1.3.4 Food Manufacturers
- 1.4 By Packaging Format
- 1.4.1 Loose Fresh Cuts
- 1.4.2 Tray-Packed Chilled Meat
- 1.4.3 Vacuum-Packed Chilled Meat
- 1.4.4 Frozen and Processed Packs
Chapter 2 Introduction
- 2.1 Report Objectives and Scope
- 2.2 Product Definition and Industry Terminology
- 2.3 Market Inclusions and Exclusions
- 2.4 Research Process
- 2.4.1 Primary Research and Expert Interviews
- 2.4.2 Secondary Research and Source Review
- 2.4.3 Top-Down and Bottom-Up Estimation
- 2.4.4 Data Triangulation and Verification
- 2.5 Market Size Measurement Basis
- 2.5.1 2025: USD 59.99 billion → 2035: USD 131.89 billion
- 2.6 Historical and Forecast Reference Periods
- 2.6.1 Historical Period: 2018-2025
- 2.6.2 Base Year: 2025
- 2.6.3 Forecast Period: 2025-2035
- 2.7 Research Assumptions and Limitations
Chapter 3 Executive Summary
- 3.1 Market Snapshot and Key Findings
- 3.2 Base-Year Market Size, 2025
- 3.3 Forecast Market Size, 2035
- 3.4 Revenue and Volume Growth Outlook
- 3.5 Key Demand and Supply Indicators
- 3.6 Leading Market Segments
- 3.7 Fastest-Growing Market Opportunities
- 3.8 Regional Performance Highlights
- 3.9 Technology and Industry Transformation
- 3.10 Competitive Landscape Summary
- 3.11 Analyst View and Strategic Implications
Chapter 4 India Meat Market Trends and Developments
- 4.1 Historical Industry Development, 2018-2025
- 4.2 Recent Market Trends and Developments
- 4.3 Demand and Customer Behavior Trends
- 4.4 Technology and Product Innovation
- 4.5 Artificial Intelligence, Automation and Digitalization
- 4.6 Local Manufacturing and Supply Chain Realignment
- 4.7 Industry Partnerships, Mergers and Acquisitions
- 4.8 Sustainability and Circular Economy Developments
- 4.9 Government and Private Sector Investment Trends
- 4.10 Emerging Business Models and Commercialization
- 4.11 Industry Developments and Announcements
Chapter 5 India Meat Market Production, Supply and Demand Analysis
- 5.1 Demand Trend and Consumption Analysis, 2018-2025
- 5.2 Demand Forecast, 2025-2035
- 5.3 Production and Output Trend, 2018-2025
- 5.4 Production and Output Forecast, 2025-2035
- 5.5 Installed Capacity and Capacity Utilization
- 5.6 Company-Wise Production Plants and Statistics
- 5.6.1 Installed Production Capacity
- 5.6.2 Actual Production
- 5.6.3 Planned Capacity and Expansion Targets
- 5.7 Supply Chain Structure and Procurement Trends
- 5.8 Supply-Demand Gap and Bottlenecks
- 5.9 Import Dependence and Sourcing Structure
- 5.10 Contract Manufacturing and Outsourcing
- 5.11 Regional Supply and Demand Concentration
Chapter 6 India Meat Market Pricing Analysis
- 6.1 Pricing Structure and Measurement
- 6.2 Historical Pricing Trends, 2018-2025
- 6.3 Pricing Outlook, 2025-2035
- 6.4 Average Selling Price and Unit Economics
- 6.5 Pricing by Product and Market Segment
- 6.6 Geographic Pricing Differences
- 6.7 Key Input, Energy, Labor and Logistics Costs
- 6.8 Contract Pricing and Purchasing Models
- 6.9 Pricing Sensitivity and Competitive Positioning
- 6.10 Price, Margin and Profitability Implications
Chapter 7 India Meat Market Dynamics
- 7.1 Market Growth Drivers
- 7.1.1 Demand-Side Drivers
- 7.1.2 Technology and Innovation Drivers
- 7.1.3 Infrastructure and Investment Drivers
- 7.1.4 Regulatory and Policy Drivers
- 7.2 Market Restraints
- 7.2.1 Cost and Affordability Constraints
- 7.2.2 Technology and Adoption Barriers
- 7.2.3 Supply Chain and Operational Constraints
- 7.3 Market Challenges
- 7.3.1 Competitive Pressure and Margin Erosion
- 7.3.2 Skills, Infrastructure and Implementation Gaps
- 7.4 Emerging Market Opportunities
- 7.5 Market Dynamics Impact and Time-Horizon Assessment
Chapter 8 India Meat Value Chain Analysis
- 8.1 Industry Value Chain Overview
- 8.2 Upstream Suppliers and Critical Inputs
- 8.3 Technology and Component Providers
- 8.4 Manufacturing or Service Delivery
- 8.5 Distribution, Channel Partners and Integrators
- 8.6 Downstream Applications and End Users
- 8.7 Value Addition and Profit Pools
- 8.8 Vertical Integration and Outsourcing
- 8.9 Supplier Concentration and Risk
- 8.10 Supply Chain Localization and Resilience
Chapter 9 India Meat Market Regulations and Policies
- 9.1 Relevant Laws, Standards and Compliance Frameworks
- 9.2 Product, Service, Safety and Quality Requirements
- 9.3 Government Policies, Incentives and Subsidies
- 9.4 Imports, Exports and Trade Barriers
- 9.5 Public Procurement and Local Content Requirements
- 9.6 Environmental and Sustainability Compliance
- 9.7 Upcoming Policy Changes and Market Implications
Chapter 10 India Meat Market Hotspots and Opportunities
- 10.1 Market Opportunity Mapping and Growth Hotspots
- 10.2 High-Growth Applications and Customer Groups
- 10.3 Underserved Markets and White-Space Opportunities
- 10.4 Emerging Technology and Product Opportunities
- 10.5 New Capacity and Investment Hotspots
- 10.6 Market Entry and Expansion Opportunities
- 10.7 Distribution and Partnership Opportunities
- 10.8 Near-Term and Long-Term Commercial Potential
- 10.9 Opportunity Attractiveness and Execution Risks
Chapter 11 India Meat Market Outlook, 2025-2035
- 11.1 Market Size and Analysis
- 11.1.1 Revenue (Market Measurement: 2025: USD 59.99 billion → 2035: USD 131.89 billion)
- 11.1.2 Market Volume and Quantity Sold
- 11.1.3 Historical Market Size, 2018-2025
- 11.1.4 Base-Year Market Size, 2025
- 11.2 Market Forecast, 2025-2035
- 11.2.1 Revenue Forecast to 2035
- 11.2.2 Volume Forecast to 2035
- 11.2.3 CAGR and Year-on-Year Growth
- 11.2.4 Incremental Revenue Opportunity
- 11.3 Forecast Assumptions and Scenario Analysis
- 11.3.1 Base-Case Forecast
- 11.3.2 Optimistic and Conservative Scenarios
- 11.3.3 Technology, Pricing and Policy Sensitivities
- 11.4 Market Attractiveness and Growth Outlook
Chapter 12 India Meat Market Segmentation and Outlook
- 12.1 Segmentation Summary and Market Shares, 2025
- 12.2 Largest and Fastest-Growing Segments
- 12.3 By Meat Type - Market Size and Forecast, 2025-2035
- 12.3.1 Segment Definition and Scope
- 12.3.2 Historical Market Size, 2018-2025
- 12.3.3 Revenue Forecast, 2025-2035
- 12.3.4 Volume Forecast, 2025-2035
- 12.3.5 Base-Year Market Share, 2025
- 12.3.6 Segment CAGR and Growth Drivers
- 12.3.7 Subsegment Market Size and Forecast
- 12.3.7.1 Poultry Meat
- 12.3.7.2 Buffalo Meat
- 12.3.7.3 Goat and Sheep Meat
- 12.3.7.4 Pork and Cattle Meat
- 12.3.8 Subsegment Pricing and Adoption Trends
- 12.3.9 Leading Suppliers and Competition
- 12.3.10 Regional Demand and Opportunities
- 12.4 By Customer Type - Market Size and Forecast, 2025-2035
- 12.4.1 Segment Definition and Scope
- 12.4.2 Historical Market Size, 2018-2025
- 12.4.3 Revenue Forecast, 2025-2035
- 12.4.4 Volume Forecast, 2025-2035
- 12.4.5 Base-Year Market Share, 2025
- 12.4.6 Segment CAGR and Growth Drivers
- 12.4.7 Subsegment Market Size and Forecast
- 12.4.7.1 Households
- 12.4.7.2 HoReCa and QSR Operators
- 12.4.7.3 Institutional Caterers
- 12.4.7.4 Food Manufacturers
- 12.4.8 Subsegment Pricing and Adoption Trends
- 12.4.9 Leading Suppliers and Competition
- 12.4.10 Regional Demand and Opportunities
- 12.5 By Packaging Format - Market Size and Forecast, 2025-2035
- 12.5.1 Segment Definition and Scope
- 12.5.2 Historical Market Size, 2018-2025
- 12.5.3 Revenue Forecast, 2025-2035
- 12.5.4 Volume Forecast, 2025-2035
- 12.5.5 Base-Year Market Share, 2025
- 12.5.6 Segment CAGR and Growth Drivers
- 12.5.7 Subsegment Market Size and Forecast
- 12.5.7.1 Loose Fresh Cuts
- 12.5.7.2 Tray-Packed Chilled Meat
- 12.5.7.3 Vacuum-Packed Chilled Meat
- 12.5.7.4 Frozen and Processed Packs
- 12.5.8 Subsegment Pricing and Adoption Trends
- 12.5.9 Leading Suppliers and Competition
- 12.5.10 Regional Demand and Opportunities
- 12.6 Segment Growth Comparison
- 12.7 Segment Attractiveness and Priority Matrix
Chapter 13 India Meat End-Use and Application Market Outlook
- 13.1 End-Use Industry and Customer Demand Structure
- 13.2 Leading Applications and Customer Groups
- 13.3 End-Use Market Size, Share and Forecast
- 13.4 Major End-Use Industry Deep Dives
- 13.4.1 Customer Requirements and Use Cases
- 13.4.2 Demand and Replacement Cycles
- 13.4.3 Technical and Regulatory Considerations
- 13.4.4 Purchasing and Procurement Models
- 13.4.5 Leading Vendors and Distribution Channels
- 13.4.6 Forecast and Commercial Opportunities
- 13.5 Emerging Applications and Cross-Segment Demand
- 13.6 End-Use Industry Investment Priorities
Chapter 14 India Meat Geographic Market Outlook, 2025-2035
- 14.1 Domestic Market Distribution and Demand Clusters
- 14.2 State- or Province-Wise Market Size and Forecast, 2025-2035
- 14.3 City and Metropolitan Market Outlook
- 14.4 Industrial, Manufacturing and Commercial Clusters
- 14.5 Geographic Concentration of Key End Users
- 14.6 Local Pricing and Purchasing Differences
- 14.7 Domestic Production Facilities and Capacity Map
- 14.8 Local Infrastructure and Project Pipeline
- 14.9 State-Level Policy and Incentive Differences
- 14.10 Subnational Investment Hotspots and Opportunities
- 14.11 Distribution and Logistics Networks
- 14.12 Domestic Competitive Footprint
Chapter 15 India Meat Technology, Innovation and Sustainability Outlook
- 15.1 Technology Landscape and Maturity
- 15.2 Product, Process and Service Innovation
- 15.3 AI, Automation and Digital Tools in the Industry
- 15.4 Technology Adoption and Performance Benchmarking
- 15.5 Innovation Pipeline and R&D Investment
- 15.6 Patent and Intellectual Property Trends
- 15.7 Energy Efficiency and Resource Management
- 15.8 Sustainability, Recycling and Circularity
- 15.9 Technology Roadmap, 2025-2035
- 15.10 Risks of Obsolescence and Technology Substitution
Chapter 16 India Meat Market Key Strategic Imperatives
- 16.1 Growth and Market Entry Priorities
- 16.2 High-Return Products and Segments
- 16.3 Pricing, Profitability and Cost Optimization
- 16.4 Technology Investment and Product Differentiation
- 16.5 Supply Chain Localization and Resilience
- 16.6 Distribution and Customer Acquisition
- 16.7 Partnership, Acquisition and Capacity Strategy
- 16.8 Regional Expansion Priorities
- 16.9 Short-, Medium- and Long-Term Actions
Chapter 17 Competition Outlook
- 17.1 Industry Competition Characteristics
- 17.2 Market Structure and Concentration
- 17.3 Market Share and Competitive Positioning, 2025
- 17.4 Company-Wise Revenue and Product Benchmarking
- 17.5 Production and Service Capacity Benchmarking
- 17.6 Technology, Pricing and Differentiation
- 17.7 Regional Footprint and Distribution Strength
- 17.8 Mergers, Acquisitions and Strategic Alliances
- 17.9 New Entrants and Competitive Threats
- 17.10 Porter's Five Forces and Industry Attractiveness
- 17.11 Competitive Outlook, 2025-2035
Chapter 18 Company Profiles
- 18.1 Company Coverage and Selection Criteria
- 18.2 Suguna Foods Pvt Ltd
- 18.2.1 Business Description
- 18.2.2 Company Ownership and Geographic Presence
- 18.2.3 Product and Service Portfolio
- 18.2.4 Manufacturing and Operating Footprint
- 18.2.5 Production Capacity and Expansion Plans
- 18.2.6 Financial Performance and Investment
- 18.2.7 Market Share and Competitive Position
- 18.2.8 Technology and Innovation Capabilities
- 18.2.9 Strategic Alliances or Partnerships
- 18.2.10 Recent Developments
- 18.2.11 Growth Strategy and Outlook
- 18.3 Venky's (India) Ltd
- 18.4 Godrej Tyson Foods Ltd
- 18.5 IB Group
- 18.6 Sneha Group
- 18.7 Srinivasa Farms Pvt Ltd
- 18.8 Allanasons Pvt Ltd
- 18.9 HMA Agro Industries Ltd
- 18.10 Al Kabeer Exports Pvt Ltd
- 18.11 Delightful Gourmet Pvt Ltd (Licious)
- 18.12 Other Relevant Market Participants
Note: Every listed company is profiled on the structure shown under the first company. The company list is preliminary and may change based on research findings, market developments, data availability and client requirements.
Chapter 19 Disclaimer
- 19.1 Research and Forecast Disclaimer
- 19.2 Data Source and Estimation Limitations
Note: The depth of individual sections depends on data availability for this market. Volume, capacity, trade and other unit-based metrics are included where applicable.

