
Market Overview
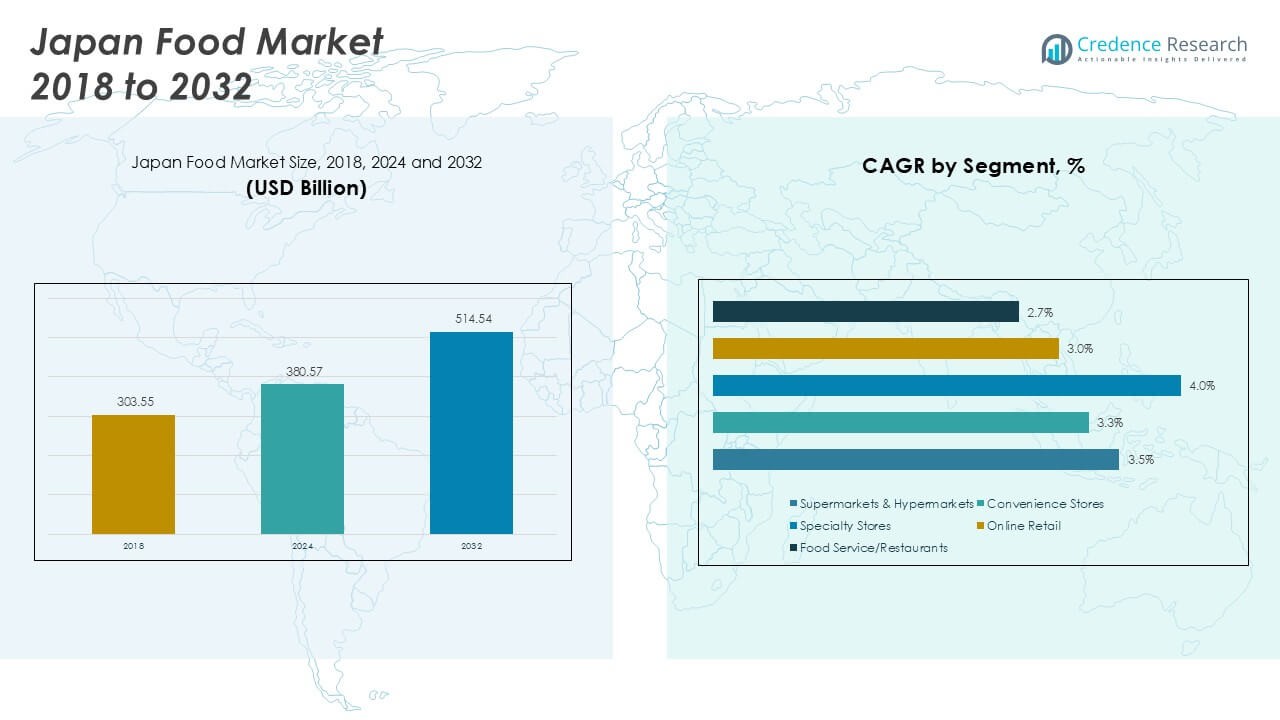
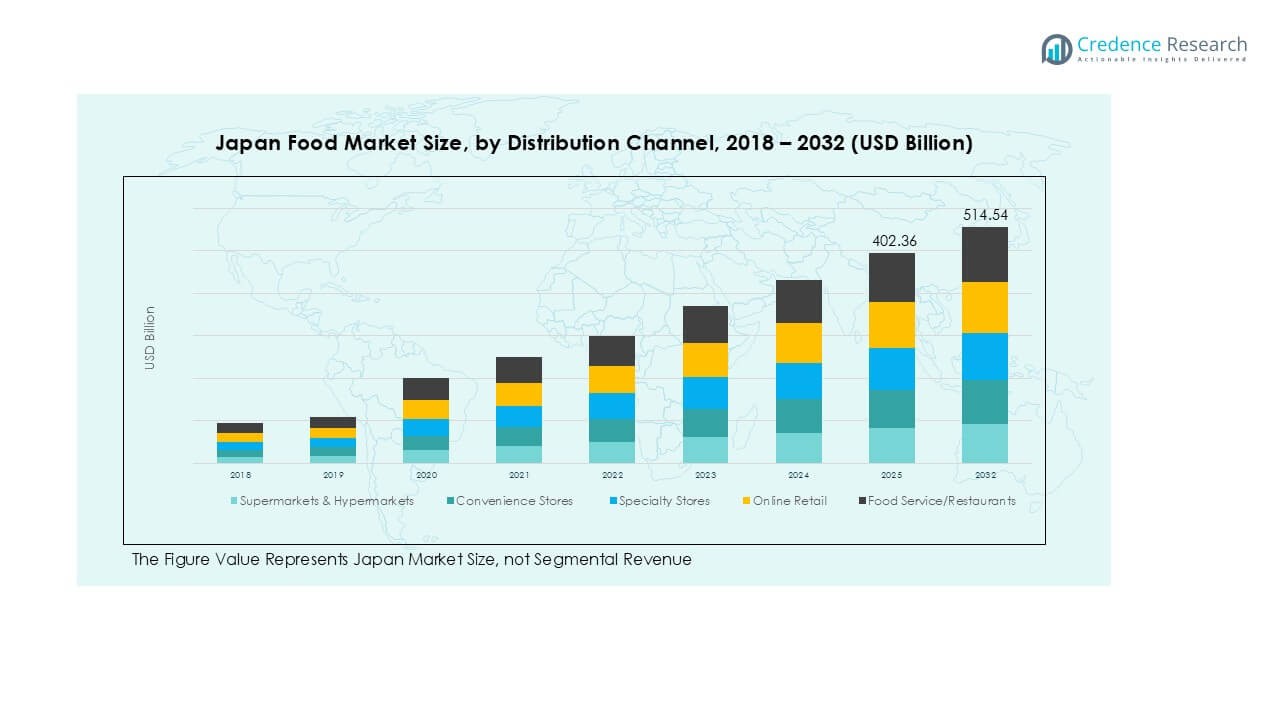
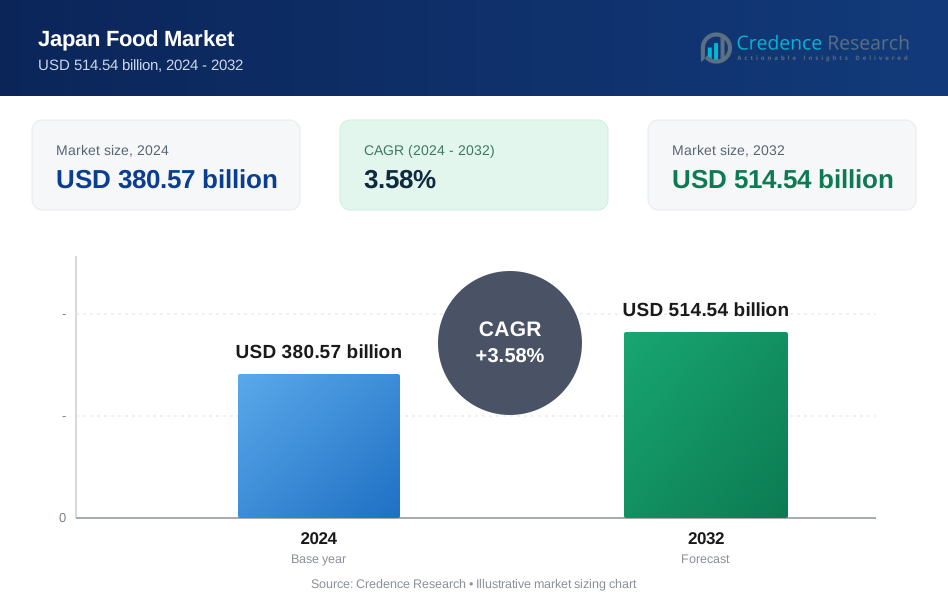
Japan Food market size was valued at USD 303.55 billion in 2018 to USD 380.57 billion in 2024 and is anticipated to reach USD 514.54 billion by 2032, at a CAGR of 3.58% during the forecast period.
| REPORT ATTRIBUTE | DETAILS |
|---|---|
| Historical Period | 2020-2023 |
| Base Year | 2024 |
| Forecast Period | 2025-2032 |
| Japan Food Market Size 2024 | USD 380.57 Billion |
| Japan Food Market, CAGR | 3.58% |
| Japan Food Market Size 2032 | USD 514.54 Billion |
The Japan food market is led by prominent players such as Asahi Group Holdings, Suntory Group, Meiji Holdings, Ajinomoto Co. Inc., Yamazaki Baking Co. Ltd., and Maruha Nichiro Corporation, alongside global participants like Coca-Cola, Associated British Foods, and General Mills. These companies maintain strong portfolios spanning beverages, dairy, seafood, confectionery, and ready-to-eat foods, supported by wide retail networks and innovation in healthier, premium categories. Regionally, the Kanto region dominates with a 36% market share, driven by Tokyo’s dense population, modern retail infrastructure, and high purchasing power. Kansai follows with 22%, supported by strong culinary traditions and tourism demand. Together, these regions form the backbone of Japan’s food market while driving nationwide consumption trends.
Market Insights
- Japan Food Market size was USD 303.55 billion in 2018, reached USD 380.57 billion in 2024, and is expected to hit USD 514.54 billion by 2032, at a CAGR of 3.58%.
- Rising demand for fresh vegetables and convenience foods drives consumption, with vegetables holding the largest product share at 22%, supported by health-conscious consumer preferences and dietary traditions.
- Key trends include growth in online retail channels, sustainability-focused packaging, and innovation in ready-to-eat meals tailored to aging demographics and busy urban lifestyles.
- Competitive landscape is dominated by Asahi Group, Suntory, Meiji Holdings, Ajinomoto, Yamazaki Baking, and Maruha Nichiro, along with global brands such as Coca-Cola, Associated British Foods, and General Mills.
- Regional analysis shows Kanto leading with 36% market share, followed by Kansai at 22%, Chubu at 18%, Kyushu & Okinawa at 14%, and Tohoku & Hokkaido at 10%, shaping national consumption trends.
Market Segmentation Analysis:
By Product
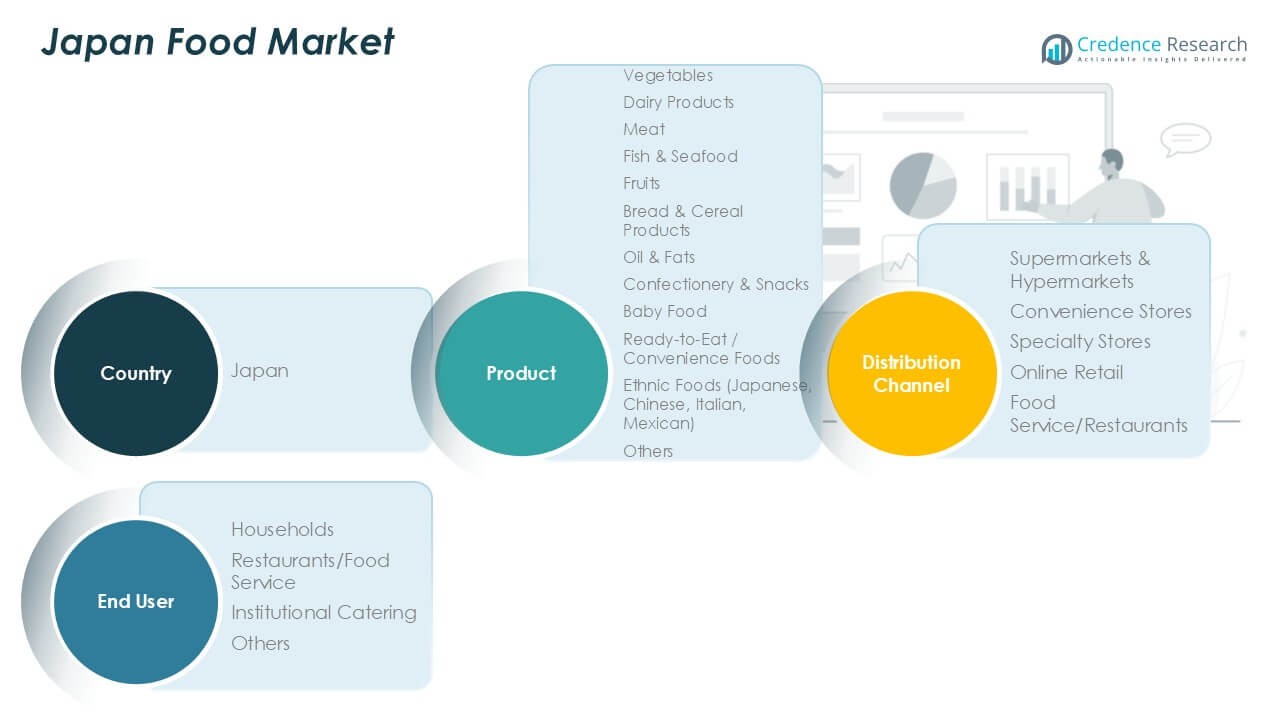
Vegetables hold the dominant share in Japan’s food market, accounting for over 22% of total consumption. Their demand is driven by the country’s strong preference for fresh produce and traditional diets rich in seasonal vegetables. Dairy products and meat follow closely, supported by rising protein intake and western dietary influences. Fish and seafood remain integral due to cultural significance, while fruits and bread & cereal products contribute steadily. Ready-to-eat and convenience foods show rapid growth, reflecting urban lifestyles and increased demand for quick meal solutions among working households.
- For instance, Aeon is one of Japan's largest retail groups, but it operates under a complex structure with multiple store formats and subsidiaries, not as a single entity called "Aeon Retail" with a unified store count. The overall Aeon Group operates tens of thousands of stores across Asia. As of 2023, the entire group had over 20,000 locations, with the majority in Japan. A figure like 3,000 more accurately reflects the number of larger-scale supermarkets and hypermarkets operated by the Aeon Group, such as JUSCO, MaxValu, and Daiei, rather than the total number of all Aeon-related stores.
By Distribution Channel
Supermarkets and hypermarkets dominate distribution, representing around 40% of food sales in Japan. They lead due to wide product availability, competitive pricing, and strong trust in quality assurance. Convenience stores, which contribute a significant portion of sales, thrive on accessibility and frequent consumer visits, especially in urban areas. Online retail shows strong momentum, driven by e-commerce adoption and demand for home delivery services. Food service and restaurants also form a notable share, catering to Japan’s dining-out culture and shifting consumer preferences toward prepared and specialty foods.
- For instance, Ito-Yokado, a leading supermarket chain in Japan, operates fewer than 125 stores. In March 2023, its parent company, Seven & i Holdings, announced closures of 33 stores by February 2024, bringing the total number of stores in Japan to 93. The chain has also exited the Hokkaido, Tohoku, and Shinetsu regions.
By End User
Households remain the largest end-user segment, capturing more than 55% of the market share. Demand is supported by everyday consumption needs and the tradition of home-prepared meals. Restaurants and food service operators account for a substantial share, benefiting from Japan’s vibrant dining sector and growing demand for convenience eating. Institutional catering serves hospitals, schools, and corporate facilities, ensuring stable demand for standardized and bulk food supply. The “Others” category includes niche applications such as packaged meals for travel and events, contributing steadily to overall market expansion.
Key Growth Drivers
Health-Conscious Consumer Preferences
Rising health awareness strongly drives demand for fresh, organic, and minimally processed foods in Japan. Consumers increasingly prioritize nutrient-rich diets, fueling growth in vegetables, fruits, and dairy alternatives. Government initiatives promoting balanced nutrition further reinforce this trend. Products marketed as low-sodium, sugar-free, or high in protein gain higher traction. This shift encourages food manufacturers to innovate healthier options while retaining taste and convenience. The health-driven demand establishes a stable base for long-term market growth and supports premiumization in food offerings.
- For instance, Aeon's private label, Topvalu, features the "Green Eye" line of organic products, first launched in 1993.
Expansion of Convenience Foods
Busy urban lifestyles and rising female workforce participation accelerate the adoption of ready-to-eat and convenience foods. Japan’s aging population also contributes, as seniors prefer easy-to-prepare meals. Growth in microwaveable, frozen, and portion-controlled products reflects this shift. Food companies invest in packaging innovations and extended shelf-life technologies to maintain quality and appeal. Convenience stores remain critical in distribution, ensuring quick consumer access. This driver significantly reshapes demand patterns, enabling brands to focus on value-added products that balance speed, nutrition, and taste.
- For instance, Seven & i Holdings operates over 21,000 7-Eleven stores in Japan. The company focuses on strengthening high-value and freshly made counter items in response to changing consumption patterns.
Strong Food Export Potential
Japan leverages its reputation for food safety, high standards, and unique culinary heritage to strengthen exports. Rising global demand for Japanese seafood, confectionery, and premium ethnic foods boosts international trade opportunities. Government-backed initiatives, such as export promotion programs, support manufacturers in reaching overseas markets. Export growth contributes to revenue diversification, helping companies withstand domestic demographic challenges. By expanding Japanese food products globally, the industry benefits from cultural appeal, premium positioning, and increased global brand recognition. This driver enhances competitiveness on an international scale.
Key Trends & Opportunities
Digital Transformation and Online Retail Growth
E-commerce penetration in Japan’s food sector is expanding rapidly, driven by consumer demand for home delivery and subscription-based meal services. Online platforms offer broader product ranges and personalized promotions, enhancing shopping convenience. Companies leverage data analytics and AI tools to forecast demand and streamline logistics. Partnerships between supermarkets and online delivery services create hybrid models, ensuring seamless consumer experiences. This trend offers significant opportunity for food brands to expand market reach, particularly among younger consumers and urban households with busy lifestyles.
- For instance, Rakuten announced in August 2024 that the fulfillment centers for the new Rakuten Mart business were able to handle approximately 70,000 orders per day, which amounts to about 25.5 million orders annually at maximum capacity.
Sustainability and Eco-Friendly Packaging
Sustainability pressures are shaping procurement, production, and packaging strategies within Japan’s food industry. Consumers increasingly prefer recyclable, biodegradable, and reduced-plastic packaging. Government regulations, including waste reduction targets, encourage companies to invest in eco-friendly materials and supply chain transparency. Brands adopting carbon labeling and renewable energy in manufacturing gain strong market appeal. This trend creates opportunities for innovation in packaging technology, waste management, and sustainable sourcing. Companies aligning with environmental values secure consumer loyalty and regulatory compliance, positioning themselves for long-term resilience.
- For instance, Asahi Soft Drinks began producing large-sized bottles made from 100% chemically recycled resin in Japan in April 2022. However, this only accounted for about 40% of the company's large PET bottle production.
Key Challenges
Aging Population and Declining Birth Rate
Japan’s demographic imbalance poses a significant challenge to food market growth. A shrinking workforce and declining household size reduce demand for bulk food purchases. Aging consumers also shift preferences toward health-oriented and smaller portion products, affecting product mix strategies. Manufacturers must continuously adapt offerings to meet demographic-driven consumption changes. This demographic reality limits long-term volume growth, requiring companies to diversify through exports and niche product innovation. The challenge demands strategic adjustments across product development, marketing, and distribution channels.
High Operational and Supply Chain Costs
The Japan food industry faces rising operational expenses from labor shortages, energy costs, and raw material price volatility. Imported commodities, including grains and oils, expose the sector to currency fluctuations and supply disruptions. Strict safety and quality regulations add compliance costs, particularly for SMEs. Logistics expenses also rise due to last-mile delivery demands and fragmented distribution systems. These challenges pressure profit margins and reduce competitiveness against imported alternatives. Companies must adopt automation, digital supply chains, and cost-efficient sourcing strategies to remain sustainable.
Regional Analysis
Kanto Region
Kanto region, which includes Tokyo, dominates the Japan food market with a 36% share. The region benefits from its dense population, urban lifestyles, and strong presence of supermarkets, hypermarkets, and convenience stores. High demand for ready-to-eat and packaged foods reflects the fast-paced working culture. Tokyo’s role as a hub for international cuisines and premium food imports also boosts sales. Rising health-conscious preferences drive consumption of fresh vegetables, dairy alternatives, and seafood. With significant disposable income, Kanto continues to lead in both traditional and modern food consumption patterns.
Kansai Region
The Kansai region holds a 22% share of Japan’s food market, anchored by Osaka, Kyoto, and Kobe. Kansai is renowned for its culinary heritage, with strong demand for seafood, confectionery, and specialty regional foods. Local preferences for noodles, confectionery, and ready-made meals fuel retail and restaurant growth. The area’s large student population and tourism sector also enhance food service demand. Supermarkets dominate distribution, while convenience stores and specialty outlets thrive in urban centers. Kansai’s food market continues to expand through innovation in packaged foods and strong tourism-driven demand.
Chubu Region
The Chubu region accounts for 18% of the market share, driven by industrial hubs such as Nagoya and surrounding prefectures. The region shows strong demand for bread, cereals, and meat products, reflecting westernized food habits alongside traditional consumption. Seafood and vegetables also remain essential, supported by local production. Supermarkets lead distribution, while convenience stores grow steadily due to commuter populations. Rising income levels in urban clusters foster interest in premium and organic food products. Chubu’s central location strengthens supply chain efficiency, supporting both domestic consumption and export-related food processing activities.
Kyushu & Okinawa Region
Kyushu and Okinawa collectively represent 14% of Japan’s food market. The region has a strong agricultural base, producing vegetables, fruits, and specialty meats. Seafood demand remains robust, supported by coastal fisheries. Tourism significantly drives demand in Okinawa, where ethnic and ready-to-eat foods perform well. Supermarkets dominate, but food service outlets also thrive due to local culinary traditions and high tourist inflows. Kyushu’s position as a major agricultural supplier supports steady food availability. The market’s growth is reinforced by rising interest in fresh, locally sourced produce and healthier product categories.
Tohoku & Hokkaido Region
The Tohoku and Hokkaido region holds a 10% market share, with food consumption anchored by agriculture and fisheries. Hokkaido is Japan’s leading dairy and seafood producer, making dairy products and fish major food categories in the region. Vegetables and fruits from Tohoku add to the supply chain strength. Distribution relies heavily on supermarkets, while specialty stores highlight regional produce and seafood. Population decline slightly limits consumption, but strong agricultural output sustains the market. Increasing interest in regional specialties across Japan also creates opportunities for expanding processed and packaged foods from these areas.
Market Segmentations:
By Product
- Vegetables
- Dairy Products
- Meat
- Fish & Seafood
- Fruits
- Bread & Cereal Products
- Oil & Fats
- Confectionery & Snacks
- Baby Food
- Ready-to-Eat / Convenience Foods
- Ethnic Foods (Japanese, Chinese, Italian, Mexican)
- Others
By Distribution Channel
- Supermarkets & Hypermarkets
- Convenience Stores
- Specialty Stores
- Online Retail
- Food Service/Restaurants
By End User
- Households
- Restaurants/Food Service
- Institutional Catering
- Others
By Geography
- Kanto Region
- Kansai Region
- Chubu Region
- Kyushu & Okinawa Region
- Tohoku & Hokkaido Region
Competitive Landscape
The Japan food market is highly competitive, shaped by domestic leaders and global corporations. Major players such as Asahi Group Holdings, Suntory Group, Meiji Holdings, Ajinomoto Co. Inc., and Yamazaki Baking Co. Ltd. dominate with extensive product portfolios across beverages, dairy, confectionery, and convenience foods. Companies like Maruha Nichiro Corporation strengthen seafood and frozen food offerings, while global firms including Coca-Cola, Associated British Foods, and General Mills compete through international brands and localized strategies. Intense rivalry drives continuous innovation in healthier options, functional foods, and premium segments tailored to shifting consumer preferences. Distribution partnerships with supermarkets, convenience stores, and online platforms enhance reach, while sustainability initiatives and eco-friendly packaging investments gain importance in securing consumer loyalty. Financial strength, brand recognition, and ability to adapt to Japan’s aging demographics remain key competitive factors. Market leaders actively pursue R&D, acquisitions, and exports to strengthen positions in both domestic and global markets.
Key Player Analysis
- Asahi Group Holdings
- Hanwa Co., Ltd.
- Suntory Group
- Meiji Holdings Co., Ltd.
- Ajinomoto Co. Inc.
- Yamazaki Baking Co., Ltd.
- Maruha Nichiro Corporation
- Coca-Cola
- Associated British Foods PLC
- General Mills Inc.
Recent Developments
- In August 2022, Starbucks has launched a new fall drink called the Marrone "Cassis Frappuccino". The blended beverage combines earthy chestnuts and cassis with Starbucks signature coffees from all over Japan.
- In March 2022, Domino Japan opens its 900th store. It is the first Domino's Pizza Enterprises Ltd location to reach this milestone, just nine months after the company opened its 800th location.
Report Coverage
The research report offers an in-depth analysis based on Product, Distribution Channel, End User and Geography. It details leading market players, providing an overview of their business, product offerings, investments, revenue streams, and key applications. Additionally, the report includes insights into the competitive environment, SWOT analysis, current market trends, as well as the primary drivers and constraints. Furthermore, it discusses various factors that have driven market expansion in recent years. The report also explores market dynamics, regulatory scenarios, and technological advancements that are shaping the industry. It assesses the impact of external factors and global economic changes on market growth. Lastly, it provides strategic recommendations for new entrants and established companies to navigate the complexities of the market.
Future Outlook
- The market will expand steadily, supported by stable domestic demand and growing exports.
- Health-conscious eating will drive higher sales of fresh produce, dairy alternatives, and functional foods.
- Convenience and ready-to-eat categories will continue to grow with urban lifestyles.
- Online retail and digital grocery platforms will strengthen distribution reach across all age groups.
- Sustainability efforts will reshape packaging choices with recyclable and eco-friendly materials.
- Innovation in plant-based and alternative protein foods will gain wider consumer acceptance.
- Premium and specialty ethnic foods will capture increasing demand from younger consumers.
- Aging demographics will drive growth in smaller portions and health-oriented foods.
- Competitive intensity will rise as global brands expand alongside domestic leaders.
- Regional markets such as Kanto and Kansai will remain central, while Chubu and Kyushu will provide growth opportunities.
Request a Free Sample
Fill in your details and we'll send you a free sample report.
- Sample data tables & charts
- Research methodology
Need a Custom Version of This Report?
Tailor the scope, geography, or segments to your exact requirements.
- Custom geography or segment scope
- Direct access to our analyst team
Frequently Asked Questions
What is the current market size for Japan Food market, and what is its projected size in 2032?
At what Compound Annual Growth Rate is the Japan Food market projected to grow between 2025 and 2032?
Which Japan Food market segment held the largest share in 2024?
What are the primary factors fueling the growth of the Japan Food market?
Who are the leading companies in the Japan Food market?
Which region commanded the largest share of the Japan Food market in 2024?
Table of Content
Chapter 1. Report Introduction
- 1.1 Report Description & Purpose
- 1.1.1 Report Title & Market Definition
- 1.1.2 Unique Selling Propositions (USP) & Key Differentiators
- 1.1.3 Value Proposition for Stakeholders
- 1.2 Research Objectives
- 1.2.1 Market Sizing Objectives (Volume & Revenue) (Volume Where Applicable)
- 1.2.2 Segmentation Objectives
- 1.2.3 Competitive Intelligence Objectives
- 1.2.4 Forecast & Scenario Objectives
- 1.3 Report Scope
- 1.3.1 Japan Food Scope – Segments & Subsegments Covered
- 1.3.2 Geographic Scope – Selected Country & Subnational Markets Covered
- 1.3.3 Historical Period, Base Year & Forecast Period (2024; forecast to 2032)
- 1.3.4 Inclusions & Exclusions
- 1.4 Industry Classification & Applicable Codes
- 1.5 Currency, Measurement Units & Valuation Basis
- 1.6 Target Stakeholders
- 1.7 Limitations & Assumptions
Chapter 2. Executive Summary
- 2.1 Japan Food Snapshot
- 2.1.1 Market Size – Historical (2024) & Forecast (2024-2032) (2024: USD 380.57 billion → 2032: USD 514.54 billion)
- 2.1.2 Volume & Revenue – National Totals (Volume Where Applicable)
- 2.1.3 Key Market Highlights – Top Five Facts
- 2.2 Japan Food Segmentation Snapshot
- 2.2.1 Market Split by Subnational Area – 2024 vs. 2032
- 2.3 Competitive Snapshot
- 2.3.1 Top 10 Players by Revenue Share – 2024
- 2.3.2 Top 10 Players by Volume Share – 2024 (Volume Where Applicable)
- 2.3.3 Recent Strategic Developments (18-Month Summary)
- 2.4 Key Investment Highlights & Strategic Conclusions
Chapter 3. Japan Food Dynamics & Industry Analysis
- 3.1 Market Overview & Context
- 3.1.1 Japan Food Position in the Broader Industry Value Chain
- 3.1.2 Demand Structure & Purchasing Dynamics
- 3.1.3 Market Maturity & Development Stage Across Domestic Markets
- 3.2 Japan Food Drivers
- 3.3 Japan Food Restraints & Challenges
- 3.4 Japan Food Opportunities
- 3.5 Porter's Five Forces Analysis
- 3.5.1 Threat of New Entrants
- 3.5.2 Bargaining Power of Suppliers
- 3.5.3 Bargaining Power of Buyers
- 3.5.4 Threat of Substitutes
- 3.5.5 Competitive Rivalry – Intensity Assessment
- 3.6 Japan Food Value Chain Analysis
- 3.6.1 Upstream – Key Inputs, Resources & Suppliers
- 3.6.1.1 Key Input/Resource 1
- 3.6.1.2 Key Input/Resource 2
- 3.6.1.3 Key Input/Resource 3
- 3.6.2 Midstream – Core Operations & Value Creation
- 3.6.2.1 Operating Model & Process Overview
- 3.6.2.2 Key Operating Locations & Capabilities by Company
- 3.6.3 Downstream – Market Channels & End Users
- 3.6.3.1 Direct Sales & Customer Engagement Channels
- 3.6.3.2 Indirect Sales, Intermediaries & Partner Channels
- 3.6.4 Value Chain Profitability Analysis
- 3.6.1 Upstream – Key Inputs, Resources & Suppliers
- 3.7 PESTEL Analysis
- 3.7.1 Political Factors
- 3.7.2 Economic Factors
- 3.7.3 Social Factors
- 3.7.4 Technological Factors
- 3.7.5 Environmental Factors
- 3.7.6 Legal Factors
- 3.8 Japan Food Supply Chain Analysis
- 3.8.1 Critical Input & Resource Availability Risk Assessment
- 3.8.2 Supplier & Operational Concentration Risk (Geographic Exposure)
- 3.8.3 Supply & Service Disruption Impact Analysis
- 3.9 National & Subnational Regulatory Landscape
Note: The regulatory and policy landscape section covers regulations based on their applicability to the market, Japan Food category, geography, and scope of the study. Only regulatory frameworks with a material impact on operations, compliance, trade, sustainability, or market access are analyzed in detail.
Chapter 4. Key Investment Pockets & Opportunity Analysis
- 4.1 Japan Food Attractiveness Analysis
- 4.1.1 By Subnational Area – Investment Attractiveness Matrix (Market Size × CAGR)
- 4.2 Absolute Revenue Growth Opportunity
- 4.2.1 By Subnational Area – Absolute Revenue Growth Through 2032
- 4.3 Incremental Demand Opportunity
- 4.3.1 By Subnational Area – Incremental Demand Through 2032
- 4.3.2 Segment – Incremental Demand
- 4.4 Emerging Submarket Opportunity Deep Dive (Subject to Applicability)
- 4.5 Priority Domestic Market Opportunity Scorecards
- 4.5.1 Priority Domestic Market 1
- 4.5.2 Priority Domestic Market 2
- 4.5.3 Priority Domestic Market 3
- 4.5.4 Priority Domestic Market 4
Note: Domestic market scorecards cover relevant states, provinces, territories, cities, or economic zones within the selected country. Numbered entries are populated with market names suited to the national administrative structure and research scope. Geographic share tables use one consistent, nonoverlapping set of areas.
Chapter 5. Japan Food Cross-Border Trade & Market Access Analysis
- 5.1 National Trade & International Partner Overview
- 5.1.1 Export Value by Destination Country (2024)
- 5.1.2 Export Volume by Destination Country (2024) (Where Applicable)
- 5.1.3 Import Value by Source Country (2024)
- 5.1.4 Import Volume by Source Country (2024) (Where Applicable)
- 5.1.5 National & Partner-Country Trade Balances (2024)
- 5.2 Export Analysis – Segment
- 5.2.1 Category 1 (Applicable Classification Code)
- 5.2.2 Category 2 (Applicable Classification Code)
- 5.2.3 Category 3 (Applicable Classification Code)
- 5.2.4 Category 4 (Applicable Classification Code)
- 5.2.5 Category 5 (Applicable Classification Code)
- 5.3 Import Analysis – Segment
- 5.3.1 Category 1 (Applicable Classification Code)
- 5.3.2 Category 2 (Applicable Classification Code)
- 5.3.3 Category 3 (Applicable Classification Code)
- 5.3.4 Category 4 (Applicable Classification Code)
- 5.3.5 Category 5 (Applicable Classification Code)
- 5.4 Cross-Border Pricing & Transaction Benchmarks
- 5.4.1 Export Pricing – Segment & Destination Country
- 5.4.2 Import Pricing – Segment & Source Country
- 5.4.3 Price Trends (2024)
- 5.5 Key Cross-Border Trade & Delivery Routes
- 5.5.1 Cross-Border Trade/Delivery Route 1
- 5.5.2 Cross-Border Trade/Delivery Route 2
- 5.5.3 Cross-Border Trade/Delivery Route 3
- 5.5.4 Cross-Border Trade/Delivery Route 4
- 5.5.5 Cross-Border Trade/Delivery Route 5
- 5.6 Trade Policy & Market Access Impact Assessment
- 5.6.1 Tariff & Non-Tariff Barriers
- 5.6.2 National Participation in Regional Trade & Economic Frameworks
- 5.6.3 Bilateral & Multilateral Trade Agreements
- 5.6.4 Cross-Border Operating, Licensing & Localization Requirements
Note: This chapter covers international trade relevant to Japan Food in the selected country. Exports are analyzed by destination and imports by source. Domestic interregional flows are excluded from international trade totals. Goods, services, and digital offerings use applicable classifications; volume and route analyses apply only where meaningful.
Chapter 6. Competitive Landscape & Company Benchmarking
- 6.1 Japan Food Concentration & Structure
- 6.1.1 Herfindahl-Hirschman Index (HHI) – vs. 2024
- 6.1.2 Leading, Mid-Sized & Emerging Player Structure
- 6.1.3 Multinational, National & Local Player Dynamics
- 6.2 Japan Food Share Analysis – 2024
- 6.2.1 National Revenue Share by Company
- 6.2.2 National Volume Share by Company (Volume Where Applicable)
- 6.2.3 Company Revenue Share by Subnational Area
- 6.2.4 Market Share Evolution ( vs. 2024)
- 6.2.5 Company Market Share by Key Segment
- 6.2.6 Company Market Share by Customer Group
- 6.3 Operating Scale, Capacity & Infrastructure Analysis
- 6.3.1 National Operating Scale & Supply Capacity
- 6.3.2 Resource Utilization & Operating Efficiency
- 6.3.3 Output, Service Delivery & Activity Metrics
- 6.3.4 Operating Footprint & Infrastructure Map
- 6.3.5 Planned Operational & Capacity Expansion
- 6.4 Japan Food Competitive Benchmarking Matrix
- 6.4.1 Revenue, Growth, Profitability & Operating Metric Comparison
- 6.4.2 Channel Revenue Mix
- 6.4.3 Revenue Exposure Across Domestic Markets
- 6.4.4 R&D Intensity
- 6.4.5 Sustainability Maturity
- 6.5 Strategic Developments in Japan Food (Last 24 Months)
- 6.5.1 Mergers, Acquisitions & Divestments
- 6.5.2 New Products, Services & Solutions in Japan Food
- 6.5.3 Operational & Infrastructure Expansions
- 6.5.4 Strategic Alliances, Joint Ventures & Partnerships
- 6.5.5 Distribution Expansion & Market Entry
- 6.5.6 Sustainability & ESG Initiatives
- 6.6 Competitive Strategy Mapping
- 6.6.1 Leader, Challenger, Follower & Niche Classification
- 6.6.2 Pricing Strategy Comparison
- 6.6.3 Channel Strategy Matrix
Note: Strategic developments are included based on their materiality and the availability of reliable information.
Chapter 7. Japan Food – By Sales & Delivery Channel
- 7.1 Segment Overview
- 7.1.1 Volume & Revenue Split by Channel (2024 & 2032) (Volume Where Applicable)
- 7.1.2 Channel Mix Evolution (2024-2032)
Chapter 8. Subnational Market Analysis – Country Overview
- 8.1 Domestic Geographic Market Overview
- 8.1.1 Subnational Volume Share (Where Applicable)
- 8.1.2 Subnational Revenue Share
- 8.1.3 Market Volume by Subnational Area (Where Applicable)
- 8.1.4 Market Revenue by Subnational Area
- 8.1.5 Subnational Forecasts Through 2032
- 8.2 Cross-Area Segment Analysis Within the Country
- 8.2.1 By Sales & Delivery Channel
- 8.2.2 By Competitive Positioning & Price Tier
Chapter 9. Japan Food – Priority Domestic Market 1
Chapter 10. Japan Food – Priority Domestic Market 2
Chapter 11. Japan Food – Priority Domestic Market 3
Chapter 12. Japan Food – Priority Domestic Market 4
Chapter 13. Japan Food Company Profiles
- 13.1 [Company 01]
- 13.1.1 Company Overview
- 13.1.2 Key Management Personnel
- 13.1.3 Products & Services Portfolio
- 13.1.4 Financial Performance
- 13.1.5 Domestic Market Focus & Local Operating Presence
- 13.1.6 Recent Developments & Strategic Initiatives
Note: The company profile list is preliminary and may change based on research findings, market developments, data availability, and client requirements.
Chapter 14. Appendices
- Appendix A – List of Abbreviations & Acronyms
- Appendix B – Industry Classification Code Reference – Full Series
- Appendix C – Supply, Output & Operating Capacity Data Tables
- Appendix D – End-Use & Demand Base Tables
- Appendix E – Demand, Adoption & Usage Assumptions
- Appendix F – Pricing & Revenue Metric Reference Tables
- Appendix G – Company Operations & Infrastructure Database
- Appendix H – Cross-Border Trade & Activity Data Tables (Where Applicable)
- Appendix I – Regulatory Summary Tables
- Appendix J – Primary Research Participant List (Anonymized)
- Appendix K – Primary Research Questionnaire Framework
- Appendix L – Data Sources & Bibliography
- Appendix M – Market Size Divergence & Source Comparison
Chapter 15. Research Methodology
- 15.1 Research Framework & Philosophy
- 15.2 Secondary Research – Sources, Hierarchy & Data Extraction
- 15.3 Data Modeling – National Market Sizing & Subnational Allocation
- 15.4 Primary Research – Stakeholder Framework, LOI & Sample Sizes
- 15.5 Forecast Methodology – Regression, Scenario & Sensitivity Analysis
- 15.6 Quality Control – Four-Layer Validation Framework
- 15.7 Limitations & Standard Assumptions
- 15.8 Disclaimer
