
Market Overview
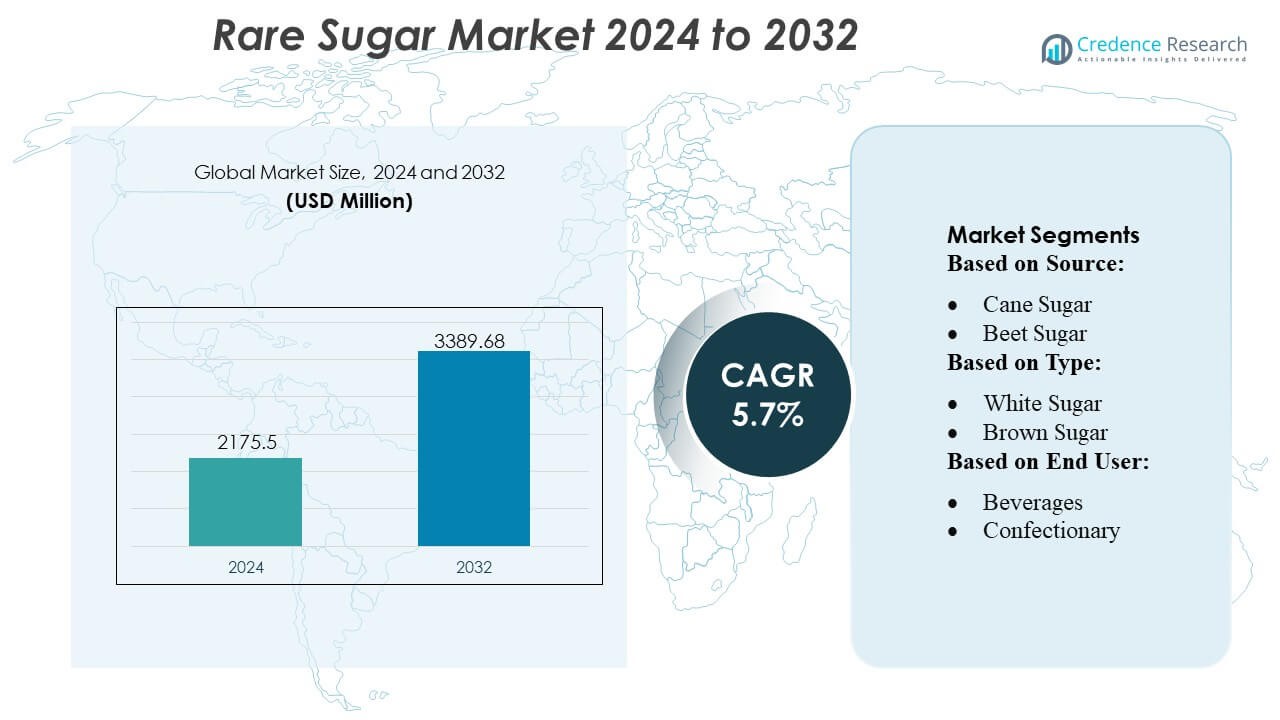
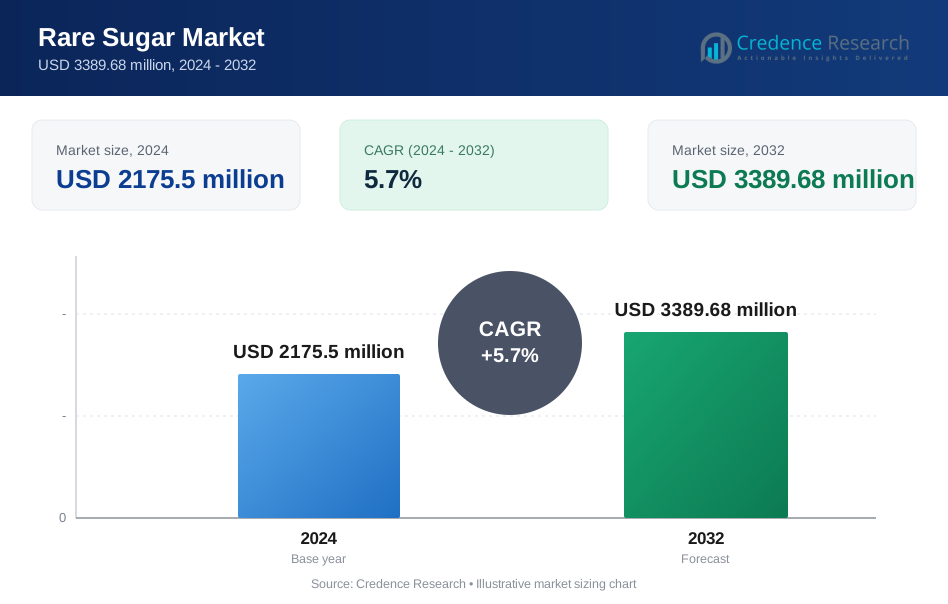
Rare Sugar Market size was valued USD 2175.5 million in 2024 and is anticipated to reach USD 3389.68 million by 2032, at a CAGR of 5.7% during the forecast period.
| REPORT ATTRIBUTE | DETAILS |
|---|---|
| Historical Period | 2020-2023 |
| Base Year | 2024 |
| Forecast Period | 2025-2032 |
| Rare Sugar Market Size 2024 | USD 2175.5 Million |
| Rare Sugar Market, CAGR | 5.7% |
| Rare Sugar Market Size 2032 | USD 3389.68 Million |
The Rare Sugar Market is shaped by globally established ingredient manufacturers that focus on advanced enzymatic conversion, bioprocessing efficiency, and large-scale commercial supply of allulose, tagatose, trehalose, and other specialty sugars. These companies strengthen competitiveness through innovation pipelines, clean-label product development, and partnerships with major food and beverage brands driving sugar-reduction strategies. North America emerges as the leading region with an exact 38% market share, supported by strong regulatory clarity, high adoption of low-calorie sweeteners, and rapid reformulation activity across beverages, bakery, and nutrition categories. Robust production capabilities and continuous R&D investments reinforce the region’s dominant position.
Market Insights
- The Rare Sugar Market reached USD 2175.5 million in 2024 and USD 68 million in 2032 is projected to grow at a 5.7% CAGR reflecting consistent expansion across major food and beverage applications.
- Rising demand for low-calorie and metabolic-friendly sweeteners drives market growth, as manufacturers integrate allulose, tagatose, and trehalose into beverages, bakery, and nutrition products.
- Clean-label trends and enzymatic production innovations shape market advancement, strengthening competitive positioning among ingredient suppliers.
- High production costs and limited large-scale availability restrain rapid adoption, though technological improvements continue to ease constraints.
- North America leads with an exact 38% share, while beverages hold the dominant segment share due to strong use of rare sugars in reformulated low-sugar drink portfolios, reinforcing regional and category-level leadership.
Market Segmentation Analysis:
By Source
Cane sugar holds the dominant position in the Rare Sugar Market with an estimated 65% share, driven by its widespread cultivation, higher sucrose yield, and strong processing infrastructure across tropical regions. Its availability, cost-efficiency, and established supply chains support consistent production volumes, enabling manufacturers to scale specialty and rare sugar derivatives with greater efficiency. Rising consumer preference for naturally derived sweeteners and cleaner-label formulations strengthens demand for cane-based rare sugars, while beet sugar grows steadily due to expanding adoption in temperate regions and improved extraction technologies that enhance purity and functional performance.
- For instance, Nutrinova operates a dedicated, single-purpose manufacturing facility in Germany certified to FSSC 22000 and ISO 9001 standards which produces its flagship high-intensity sweetener Acesulfame potassium (Ace-K) under the brand Sunett.
By Type
White sugar leads the market with an approximate 55% share, supported by its high purity, neutral flavor profile, and suitability for processing rare sugar variants such as allulose, tagatose, and trehalose. Its consistency and ease of refinement make it the preferred input for manufacturers targeting large-scale formulations in beverages, bakery, and functional foods. Brown sugar shows moderate growth due to rising interest in minimally processed sweeteners, while liquid sugar gains traction in industrial applications for its solubility, processing convenience, and compatibility with high-throughput production systems.
- For instance, Ajinomoto Co., Inc. applies its deep expertise in amino-acid fermentation and enzyme technologies developed over more than 100 years of research to produce a full portfolio of 20 amino acids using sugar-derived feedstocks.
By End User
The beverages segment dominates with an estimated 40% share due to increasing adoption of low-calorie and functional sweeteners in sports drinks, ready-to-drink beverages, energy drinks, and flavored waters. Producers leverage rare sugars to reduce calorie content while maintaining sweetness intensity and functional stability. Confectionery and bakery segments follow closely, supported by rare sugars’ browning behavior, moisture retention, and reduced glycemic impact. Dairy products incorporate rare sugars to enhance flavor balance and texture, while other food applications grow as manufacturers explore sugar-reduction strategies across sauces, spreads, and nutritional products.
Key Growth Drivers
Growing Demand for Low-Calorie and Functional Sweeteners
The Rare Sugar Market expands rapidly as consumers seek low-calorie, low-glycemic, and functional sweeteners that support weight management and metabolic health. Rare sugars such as allulose and tagatose deliver sweetness profiles close to sucrose while enabling sugar reduction in beverages, bakery, and dairy products. Food manufacturers adopt these alternatives to meet clean-label expectations and comply with reformulation guidelines. Steady product launches in sports nutrition, flavored waters, and reduced-sugar confectionery strengthen demand and accelerate integration across mainstream food and beverage categories.
- For instance, The NutraSweet Company documents that its neotame molecule delivers a sweetness intensity between 7,000 and 13,000 times that of sucrose, enabling microgram-level inclusion rates in formulations, and its manufacturing specifications confirm a minimum assay purity of 98.0 under FCC requirements parameters that support high-efficiency use in low-calorie and functional product development.
Rising Shift Toward Clean-Label and Naturally Derived Ingredients
Clean-label preferences drive the adoption of rare sugars sourced from natural raw materials such as cane and beet sugar. Consumers show strong interest in sweeteners that offer transparency, minimal processing, and plant-based origins. Rare sugars meet these expectations while providing functional advantages such as improved browning, enhanced texture, and reduced caloric impact. Manufacturers respond by increasing investments in enzymatic conversion and biotransformation technologies to scale natural sugar derivatives. This shift strengthens market positioning across premium and health-focused food segments.
- For instance, Roquette Frères operates its Lestrem bio-refinery, which is publicly documented as the world’s largest polyols production site. The company announced a €25 million investment in the facility in March 2022 to improve efficiency and strengthen its position in the market, though specific annual output figures in metric tons are not publicly disclosed.
Expansion of Food and Beverage Innovation Using Advanced Sugar Alternatives
Innovation in product formulation plays a central role in market acceleration as rare sugars become key ingredients in reformulated and next-generation food products. Brands use allulose, trehalose, and tagatose to enhance sweetness stability, reduce crystallization, and improve mouthfeel without compromising taste. Their compatibility with high-temperature processing enables broader applications in syrups, frozen desserts, and baked goods. Continuous investments in R&D and ingredient optimization fuel adoption in functional foods, where reduced sugar content and metabolic benefits support premium positioning.
Key Trends & Opportunities
Integration of Biotechnological and Enzymatic Production Technologies
Biotechnological advancements shape a significant trend as producers adopt enzymatic conversion, microbial fermentation, and controlled isomerization to manufacture rare sugars efficiently. These methods allow selective transformation of sucrose and fructose into high-value sugar derivatives with superior purity and consistency. Improved process yields reduce production costs and expand scalability, making rare sugars more competitive with traditional sweeteners. The focus on sustainable feedstocks and low-energy pathways enhances long-term market potential and supports regulatory alignment in major food markets.
- For instance, JK Sucralose Inc. reports that its Jiangsu production campus operates a closed-loop chlorination and crystallization system with an annual installed capacity of 1,200 metric tons of sucralose, supported by a multi-stage purification process documented to achieve a minimum assay purity of 98.0 under FCC standards and a residual solvent specification below 0.01 according to its global regulatory submission files.
Growing Applications Across Nutritional and Specialty Food Categories
The market benefits from rising use of rare sugars in nutritional bars, protein beverages, sports supplements, and diabetic-friendly foods. Their favorable metabolic profile and lower caloric contribution make them attractive for health-oriented formulations. Food scientists leverage rare sugars to improve freeze protection, stabilize proteins, and enhance moisture retention, enabling new product formats. This trend creates opportunities for premium positioning, particularly among brands targeting weight management, fitness nutrition, and functional wellness categories.
- For instance, Archer Daniels Midland Company (ADM) operates a massive bioprocessing complex in Decatur, Illinois, which serves as a global hub for corn processing and innovation. This complex houses fermentation capabilities for large-scale production of various bio-products, including ethanol (processing hundreds of thousands of bushels of corn daily for approximately 350 million gallons of ethanol annually) and other ingredients.
Key Challenges
High Production Costs and Limited Commercial-Scale Availability
Production of rare sugars remains constrained due to complex enzymatic pathways, costly catalysts, and limited commercial fermentation capacity. These factors elevate price points compared with conventional sugar and restrict adoption in mass-market categories. Many manufacturers face challenges in achieving consistent yields and purity at industrial scale, slowing downstream integration. The scarcity of large-scale facilities limits supply reliability for global brands, making expansion dependent on continued technological advancements and investment in scalable, cost-efficient processing methods.
Regulatory Uncertainties and Labeling Constraints in Key Markets
Regulatory variations across regions create challenges for manufacturers, particularly regarding health claims, GRAS approvals, and labeling requirements for alternative sweeteners. Differences in permitted usage levels and classification of rare sugars influence formulation strategies and market access. Some rare sugars still face limited recognition in emerging markets, affecting adoption by multinational food companies. These regulatory inconsistencies increase compliance costs and slow multinational rollout, requiring coordinated efforts to secure approvals and harmonize labeling standards to ensure broader market penetration.
Regional Analysis
North America
North America holds a strong 38% share of the Rare Sugar Market, driven by high consumer demand for low-calorie sweeteners, strong adoption of clean-label ingredients, and rapid reformulation activity across beverages and functional foods. Food manufacturers integrate rare sugars such as allulose and tagatose into reduced-sugar products to comply with nutritional guidelines and capitalize on wellness-driven consumption patterns. Supportive regulatory frameworks, rising interest in diabetes-friendly alternatives, and expanded commercial-scale production capacity further enhance regional growth. Strong retail penetration and active product innovation also reinforce North America’s leading position.
Europe
Europe maintains a substantial 28% market share, supported by strict sugar-reduction regulations, rising demand for natural sweeteners, and increasing adoption of rare sugars in bakery, confectionery, and dairy segments. Health-conscious consumers and manufacturers’ focus on clean-label formulations accelerate the shift toward allulose, tagatose, and trehalose. Ongoing reformulation mandates, combined with advancements in enzymatic processing technologies, enhance supply availability within key markets such as Germany, the U.K., and France. Growing investments in specialty ingredients and sustainability-focused production methods strengthen regional competitiveness.
Asia-Pacific
Asia-Pacific accounts for 25% of the market, driven by expanding food and beverage manufacturing, rising disposable income, and growing awareness of low-calorie sweeteners. The region experiences increasing adoption of rare sugars in functional beverages, bakery products, and nutritional supplements, supported by rapid urbanization and evolving dietary preferences. Strong production ecosystems in countries like Japan, South Korea, and China accelerate technological advancements in enzymatic sugar conversion. As major players scale output to meet global demand, Asia-Pacific emerges as a rapidly growing hub for both consumption and manufacturing.
Latin America
Latin America captures an estimated 5% share, supported by expanding use of natural sweeteners in beverages and dairy products, particularly in markets such as Brazil and Mexico. Growing consumer interest in healthier alternatives and rising incidences of diabetes encourage adoption of low-glycemic rare sugars. Local manufacturers steadily incorporate allulose and tagatose into reduced-calorie beverages and confectionery items. However, limited large-scale production infrastructure and price sensitivity temper faster market penetration, keeping growth moderate yet promising as regulatory support and health awareness continue to strengthen.
Middle East & Africa
The Middle East & Africa region holds a 4% share, driven by increasing demand for low-calorie sweeteners in premium beverages, bakery products, and specialty foods. Rising urbanization, growing interest in Western-style diets, and expanding retail distribution channels support the gradual adoption of rare sugars. However, higher import dependence, limited regional production capabilities, and cost barriers constrain rapid uptake. Despite these challenges, rising awareness of metabolic health and the expanding presence of multinational food manufacturers create growth avenues, positioning the region for steady long-term development.
Market Segmentations:
By Source:
- Cane Sugar
- Beet Sugar
By Type:
- White Sugar
- Brown Sugar
By End User:
- Beverages
- Confectionary
By Geography
- North America
- U.S.
- Canada
- Mexico
- Europe
- Germany
- France
- U.K.
- Italy
- Spain
- Rest of Europe
- Asia Pacific
- China
- Japan
- India
- South Korea
- South-east Asia
- Rest of Asia Pacific
- Latin America
- Brazil
- Argentina
- Rest of Latin America
- Middle East & Africa
- GCC Countries
- South Africa
- Rest of the Middle East and Africa
Competitive Landscape
The competitive landscape of the Rare Sugar Market features a diverse group of global ingredient leaders, including GLG Life Tech Corp., Ingredion Incorporated, Cargill, Incorporated, Nutrinova, Ajinomoto Co., The NutraSweet Company, Roquette Frères, JK Sucralose Inc., Archer Daniels Midland Company (ADM), and Tate & Lyle. the Rare Sugar Market is defined by strong innovation, expanding production capacity, and increasing technological investments aimed at improving efficiency and purity in rare sugar manufacturing. Companies focus on enzymatic conversion, microbial fermentation, and advanced bioprocessing methods to scale the production of allulose, tagatose, trehalose, and other specialty sugars that support sugar-reduction strategies across food and beverage applications. The market sees rising collaboration between ingredient manufacturers, research institutions, and food brands to accelerate product development and regulatory approvals. Competition intensifies as firms enhance supply reliability, diversify product portfolios, and target clean-label, low-calorie, and metabolic health segments. This shift toward high-performance, health-aligned sweeteners strengthens competitive differentiation and drives continued market expansion.
Key Player Analysis
- GLG Life Tech Corp.
- Ingredion Incorporated
- Cargill, Incorporated
- Nutrinova
- Ajinomoto Co.
- The NutraSweet Company
- Roquette Frères
- JK Sucralose Inc.
- Archer Daniels Midland Company (ADM)
- Tate & Lyle
Recent Developments
- In November 2024, Samyang Corporation became the first company worldwide to secure approval from Food Standards Australia New Zealand (FSANZ) for its rare sugar sweetener Allulose, allowing it to be officially used as a food ingredient in Australia and New Zealand. Allulose is recognized as a low-calorie sweetener, as it is a rare sugar with 70% of the sweetness of sucrose, yet with nearly zero calories.
- In October 2024, Tate & Lyle and Manus Bio formed a strategic partnership launching "The Natural Sweetener Alliance" to commercially produce all-Americas sourced, bioconverted Reb M stevia, offering a stable, high-quality, natural sugar reduction solution for food & beverage brands, leveraging Manus' bio-manufacturing in Georgia and Tate & Lyle's global reach to meet consumer demand for healthier options.
- In April 2024, Ingredion announced the launch of its new plant‑based sweetening solution called PURECIRCLE Clean Taste Solubility Solution (CTSS), a clean‑label stevia extract that boasts over 100× solubility improvement relative to traditional Reb M stevia.
- In March 2024, Tagatose producer Bonumose and distributor ASR Group have announced that the monosaccharide sweetener has received NutraStrong Prebiotic Verified certification, meeting rigorous prebiotic activity standards set by a third-party verifier.
Report Coverage
The research report offers an in-depth analysis based on Source, Type, End-User and Geography. It details leading market players, providing an overview of their business, product offerings, investments, revenue streams, and key applications. Additionally, the report includes insights into the competitive environment, SWOT analysis, current market trends, as well as the primary drivers and constraints. Furthermore, it discusses various factors that have driven market expansion in recent years. The report also explores market dynamics, regulatory scenarios, and technological advancements that are shaping the industry. It assesses the impact of external factors and global economic changes on market growth. Lastly, it provides strategic recommendations for new entrants and established companies to navigate the complexities of the market.
Future Outlook
- Demand for low-calorie and low-glycemic sweeteners will continue to rise across beverages, bakery, and nutrition products.
- Manufacturers will expand enzymatic and fermentation-based production to improve yield, purity, and scalability.
- Regulatory approvals for rare sugars in additional regions will accelerate commercial adoption.
- Food brands will increase reformulation initiatives to replace conventional sugar with healthier alternatives.
- Clean-label product development will strengthen the shift toward naturally sourced rare sugars.
- Innovation in metabolic health and diabetic-friendly foods will boost rare sugar integration.
- Cost optimization and process efficiency improvements will make rare sugars more competitive with traditional sweeteners.
- Partnerships between ingredient companies and food manufacturers will drive faster product commercialization.
- Growing consumer awareness of functional sweeteners will expand demand in premium and specialty food categories.
- Expansion of production facilities in Asia-Pacific and North America will support global supply stability and market growth.
Request a Free Sample
Fill in your details and we'll send you a free sample report.
- Sample data tables & charts
- Research methodology
Need a Custom Version of This Report?
Tailor the scope, geography, or segments to your exact requirements.
- Custom geography or segment scope
- Direct access to our analyst team
Frequently Asked Questions
What is the current market size for the Rare Sugar Market, and what is its projected size in 2032?
At what Compound Annual Growth Rate is the Rare Sugar Market projected to grow between 2024 and 2032?
Which Rare Sugar Market segment held the largest share in 2024?
What are the primary factors fueling the growth of the Rare Sugar Market?
Who are the leading companies in the Rare Sugar Market?
Which region commanded the largest share of the Rare Sugar Market in 2024?
Table of Content
Chapter 1. Report Introduction
- 1.1 Report Description & Purpose
- 1.1.1 Report Title & Market Definition
- 1.1.2 Unique Selling Propositions (USP) & Key Differentiators
- 1.1.3 Value Proposition for Stakeholders
- 1.2 Research Objectives
- 1.2.1 Market Sizing Objectives (Volume & Revenue)
- 1.2.2 Segmentation Objectives
- 1.2.3 Competitive Intelligence Objectives
- 1.2.4 Forecast & Scenario Objectives
- 1.3 Report Scope
- 1.3.1 Rare Sugar Scope – Types & Subtypes Covered
- 1.3.2 Geographic Scope – Regions & Countries Covered
- 1.3.3 Historical Period, Base Year & Forecast Period (2024; forecast to 2032)
- 1.3.4 Inclusions & Exclusions
- 1.4 HS Code & Classification Framework
- 1.5 Currency, Units & Pricing Basis
- 1.6 Target Stakeholders
- 1.7 Limitations & Assumptions
Chapter 2. Executive Summary
- 2.1 Global Rare Sugar Market Snapshot
- 2.1.1 Market Size – Historical (2024) & Forecast (2024-2032) (2024: USD 2175.5 million → 2032: USD 3389.68 million)
- 2.1.2 Volume & Revenue – Global Totals
- 2.1.3 Key Market Highlights – Top Five Facts
- 2.2 Rare Sugar Market Segmentation Snapshot
- 2.2.1 Market Split by Region – 2024 vs. 2032
- 2.3 Competitive Snapshot
- 2.3.1 Top 10 Players by Revenue Share – 2024
- 2.3.2 Top 10 Players by Volume Share – 2024
- 2.3.3 Recent Strategic Developments (18-Month Summary)
- 2.4 Key Investment Highlights & Strategic Conclusions
Chapter 3. Rare Sugar Market Dynamics & Industry Analysis
- 3.1 Market Overview & Context
- 3.1.1 Rare Sugar Market Position in the Broader Automotive Value Chain
- 3.1.2 OEM vs. Replacement Market Dynamics
- 3.1.3 Market Maturity & Development Stage by Region
- 3.2 Rare Sugar Market Drivers
- 3.3 Rare Sugar Market Restraints & Challenges
- 3.4 Rare Sugar Market Opportunities
- 3.5 Porter's Five Forces Analysis
- 3.5.1 Threat of New Entrants
- 3.5.2 Bargaining Power of Suppliers
- 3.5.3 Bargaining Power of Buyers
- 3.5.4 Threat of Substitutes
- 3.5.5 Competitive Rivalry – Intensity Assessment
- 3.6 Rare Sugar Value Chain Analysis
- 3.6.1 Upstream – Raw Material/Input Suppliers
- 3.6.1.1 Raw Material/Input 1
- 3.6.1.2 Raw Material/Input 2
- 3.6.1.3 Raw Material/Input 3
- 3.6.2 Midstream – Production/Manufacturing/Service Delivery
- 3.6.2.1 Production/Process Overview
- 3.6.2.2 Key Facility Locations & Capacity by Manufacturer
- 3.6.3 Downstream – Distribution & End Consumer
- 3.6.3.1 Primary Channel – B2B/OEM
- 3.6.3.2 Secondary Channels – Dealer, Retail, Online, Direct
- 3.6.4 Value Chain Profitability Analysis
- 3.6.1 Upstream – Raw Material/Input Suppliers
- 3.7 PESTEL Analysis
- 3.7.1 Political Factors
- 3.7.2 Economic Factors
- 3.7.3 Social Factors
- 3.7.4 Technological Factors
- 3.7.5 Environmental Factors
- 3.7.6 Legal Factors
- 3.8 Rare Sugar Supply Chain Analysis
- 3.8.1 Raw Material/Input Supply Risk Assessment
- 3.8.2 Manufacturing Concentration Risk (Geographic Exposure)
- 3.8.3 Trade Disruption Impact Analysis
- 3.9 Regulatory & Policy Landscape
Note: The regulatory and policy landscape section covers regulations based on their applicability to the market, Rare Sugar category, geography, and scope of the study. Only regulatory frameworks with a material impact on operations, compliance, trade, sustainability, or market access are analyzed in detail.
Chapter 4. Key Investment Pockets & Opportunity Analysis
- 4.1 Rare Sugar Market Attractiveness Analysis
- 4.1.1 By Region – Investment Attractiveness Matrix (Volume × CAGR)
- 4.2 Absolute Revenue Growth Opportunity
- 4.2.1 By Region – Absolute USD Growth Through 2032
- 4.3 Incremental Volume Opportunity
- 4.3.1 By Region – Incremental Volume Through 2032
- 4.3.2 Segment – Incremental Volume
- 4.4 Emerging Submarket Opportunity Deep Dive (Subject to Applicability)
- 4.5 Emerging Market Opportunity Scorecards
- 4.5.1 United States
- 4.5.2 Europe
- 4.5.3 Asia
- 4.5.4 Middle East & Africa
Note: Emerging Market Opportunity Scorecards will be included based on relevance and strategic importance. Regions listed are indicative and may vary depending on data availability and market dynamics.
Chapter 5. Rare Sugar Import-Export Analysis & Trade Flows
- 5.1 Global Trade Overview
- 5.1.1 Global Export Value by Country (2024)
- 5.1.2 Global Export Volume by Country (2024)
- 5.1.3 Global Import Value by Country (2024)
- 5.1.4 Global Import Volume by Country (2024)
- 5.1.5 Net Trade Balance by Country (2024)
- 5.2 Export Analysis – Segment
- 5.2.1 Type 1 (HS Code)
- 5.2.2 Type 2 (HS Code)
- 5.2.3 Type 3 (HS Code)
- 5.2.4 Type 4 (HS Code)
- 5.2.5 Type 5 (HS Code)
- 5.3 Import Analysis – Segment
- 5.3.1 Type 1 (HS Code)
- 5.3.2 Type 2 (HS Code)
- 5.3.3 Type 3 (HS Code)
- 5.3.4 Type 4 (HS Code)
- 5.3.5 Type 5 (HS Code)
- 5.4 Average Unit Trade Prices
- 5.4.1 Average Export Price – Segment & Country
- 5.4.2 Average Import Price – Segment & Source Country
- 5.4.3 Price Trends (2024)
- 5.5 Key Trade Route Analysis
- 5.5.1 Trade Route 1
- 5.5.2 Trade Route 2
- 5.5.3 Trade Route 3
- 5.5.4 Trade Route 4
- 5.5.5 Trade Route 5
- 5.6 Trade Policy Impact Assessment
- 5.6.1 US Anti-Dumping & Section 301 Tariffs
- 5.6.2 EU Customs Union Impact
- 5.6.3 Major Free Trade Agreements
- 5.6.4 USMCA Rules of Origin
Note: Trade policy analysis will be included only where relevant to the Rare Sugar market.
Chapter 6. Competitive Landscape & Company Benchmarking
- 6.1 Rare Sugar Market Concentration & Structure
- 6.1.1 Herfindahl-Hirschman Index (HHI) – vs. 2024
- 6.1.2 Tier 1, Tier 2 & Tier 3 Market Structure
- 6.1.3 Global, Regional & Local Player Dynamics
- 6.2 Rare Sugar Market Share Analysis – 2024
- 6.2.1 Global Revenue Share by Company
- 6.2.2 Global Volume Share by Company
- 6.2.3 Regional Revenue Share
- 6.2.4 Market Share Evolution ( vs. 2024)
- 6.2.5 OEM Segment Share by Company
- 6.2.6 Replacement Segment Share by Company
- 6.3 Production/Delivery Capacity & Facility Analysis
- 6.3.1 Global Installed Capacity
- 6.3.2 Capacity Utilization Rates
- 6.3.3 Production/Output Volume
- 6.3.4 Facility Locations & Capacity Map
- 6.3.5 Planned Capacity Additions
- 6.4 Rare Sugar Competitive Benchmarking Matrix
- 6.4.1 Revenue, Volume, CAGR & Profitability Comparison
- 6.4.2 Channel Revenue Mix
- 6.4.3 Geographic Revenue Exposure
- 6.4.4 R&D Intensity
- 6.4.5 Sustainability Maturity
- 6.5 Strategic Developments in Rare Sugar (Last 24 Months)
- 6.5.1 Mergers, Acquisitions & Divestments
- 6.5.2 New Rare Sugar Launches
- 6.5.3 Facility Expansions
- 6.5.4 Strategic Alliances, Joint Ventures & Partnerships
- 6.5.5 Distribution Expansion & Market Entry
- 6.5.6 Sustainability & ESG Initiatives
- 6.6 Competitive Strategy Mapping
- 6.6.1 Leader, Challenger, Follower & Niche Classification
- 6.6.2 Pricing Strategy Comparison
- 6.6.3 Channel Strategy Matrix
Note: Strategic developments are included based on their materiality and the availability of reliable information.
Chapter 7. Global Rare Sugar Market – By Distribution Channel
- 7.1 Segment Overview
- 7.1.1 Volume & Revenue Split by Channel (2024 & 2032)
- 7.1.2 Channel Mix Evolution (2024-2032)
Chapter 8. Regional Market Analysis – Global Overview
- 8.1 Global Regional Overview
- 8.1.1 Regional Volume Share
- 8.1.2 Regional Revenue Share
- 8.1.3 Regional Volume by Region
- 8.1.4 Regional Revenue by Region
- 8.1.5 Regional Forecast Through 2032
- 8.2 Cross-Regional Segment Analysis
- 8.2.1 By Distribution Channel
- 8.2.2 By Brand/Price Tier
Chapter 9. North America Rare Sugar Market
- 9.1 United States
- 9.2 Canada
- 9.3 Mexico
Chapter 10. Europe Rare Sugar Market
- 10.1 Germany
- 10.2 France
- 10.3 Italy
- 10.4 United Kingdom
- 10.5 Spain
- 10.6 Poland
- 10.7 Russia
- 10.8 Netherlands
- 10.9 Belgium
- 10.10 Sweden
- 10.11 Denmark
- 10.12 Norway
- 10.13 Rest of Europe
Chapter 11. Asia Pacific Rare Sugar Market
- 11.1 China
- 11.2 India
- 11.3 Japan
- 11.4 South Korea
- 11.5 Thailand
- 11.6 Indonesia
- 11.7 Vietnam
- 11.8 Malaysia
- 11.9 Australia
- 11.10 Rest of Asia Pacific
Chapter 12. Latin America Rare Sugar Market
- 12.1 Brazil
- 12.2 Argentina
- 12.3 Colombia
- 12.4 Chile
- 12.5 Rest of Latin America
Chapter 13. Middle East Rare Sugar Market
- 13.1 Saudi Arabia
- 13.2 United Arab Emirates
- 13.3 Turkey
- 13.4 Israel
- 13.5 Iran
- 13.6 Rest of the Middle East
Chapter 14. Africa Rare Sugar Market
- 14.1 South Africa
- 14.2 Egypt
- 14.3 Nigeria
- 14.4 Morocco
- 14.5 Rest of Africa
Chapter 15. Rare Sugar Company Profiles
- 15.1 [Company 01]
- 15.1.1 Company Overview
- 15.1.2 Key Management Personnel
- 15.1.3 Products & Services Portfolio
- 15.1.4 Financial Performance
- 15.1.5 Key Market Focus & Geographic Presence
- 15.1.6 Recent Developments & Strategic Initiatives
Note: The company profile list is preliminary and may change based on research findings, market developments, data availability, and client requirements.
Chapter 16. Appendices
- Appendix A – List of Abbreviations & Acronyms
- Appendix B – Industry Classification Code Reference – Full Series
- Appendix C – Production & Capacity Data Tables
- Appendix D – End-Use & Demand Base Tables
- Appendix E – Consumption & Replacement Rate Assumptions
- Appendix F – ASP Reference Tables
- Appendix G – Manufacturing & Facility Database
- Appendix H – Import-Export Data Tables
- Appendix I – Regulatory Summary Tables
- Appendix J – Primary Research Participant List (Anonymized)
- Appendix K – Primary Research Questionnaire Framework
- Appendix L – Data Sources & Bibliography
- Appendix M – Market Size Divergence & Source Comparison
Chapter 17. Research Methodology
- 17.1 Research Framework & Philosophy
- 17.2 Secondary Research – Sources, Hierarchy & Data Extraction
- 17.3 Data Modeling – Bottom-Up & Top-Down Market Sizing
- 17.4 Primary Research – Stakeholder Framework, LOI & Sample Sizes
- 17.5 Forecast Methodology – Regression, Scenario & Sensitivity Analysis
- 17.6 Quality Control – Four-Layer Validation Framework
- 17.7 Limitations & Standard Assumptions
- 17.8 Disclaimer
