CHAPTER NO. 1 : INTRODUCTION 26
1.1. Report Description 26
1.1.1. Purpose of the Report 26
1.1.2. USP & Key Offerings 26
1.2. Key Benefits for Stakeholders 26
1.3. Target Audience 27
1.4. Report Scope 28
CHAPTER NO. 2 : EXECUTIVE SUMMARY 30
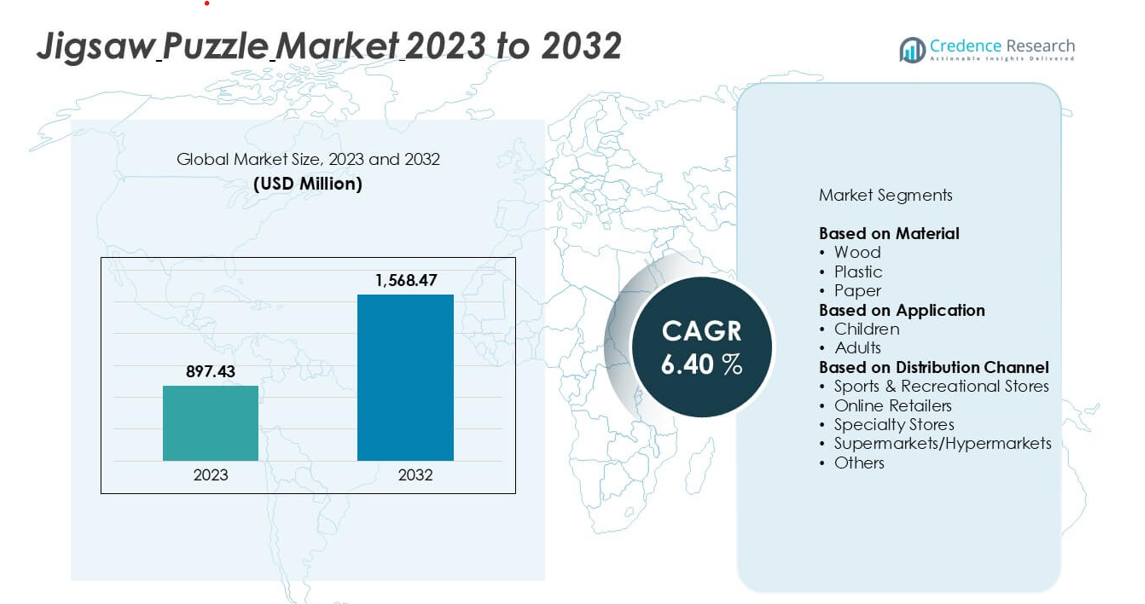
2.1. Jigsaw Puzzle Market Snapshot 30
2.2. Global Jigsaw Puzzle Market, 2018 – 2032 (K Units) (USD Million) 32
2.1. Insights from Primary Respondents 32
CHAPTER NO. 3 : GEOPOLITICAL CRISIS IMPACT ANALYSIS 33
3.1. Russia-Ukraine and Israel-Palestine War Impacts 33
3.1.1. Uncertainty and economic instability 33
3.1.2. Supply chain disruptions 33
3.1.3. Regional market shifts 33
3.1.4. Shift in government priorities 33
CHAPTER NO. 4 : JIGSAW PUZZLE MARKET – INDUSTRY ANALYSIS 34
4.1. Introduction 34
4.2. Market Drivers 35
4.2.1. Driving Factor 1 Analysis 35
4.2.2. Driving Factor 2 Analysis 36
4.3. Market Restraints 37
4.3.1. Restraining Factor Analysis 37
4.4. Market Opportunities 38
4.4.1. Market Opportunity Analysis 38
4.5. Porter’s Five Forces Analysis 39
4.6. Value Chain Analysis 40
4.7. Buying Criteria 41
CHAPTER NO. 5 : IMPORT EXPORT ANALYSIS 42
5.1. Import Analysis by Region 42
5.1.1. Global Jigsaw Puzzle Market Import Volume/Revenue, By Region, 2018 – 2023 42
5.2. Export Analysis by Region 43
5.2.1. Global Jigsaw Puzzle Market Export Volume/Revenue, By Region, 2018 – 2023 43
CHAPTER NO. 6 : DEMAND SUPPLY ANALYSIS 44
6.1. Demand Analysis by Region 44
6.1.1. Global Jigsaw Puzzle Market Demand Volume/Revenue, By Region, 2018 – 2023 44
6.2. Supply Analysis by Region 45
6.2.1. Global Jigsaw Puzzle Market Supply Volume/Revenue, By Region, 2018 – 2023 45
CHAPTER NO. 7 : PRODUCTION ANALYSIS 46
7.1. Production Analysis by Region 46
7.1.1. Global Jigsaw Puzzle Market Production, By Region, 2018 – 2023 46
7.1.2. Global Jigsaw Puzzle Market Production Volume, By Region, 2018 – 2023 (K Units) 46
CHAPTER NO. 8 : PRICE ANALYSIS 47
8.1. Price Analysis by Region 47
8.1.1. Global Jigsaw Puzzle Market Price, By Region, 2018 – 2023 47
8.1.2. Global Material Market Price, By Region, 2018 – 2023 47
8.2. Price Analysis by Material 48
8.2.1. Global Jigsaw Puzzle Market Price, By Material, 2018 – 2023 48
8.2.2. Global Material Market Price, By Material, 2018 – 2023 48
CHAPTER NO. 9 : RAW MATERIALS ANALYSIS 49
9.1. Key Raw Materials and Suppliers 49
9.2. Key Raw Materials Price Trend 49
CHAPTER NO. 10 : MANUFACTURING COST ANALYSIS 50
10.1. Manufacturing Cost Analysis 50
10.1.1. Manufacturing Cost Analysis 50
10.2. Manufacturing Process 50
10.2.1. Manufacturing Process 50
CHAPTER NO. 11 : ANALYSIS COMPETITIVE LANDSCAPE 51
11.1. Company Market Share Analysis – 2023 51
11.1.1. Global Jigsaw Puzzle Market: Company Market Share, by Volume, 2023 51
11.1.2. Global Jigsaw Puzzle Market: Company Market Share, by Revenue, 2023 51
11.1.3. Global Jigsaw Puzzle Market: Top 6 Company Market Share, by Revenue, 2023 52
11.1.4. Global Jigsaw Puzzle Market: Top 3 Company Market Share, by Revenue, 2023 52
11.1. Global Jigsaw Puzzle Market Company Volume Market Share, 2023 53
11.2. Global Jigsaw Puzzle Market Company Revenue Market Share, 2023 54
11.3. Company Assessment Metrics, 2022 55
11.3.1. Stars 55
11.3.2. Emerging Leaders 55
11.3.3. Pervasive Players 55
11.3.4. Participants 55
11.4. Start-ups /SMEs Assessment Metrics, 2022 55
11.4.1. Progressive Companies 55
11.4.2. Responsive Companies 55
11.4.3. Dynamic Companies 55
11.4.4. Starting Blocks 55
11.5. Strategic Developments 56
11.5.1. Acquisitions & Mergers 56
11.5.2. New Product Launch 56
11.5.3. Regional Expansion 56
11.6. Key Players Product Matrix 57
CHAPTER NO. 12 : PESTEL & ADJACENT MARKET ANALYSIS 58
12.1. PESTEL 58
12.1.1. Political Factors 58
12.1.2. Economic Factors 58
12.1.3. Social Factors 58
12.1.4. Technological Factors 58
12.1.5. Environmental Factors 58
12.1.6. Legal Factors 58
12.2. Adjacent Market Analysis 58
CHAPTER NO. 13 : JIGSAW PUZZLE MARKET – BY MATERIAL SEGMENT ANALYSIS 59
13.1. Jigsaw Puzzle Market Overview, by Material Segment 59
13.1.1. Jigsaw Puzzle Market Volume Share, By Material, 2023 & 2032 60
13.1.2. Jigsaw Puzzle Market Revenue Share, By Material, 2023 & 2032 60
13.1.3. Jigsaw Puzzle Market Attractiveness Analysis, By Material 61
13.1.4. Incremental Revenue Growth Opportunity, by Material, 2024 – 2032 61
13.1.5. Jigsaw Puzzle Market Revenue, By Material, 2018, 2023, 2027 & 2032 62
13.2. Wood Materials 63
13.2.1. Global Wood Materials Jigsaw Puzzle Market Volume & Revenue, By Region, 2018 – 2023 (K Units) (USD Million) 64
13.2.2. Global Wood Materials Jigsaw Puzzle Market Volume & Revenue, By Region, 2024 – 2032 (K Units) (USD Million) 64
13.3. Plastic Materials 65
13.3.1. Global Plastic Materials Jigsaw Puzzle Market Volume & Revenue, By Region, 2018 – 2023 (K Units) (USD Million) 66
13.3.2. Global Plastic Materials Jigsaw Puzzle Market Volume & Revenue, By Region, 2024 – 2032 (K Units) (USD Million) 66
13.4. Paper Materials 67
13.4.1. Global Paper Materials Jigsaw Puzzle Market Volume & Revenue, By Region, 2018 – 2023 (K Units) (USD Million) 68
13.4.2. Global Paper Materials Jigsaw Puzzle Market Volume & Revenue, By Region, 2024 – 2032 (K Units) (USD Million) 68
CHAPTER NO. 14 : JIGSAW PUZZLE MARKET – BY APPLICATION SEGMENT ANALYSIS 69
14.1. Jigsaw Puzzle Market Overview, by Application Segment 69
14.1.1. Jigsaw Puzzle Market Volume Share, By Application, 2023 & 2032 70
14.1.2. Jigsaw Puzzle Market Revenue Share, By Application, 2023 & 2032 70
14.1.3. Jigsaw Puzzle Market Attractiveness Analysis, By Application 71
14.1.4. Incremental Revenue Growth Opportunity, by Application, 2024 – 2032 71
14.1.5. Jigsaw Puzzle Market Revenue, By Application, 2018, 2023, 2027 & 2032 72
14.2. Children 73
14.2.1. Global Children Jigsaw Puzzle Market Volume & Revenue, By Region, 2018 – 2023 (K Units) (USD Million) 74
14.2.2. Global Children Jigsaw Puzzle Market Volume & Revenue, By Region, 2024 – 2032 (K Units) (USD Million) 74
14.3. Adults 75
14.3.1. Global Adults Jigsaw Puzzle Market Volume & Revenue, By Region, 2018 – 2023 (K Units) (USD Million) 76
14.3.2. Global Adults Jigsaw Puzzle Market Volume & Revenue, By Region, 2024 – 2032 (K Units) (USD Million) 76
CHAPTER NO. 15 : JIGSAW PUZZLE MARKET – BY DISTRIBUTION CHANNEL SEGMENT ANALYSIS 77
15.1. Jigsaw Puzzle Market Overview, by Distribution Channel Segment 77
15.1.1. Jigsaw Puzzle Market Volume Share, By Distribution Channel, 2023 & 2032 78
15.1.2. Jigsaw Puzzle Market Revenue Share, By Distribution Channel, 2023 & 2032 78
15.1.3. Jigsaw Puzzle Market Attractiveness Analysis, By Distribution Channel 79
15.1.4. Incremental Revenue Growth Opportunity, by Distribution Channel, 2024 – 2032 79
15.1.5. Jigsaw Puzzle Market Revenue, By Distribution Channel, 2018, 2023, 2027 & 2032 80
15.2. Sports & Recreational Stores 81
15.2.1. Global Sports & Recreational Stores Jigsaw Puzzle Market Volume & Revenue, By Region, 2018 – 2023 (K Units) (USD Million) 82
15.2.2. Global Sports & Recreational Stores Jigsaw Puzzle Market Volume & Revenue, By Region, 2024 – 2032 (K Units) (USD Million) 82
15.3. Online Retailers 83
15.3.1. Global Online Retailers Jigsaw Puzzle Market Volume & Revenue, By Region, 2018 – 2023 (K Units) (USD Million) 84
15.3.2. Global Online Retailers Jigsaw Puzzle Market Volume & Revenue, By Region, 2024 – 2032 (K Units) (USD Million) 84
15.4. Specialty Stores 85
15.4.1. Global Specialty Stores Jigsaw Puzzle Market Volume & Revenue, By Region, 2018 – 2023 (K Units) (USD Million) 86
15.4.2. Global Specialty Stores Jigsaw Puzzle Market Volume & Revenue, By Region, 2024 – 2032 (K Units) (USD Million) 86
15.5. Supermarkets/ Hypermarkets 87
15.5.1. Global Supermarkets/ Hypermarkets Jigsaw Puzzle Market Volume & Revenue, By Region, 2018 – 2023 (K Units) (USD Million) 88
15.5.2. Global Supermarkets/ Hypermarkets Jigsaw Puzzle Market Volume & Revenue, By Region, 2024 – 2032 (K Units) (USD Million) 88
15.6. Others 89
15.6.1. Global Others Jigsaw Puzzle Market Volume & Revenue, By Region, 2018 – 2023 (K Units) (USD Million) 90
15.6.2. Global Others Jigsaw Puzzle Market Volume & Revenue, By Region, 2024 – 2032 (K Units) (USD Million) 90
CHAPTER NO. 16 : JIGSAW PUZZLE MARKET – REGIONAL ANALYSIS 91
16.1. Jigsaw Puzzle Market Overview, by Regional Segments 91
16.2. Region 92
16.2.1. Global Jigsaw Puzzle Market Volume Share, By Region, 2023 & 2032 92
16.2.2. Global Jigsaw Puzzle Market Revenue Share, By Region, 2023 & 2032 92
16.2.3. Jigsaw Puzzle Market Attractiveness Analysis, By Region 93
16.2.4. Incremental Revenue Growth Opportunity, by Region, 2024 – 2032 93
16.2.5. Jigsaw Puzzle Market Revenue, By Region, 2018, 2023, 2027 & 2032 94
16.2.6. Global Jigsaw Puzzle Market Volume & Revenue, By Region, 2018 – 2023 (K Units) (USD Million) 95
16.2.7. Global Jigsaw Puzzle Market Volume & Revenue, By Region, 2024 – 2032 (K Units) (USD Million) 95
16.3. Material 96
16.3.1. Global Jigsaw Puzzle Market Volume & Revenue, By Material, 2018 – 2023 (K Units) (USD Million) 96
16.3.2. Global Jigsaw Puzzle Market Volume & Revenue, By Material, 2024 – 2032 (K Units) (USD Million) 96
16.4. Application 97
16.4.1. Global Jigsaw Puzzle Market Volume & Revenue, By Application, 2018 – 2023 (K Units) (USD Million) 97
16.4.2. Global Jigsaw Puzzle Market Volume & Revenue, By Application, 2024 – 2032 (K Units) (USD Million) 97
16.5. Distribution Channel 98
16.5.1. Global Jigsaw Puzzle Market Volume & Revenue, By Distribution Channel, 2018 – 2023 (K Units) (USD Million) 98
16.5.2. Global Jigsaw Puzzle Market Volume & Revenue, By Distribution Channel, 2024 – 2032 (K Units) (USD Million) 98
CHAPTER NO. 17 : JIGSAW PUZZLE MARKET – NORTH AMERICA 99
17.1. North America 99
17.1. Key Highlights 99
17.1.1. North America Jigsaw Puzzle Market Volume, By Country, 2018 – 2032 (K Units) 100
17.1.2. North America Jigsaw Puzzle Market Revenue, By Country, 2018 – 2023 (USD Million) 101
17.1.3. North America Jigsaw Puzzle Market Volume, By Material, 2018 – 2023 (K Units) 102
17.1.4. North America Jigsaw Puzzle Market Revenue, By Material, 2018 – 2023 (USD Million) 103
17.1.5. North America Jigsaw Puzzle Market Volume, By Application, 2018 – 2023 (K Units) 104
17.1.6. North America Jigsaw Puzzle Market Revenue, By Application, 2018 – 2023 (USD Million) 105
17.1.7. North America Jigsaw Puzzle Market Volume, By Distribution Channel, 2018 – 2023 (K Units) 106
17.1.8. North America Jigsaw Puzzle Market Revenue, By Distribution Channel, 2018 – 2023 (USD Million) 107
17.1.9. U.S. 108
17.1.10. Canada 108
17.1.11. Mexico 108
CHAPTER NO. 18 : JIGSAW PUZZLE MARKET – EUROPE 109
18.1. Europe 109
18.2. Key Highlights 109
18.2.1. Europe Jigsaw Puzzle Market Volume, By Country, 2018 – 2023 (K Units) 110
18.2.2. Europe Jigsaw Puzzle Market Revenue, By Country, 2018 – 2023 (USD Million) 111
18.2.3. Europe Jigsaw Puzzle Market Volume, By Material, 2018 – 2023 (K Units) 112
18.2.4. Europe Jigsaw Puzzle Market Revenue, By Material, 2018 – 2023 (USD Million) 113
18.2.5. Europe Jigsaw Puzzle Market Volume, By Application, 2018 – 2023 (K Units) 114
18.2.6. Europe Jigsaw Puzzle Market Revenue, By Application, 2018 – 2023 (USD Million) 115
18.2.7. Europe Jigsaw Puzzle Market Volume, By Distribution Channel, 2018 – 2023 (K Units) 116
18.2.8. Europe Jigsaw Puzzle Market Revenue, By Distribution Channel, 2018 – 2023 (USD Million) 117
18.2.9. UK 118
18.2.10. France 118
18.2.11. Germany 118
18.2.12. Italy 118
18.2.13. Spain 118
18.2.14. Russia 118
18.2.15. BENELUX 118
18.2.16. Sweden 118
18.2.17. Denmark 118
18.2.18. Poland 118
18.2.19. Austria 118
18.2.20. Rest of Europe 118
CHAPTER NO. 19 : JIGSAW PUZZLE MARKET – ASIA PACIFIC 119
19.1. Asia Pacific 119
19.2. Key Highlights 119
19.2.1. Asia Pacific Jigsaw Puzzle Market Volume, By Country, 2018 – 2023 (K Units) 120
19.2.2. Asia Pacific Jigsaw Puzzle Market Revenue, By Country, 2018 – 2023 (USD Million) 121
19.2.3. Asia Pacific Jigsaw Puzzle Market Volume, By Material, 2018 – 2023 (K Units) 122
19.2.4. Asia Pacific Jigsaw Puzzle Market Revenue, By Material, 2018 – 2023 (USD Million) 123
19.2.5. Asia Pacific Jigsaw Puzzle Market Volume, By Application, 2018 – 2023 (K Units) 124
19.2.6. Asia Pacific Jigsaw Puzzle Market Revenue, By Application, 2018 – 2023 (USD Million) 125
19.2.7. Asia Pacific Jigsaw Puzzle Market Volume, By Distribution Channel, 2018 – 2023 (K Units) 126
19.2.8. Asia Pacific Jigsaw Puzzle Market Revenue, By Distribution Channel, 2018 – 2023 (USD Million) 127
19.2.9. China 128
19.2.10. Japan 128
19.2.11. South Korea 128
19.2.12. India 128
19.2.13. Thailand 128
19.2.14. Indonesia 128
19.2.15. Vietnam 128
19.2.16. Malaysia 128
19.2.17. Philippines 128
19.2.18. Taiwan 128
19.2.19. Rest of Asia Pacific 128
CHAPTER NO. 20 : JIGSAW PUZZLE MARKET – LATIN AMERICA 129
20.1. Latin America 129
20.2. Key Highlights 129
20.2.1. Latin America Jigsaw Puzzle Market Volume, By Country, 2018 – 2023 (K Units) 130
20.2.2. Latin America Jigsaw Puzzle Market Revenue, By Country, 2018 – 2023 (USD Million) 131
20.2.3. Latin America Jigsaw Puzzle Market Volume, By Material, 2018 – 2023 (K Units) 132
20.2.4. Latin America Jigsaw Puzzle Market Revenue, By Material, 2018 – 2023 (USD Million) 133
20.2.5. Latin America Jigsaw Puzzle Market Volume, By Application, 2018 – 2023 (K Units) 134
20.2.6. Latin America Jigsaw Puzzle Market Revenue, By Application, 2018 – 2023 (USD Million) 135
20.2.7. Latin America Jigsaw Puzzle Market Volume, By Distribution Channel, 2018 – 2023 (K Units) 136
20.2.8. Latin America Jigsaw Puzzle Market Revenue, By Distribution Channel, 2018 – 2023 (USD Million) 137
20.2.9. Brazil 138
20.2.10. Argentina 138
20.2.11. Colombia 138
20.2.12. Chile 138
20.2.13. Peru 138
20.2.14. Rest of Latin America 138
CHAPTER NO. 21 : JIGSAW PUZZLE MARKET – MIDDLE EAST 139
21.1. The Middle-East 139
21.2. Key Highlights 139
21.2.1. Middle East Jigsaw Puzzle Market Volume, By Country, 2018 – 2023 (K Units) 140
21.2.2. Middle East Jigsaw Puzzle Market Revenue, By Country, 2018 – 2023 (USD Million) 141
21.2.3. Middle East Jigsaw Puzzle Market Volume, By Material, 2018 – 2023 (K Units) 142
21.2.4. Middle East Jigsaw Puzzle Market Revenue, By Material, 2018 – 2023 (USD Million) 143
21.2.5. Middle East Jigsaw Puzzle Market Volume, By Application, 2018 – 2023 (K Units) 144
21.2.6. Middle East Jigsaw Puzzle Market Revenue, By Application, 2018 – 2023 (USD Million) 145
21.2.7. Middle East Jigsaw Puzzle Market Volume, By Distribution Channel, 2018 – 2023 (K Units) 146
21.2.8. Middle East Jigsaw Puzzle Market Revenue, By Distribution Channel, 2018 – 2023 (USD Million) 147
21.2.9. GCC Countries 148
21.2.10. Israel 148
21.2.11. Turkey 148
21.2.12. Iran 148
21.2.13. Rest of Middle East & Africa 148
CHAPTER NO. 22 : JIGSAW PUZZLE MARKET – AFRICA 149
22.1. Africa 149
22.2. Key Highlights 149
22.2.1. Africa Jigsaw Puzzle Market Volume, By Country, 2018 – 2023 (K Units) 150
22.2.2. Africa Jigsaw Puzzle Market Revenue, By Country, 2018 – 2023 (USD Million) 151
22.2.3. Africa Jigsaw Puzzle Market Volume, By Material, 2018 – 2023 (K Units) 152
22.2.4. Africa Jigsaw Puzzle Market Revenue, By Material, 2018 – 2023 (USD Million) 153
22.2.5. Africa Jigsaw Puzzle Market Volume, By Application, 2018 – 2023 (K Units) 154
22.2.6. Africa Jigsaw Puzzle Market Revenue, By Application, 2018 – 2023 (USD Million) 155
22.2.7. Africa Jigsaw Puzzle Market Volume, By Distribution Channel, 2018 – 2023 (K Units) 156
22.2.8. Africa Jigsaw Puzzle Market Revenue, By Distribution Channel, 2018 – 2023 (USD Million) 157
22.2.9. South Africa 158
22.2.10. Egypt 158
22.2.11. Nigeria 158
22.2.12. Algeria 158
22.2.13. Morocco 158
22.2.14. Rest of Africa 158
CHAPTER NO. 23 : COMPANY PROFILES 159
23.1. Springbok Puzzles 159
23.1.1. Company Overview 159
23.1.2. Product Portfolio 159
23.1.3. Swot Analysis 159
23.1.4. Business Strategy 160
23.1.5. Financial Overview 160
23.2. Educa Borras 161
23.3. Robotime 161
23.4. Disney 161
23.5. Artifact Puzzles 161
23.6. Schmidt Spiele 161
23.7. Cobble Hill 161
23.8. CubicFun 161
23.9. Ravensburger 161
23.10. Tenyo 161
23.11. White Mountain Puzzles 161
23.12. Buffalo Games 161
23.13. Castorland 161
23.14. Hape 161
23.15. Anatolian 161
23.16. House of Puzzles 161
23.17. Piatnik 161
CHAPTER NO. 24 : RESEARCH METHODOLOGY 162
24.1. Research Methodology 162
24.2. Phase I – Secondary Research 163
24.3. Phase II – Data Modeling 163
24.3.1. Company Share Analysis Model 164
24.3.2. Revenue Based Modeling 164
24.4. Phase III – Primary Research 165
24.5. Research Limitations 166
24.5.1. Assumptions 166
List of Figures
FIG NO. 1. Global Jigsaw Puzzle Market Volume & Revenue, 2018 – 2032 (K Units) (USD Million) 32
FIG NO. 2. Porter’s Five Forces Analysis for Global Jigsaw Puzzle Market 39
FIG NO. 3. Value Chain Analysis for Global Jigsaw Puzzle Market 40
FIG NO. 4. Global Jigsaw Puzzle Market Import Volume/Revenue, By Region, 2018 – 2023 42
FIG NO. 5. Global Jigsaw Puzzle Market Export Volume/Revenue, By Region, 2018 – 2023 43
FIG NO. 6. Global Jigsaw Puzzle Market Demand Volume/Revenue, By Region, 2018 – 2023 44
FIG NO. 7. Global Jigsaw Puzzle Market Supply Volume/Revenue, By Region, 2018 – 2023 45
FIG NO. 8. Global Jigsaw Puzzle Market Production, By Region, 2018 – 2023 46
FIG NO. 9. Global Jigsaw Puzzle Market Price, By Region, 2018 – 2023 47
FIG NO. 10. Global Jigsaw Puzzle Market Price, By Material, 2018 – 2023 48
FIG NO. 11. Raw Materials Price Trend Analysis, 2018 – 2023 49
FIG NO. 12. Manufacturing Cost Analysis 50
FIG NO. 13. Manufacturing Process 50
FIG NO. 14. Company Share Analysis, 2023 51
FIG NO. 15. Company Share Analysis, 2023 51
FIG NO. 16. Company Share Analysis, 2023 52
FIG NO. 17. Company Share Analysis, 2023 52
FIG NO. 18. Jigsaw Puzzle Market – Company Volume Market Share, 2023 53
FIG NO. 19. Jigsaw Puzzle Market – Company Revenue Market Share, 2023 54
FIG NO. 20. Jigsaw Puzzle Market Volume Share, By Material, 2023 & 2032 60
FIG NO. 21. Jigsaw Puzzle Market Revenue Share, By Material, 2023 & 2032 60
FIG NO. 22. Market Attractiveness Analysis, By Material 61
FIG NO. 23. Incremental Revenue Growth Opportunity by Material, 2024 – 2032 61
FIG NO. 24. Jigsaw Puzzle Market Revenue, By Material, 2018, 2023, 2027 & 2032 62
FIG NO. 25. Global Jigsaw Puzzle Market for Wood Materials, Volume & Revenue (K Units) (USD Million) 2018 – 2032 63
FIG NO. 26. Global Jigsaw Puzzle Market for Plastic Materials, Volume & Revenue (K Units) (USD Million) 2018 – 2032 65
FIG NO. 27. Global Jigsaw Puzzle Market for Paper Materials, Volume & Revenue (K Units) (USD Million) 2018 – 2032 67
FIG NO. 28. Jigsaw Puzzle Market Volume Share, By Application, 2023 & 2032 70
FIG NO. 29. Jigsaw Puzzle Market Revenue Share, By Application, 2023 & 2032 70
FIG NO. 30. Market Attractiveness Analysis, By Application 71
FIG NO. 31. Incremental Revenue Growth Opportunity by Application, 2024 – 2032 71
FIG NO. 32. Jigsaw Puzzle Market Revenue, By Application, 2018, 2023, 2027 & 2032 72
FIG NO. 33. Global Jigsaw Puzzle Market for Children, Volume & Revenue (K Units) (USD Million) 2018 – 2032 73
FIG NO. 34. Global Jigsaw Puzzle Market for Adults, Volume & Revenue (K Units) (USD Million) 2018 – 2032 75
FIG NO. 35. Jigsaw Puzzle Market Volume Share, By Distribution Channel, 2023 & 2032 78
FIG NO. 36. Jigsaw Puzzle Market Revenue Share, By Distribution Channel, 2023 & 2032 78
FIG NO. 37. Market Attractiveness Analysis, By Distribution Channel 79
FIG NO. 38. Incremental Revenue Growth Opportunity by Distribution Channel, 2024 – 2032 79
FIG NO. 39. Jigsaw Puzzle Market Revenue, By Distribution Channel, 2018, 2023, 2027 & 2032 80
FIG NO. 40. Global Jigsaw Puzzle Market for Sports & Recreational Stores, Volume & Revenue (K Units) (USD Million) 2018 – 2032 81
FIG NO. 41. Global Jigsaw Puzzle Market for Online Retailers, Volume & Revenue (K Units) (USD Million) 2018 – 2032 83
FIG NO. 42. Global Jigsaw Puzzle Market for Specialty Stores, Volume & Revenue (K Units) (USD Million) 2018 – 2032 85
FIG NO. 43. Global Jigsaw Puzzle Market for Supermarkets/ Hypermarkets, Volume & Revenue (K Units) (USD Million) 2018 – 2032 87
FIG NO. 44. Global Jigsaw Puzzle Market for Others, Volume & Revenue (K Units) (USD Million) 2018 – 2032 89
FIG NO. 45. Global Jigsaw Puzzle Market Volume Share, By Region, 2023 & 2032 92
FIG NO. 46. Global Jigsaw Puzzle Market Revenue Share, By Region, 2023 & 2032 92
FIG NO. 47. Market Attractiveness Analysis, By Region 93
FIG NO. 48. Incremental Revenue Growth Opportunity by Region, 2024 – 2032 93
FIG NO. 49. Jigsaw Puzzle Market Revenue, By Region, 2018, 2023, 2027 & 2032 94
FIG NO. 50. North America Jigsaw Puzzle Market Volume & Revenue, 2018 – 2032 (K Units) (USD Million) 99
FIG NO. 51. Europe Jigsaw Puzzle Market Volume & Revenue, 2018 – 2023 (K Units) (USD Million) 109
FIG NO. 52. Asia Pacific Jigsaw Puzzle Market Volume & Revenue, 2018 – 2023 (K Units) (USD Million) 119
FIG NO. 53. Latin America Jigsaw Puzzle Market Volume & Revenue, 2018 – 2023 (K Units) (USD Million) 129
FIG NO. 54. The Middle-East Jigsaw Puzzle Market Volume & Revenue, 2018 – 2023 (K Units) (USD Million) 139
FIG NO. 55. Africa Jigsaw Puzzle Market Volume & Revenue, 2018 – 2023 (K Units) (USD Million) 149
FIG NO. 56. Research Methodology – Detailed View 162
FIG NO. 57. Research Methodology 163
List of Tables
TABLE NO. 1. : Global Jigsaw Puzzle Market: Snapshot 29
TABLE NO. 2. : Drivers for the Jigsaw Puzzle Market: Impact Analysis 34
TABLE NO. 3. : Restraints for the Jigsaw Puzzle Market: Impact Analysis 36
TABLE NO. 4. : Global Jigsaw Puzzle Market Volume & Revenue, By Region, 2018 – 2023 (K Units) 45
TABLE NO. 5. : Global Jigsaw Puzzle Market Volume & Revenue, By Region, 2018 – 2023 46
TABLE NO. 6. : Global Jigsaw Puzzle Market Volume & Revenue, By Material, 2018 – 2023 47
TABLE NO. 7. : Key Raw Materials & Suppliers 48
TABLE NO. 8. : Global Wood Materials Jigsaw Puzzle Market Volume & Revenue, By Region, 2018 – 2023 (K Units) (USD Million) 63
TABLE NO. 9. : Global Wood Materials Jigsaw Puzzle Market Volume & Revenue, By Region, 2024 – 2032 (K Units) (USD Million) 63
TABLE NO. 10. : Global Plastic Materials Jigsaw Puzzle Market Volume & Revenue, By Region, 2018 – 2023 (K Units) (USD Million) 65
TABLE NO. 11. : Global Plastic Materials Jigsaw Puzzle Market Volume & Revenue, By Region, 2024 – 2032 (K Units) (USD Million) 65
TABLE NO. 12. : Global Paper Materials Jigsaw Puzzle Market Volume & Revenue, By Region, 2018 – 2023 (K Units) (USD Million) 67
TABLE NO. 13. : Global Paper Materials Jigsaw Puzzle Market Volume & Revenue, By Region, 2024 – 2032 (K Units) (USD Million) 67
TABLE NO. 14. : Global Children Jigsaw Puzzle Market Volume & Revenue, By Region, 2018 – 2023 (K Units) (USD Million) 73
TABLE NO. 15. : Global Children Jigsaw Puzzle Market Volume & Revenue, By Region, 2024 – 2032 (K Units) (USD Million) 73
TABLE NO. 16. : Global Adults Jigsaw Puzzle Market Volume & Revenue, By Region, 2018 – 2023 (K Units) (USD Million) 75
TABLE NO. 17. : Global Adults Jigsaw Puzzle Market Volume & Revenue, By Region, 2024 – 2032 (K Units) (USD Million) 75
TABLE NO. 18. : Global Sports & Recreational Stores Jigsaw Puzzle Market Volume & Revenue, By Region, 2018 – 2023 (K Units) (USD Million) 81
TABLE NO. 19. : Global Sports & Recreational Stores Jigsaw Puzzle Market Volume & Revenue, By Region, 2024 – 2032 (K Units) (USD Million) 81
TABLE NO. 20. : Global Online Retailers Jigsaw Puzzle Market Volume & Revenue, By Region, 2018 – 2023 (K Units) (USD Million) 83
TABLE NO. 21. : Global Online Retailers Jigsaw Puzzle Market Volume & Revenue, By Region, 2024 – 2032 (K Units) (USD Million) 83
TABLE NO. 22. : Global Specialty Stores Jigsaw Puzzle Market Volume & Revenue, By Region, 2018 – 2023 (K Units) (USD Million) 85
TABLE NO. 23. : Global Specialty Stores Jigsaw Puzzle Market Volume & Revenue, By Region, 2024 – 2032 (K Units) (USD Million) 85
TABLE NO. 24. : Global Supermarkets/ Hypermarkets Jigsaw Puzzle Market Volume & Revenue, By Region, 2018 – 2023 (K Units) (USD Million) 87
TABLE NO. 25. : Global Supermarkets/ Hypermarkets Jigsaw Puzzle Market Volume & Revenue, By Region, 2024 – 2032 (K Units) (USD Million) 87
TABLE NO. 26. : Global Others Jigsaw Puzzle Market Volume & Revenue, By Region, 2018 – 2023 (K Units) (USD Million) 89
TABLE NO. 27. : Global Others Jigsaw Puzzle Market Volume & Revenue, By Region, 2024 – 2032 (K Units) (USD Million) 89
TABLE NO. 28. : Global Jigsaw Puzzle Market Volume & Revenue, By Region, 2018 – 2023 (K Units) (USD Million) 94
TABLE NO. 29. : Global Jigsaw Puzzle Market Volume & Revenue, By Region, 2024 – 2032 (K Units) (USD Million) 94
TABLE NO. 30. : Global Jigsaw Puzzle Market Volume & Revenue, By Material, 2018 – 2023 (K Units) (USD Million) 95
TABLE NO. 31. : Global Jigsaw Puzzle Market Volume & Revenue, By Material, 2024 – 2032 (K Units) (USD Million) 95
TABLE NO. 32. : Global Jigsaw Puzzle Market Volume & Revenue, By Application, 2018 – 2023 (K Units) (USD Million) 96
TABLE NO. 33. : Global Jigsaw Puzzle Market Volume & Revenue, By Application, 2024 – 2032 (K Units) (USD Million) 96
TABLE NO. 34. : Global Jigsaw Puzzle Market Volume & Revenue, By Distribution Channel, 2018 – 2023 (K Units) (USD Million) 97
TABLE NO. 35. : Global Jigsaw Puzzle Market Volume & Revenue, By Distribution Channel, 2024 – 2032 (K Units) (USD Million) 97
TABLE NO. 36. : North America Jigsaw Puzzle Market Volume, By Country, 2018 – 2023 (K Units) 99
TABLE NO. 37. : North America Jigsaw Puzzle Market Volume, By Country, 2024 – 2032 (K Units) 99
TABLE NO. 38. : North America Jigsaw Puzzle Market Revenue, By Country, 2018 – 2023 (USD Million) 100
TABLE NO. 39. : North America Jigsaw Puzzle Market Revenue, By Country, 2024 – 2032 (USD Million) 100
TABLE NO. 40. : North America Jigsaw Puzzle Market Volume, By Material, 2018 – 2023 (K Units) 101
TABLE NO. 41. : North America Jigsaw Puzzle Market Volume, By Material, 2024 – 2032 (K Units) 101
TABLE NO. 42. : North America Jigsaw Puzzle Market Revenue, By Material, 2018 – 2023 (USD Million) 102
TABLE NO. 43. : North America Jigsaw Puzzle Market Revenue, By Material, 2024 – 2032 (USD Million) 102
TABLE NO. 44. : North America Jigsaw Puzzle Market Volume, By Application, 2018 – 2023 (K Units) 103
TABLE NO. 45. : North America Jigsaw Puzzle Market Volume, By Application, 2024 – 2032 (K Units) 103
TABLE NO. 46. : North America Jigsaw Puzzle Market Revenue, By Application, 2018 – 2023 (USD Million) 104
TABLE NO. 47. : North America Jigsaw Puzzle Market Revenue, By Application, 2024 – 2032 (USD Million) 104
TABLE NO. 48. : North America Jigsaw Puzzle Market Volume, By Distribution Channel, 2018 – 2023 (K Units) 105
TABLE NO. 49. : North America Jigsaw Puzzle Market Volume, By Distribution Channel, 2024 – 2032 (K Units) 105
TABLE NO. 50. : North America Jigsaw Puzzle Market Revenue, By Distribution Channel, 2018 – 2023 (USD Million) 106
TABLE NO. 51. : North America Jigsaw Puzzle Market Revenue, By Distribution Channel, 2024 – 2032 (USD Million) 106
TABLE NO. 52. : Europe Jigsaw Puzzle Market Volume, By Country, 2018 – 2023 (K Units) 109
TABLE NO. 53. : Europe Jigsaw Puzzle Market Volume, By Country, 2024 – 2032 (K Units) 109
TABLE NO. 54. : Europe Jigsaw Puzzle Market Revenue, By Country, 2018 – 2023 (USD Million) 110
TABLE NO. 55. : Europe Jigsaw Puzzle Market Revenue, By Country, 2024 – 2032 (USD Million) 110
TABLE NO. 56. : Europe Jigsaw Puzzle Market Volume, By Material, 2018 – 2023 (K Units) 111
TABLE NO. 57. : Europe Jigsaw Puzzle Market Volume, By Material, 2024 – 2032 (K Units) 111
TABLE NO. 58. : Europe Jigsaw Puzzle Market Revenue, By Material, 2018 – 2023 (USD Million) 112
TABLE NO. 59. : Europe Jigsaw Puzzle Market Revenue, By Material, 2024 – 2032 (USD Million) 112
TABLE NO. 60. : Europe Jigsaw Puzzle Market Volume, By Application, 2018 – 2023 (K Units) 113
TABLE NO. 61. : Europe Jigsaw Puzzle Market Volume, By Application, 2024 – 2032 (K Units) 113
TABLE NO. 62. : Europe Jigsaw Puzzle Market Revenue, By Application, 2018 – 2023 (USD Million) 114
TABLE NO. 63. : Europe Jigsaw Puzzle Market Revenue, By Application, 2024 – 2032 (USD Million) 114
TABLE NO. 64. : Europe Jigsaw Puzzle Market Volume, By Distribution Channel, 2018 – 2023 (K Units) 115
TABLE NO. 65. : Europe Jigsaw Puzzle Market Volume, By Distribution Channel, 2024 – 2032 (K Units) 115
TABLE NO. 66. : Europe Jigsaw Puzzle Market Revenue, By Distribution Channel, 2018 – 2023 (USD Million) 116
TABLE NO. 67. : Europe Jigsaw Puzzle Market Revenue, By Distribution Channel, 2024 – 2032 (USD Million) 116
TABLE NO. 68. : Asia Pacific Jigsaw Puzzle Market Volume, By Country, 2018 – 2023 (K Units) 119
TABLE NO. 69. : Asia Pacific Jigsaw Puzzle Market Volume, By Country, 2024 – 2032 (K Units) 119
TABLE NO. 70. : Asia Pacific Jigsaw Puzzle Market Revenue, By Country, 2018 – 2023 (USD Million) 120
TABLE NO. 71. : Asia Pacific Jigsaw Puzzle Market Revenue, By Country, 2024 – 2032 (USD Million) 120
TABLE NO. 72. : Asia Pacific Jigsaw Puzzle Market Volume, By Material, 2018 – 2023 (K Units) 121
TABLE NO. 73. : Asia Pacific Jigsaw Puzzle Market Volume, By Material, 2024 – 2032 (K Units) 121
TABLE NO. 74. : Asia Pacific Jigsaw Puzzle Market Revenue, By Material, 2018 – 2023 (USD Million) 122
TABLE NO. 75. : Asia Pacific Jigsaw Puzzle Market Revenue, By Material, 2024 – 2032 (USD Million) 122
TABLE NO. 76. : Asia Pacific Jigsaw Puzzle Market Volume, By Application, 2018 – 2023 (K Units) 123
TABLE NO. 77. : Asia Pacific Jigsaw Puzzle Market Volume, By Application, 2024 – 2032 (K Units) 123
TABLE NO. 78. : Asia Pacific Jigsaw Puzzle Market Revenue, By Application, 2018 – 2023 (USD Million) 124
TABLE NO. 79. : Asia Pacific Jigsaw Puzzle Market Revenue, By Application, 2024 – 2032 (USD Million) 124
TABLE NO. 80. : Asia Pacific Jigsaw Puzzle Market Volume, By Distribution Channel, 2018 – 2023 (K Units) 125
TABLE NO. 81. : Asia Pacific Jigsaw Puzzle Market Volume, By Distribution Channel, 2024 – 2032 (K Units) 125
TABLE NO. 82. : Asia Pacific Jigsaw Puzzle Market Revenue, By Distribution Channel, 2018 – 2023 (USD Million) 126
TABLE NO. 83. : Asia Pacific Jigsaw Puzzle Market Revenue, By Distribution Channel, 2024 – 2032 (USD Million) 126
TABLE NO. 84. : Latin America Jigsaw Puzzle Market Volume, By Country, 2018 – 2023 (K Units) 129
TABLE NO. 85. : Latin America Jigsaw Puzzle Market Volume, By Country, 2024 – 2032 (K Units) 129
TABLE NO. 86. : Latin America Jigsaw Puzzle Market Revenue, By Country, 2018 – 2023 (USD Million) 130
TABLE NO. 87. : Latin America Jigsaw Puzzle Market Revenue, By Country, 2024 – 2032 (USD Million) 130
TABLE NO. 88. : Latin America Jigsaw Puzzle Market Volume, By Material, 2018 – 2023 (K Units) 131
TABLE NO. 89. : Latin America Jigsaw Puzzle Market Volume, By Material, 2024 – 2032 (K Units) 131
TABLE NO. 90. : Latin America Jigsaw Puzzle Market Revenue, By Material, 2018 – 2023 (USD Million) 132
TABLE NO. 91. : Latin America Jigsaw Puzzle Market Revenue, By Material, 2024 – 2032 (USD Million) 132
TABLE NO. 92. : Latin America Jigsaw Puzzle Market Volume, By Application, 2018 – 2023 (K Units) 133
TABLE NO. 93. : Latin America Jigsaw Puzzle Market Volume, By Application, 2024 – 2032 (K Units) 133
TABLE NO. 94. : Latin America Jigsaw Puzzle Market Revenue, By Application, 2018 – 2023 (USD Million) 134
TABLE NO. 95. : Latin America Jigsaw Puzzle Market Revenue, By Application, 2024 – 2032 (USD Million) 134
TABLE NO. 96. : Latin America Jigsaw Puzzle Market Volume, By Distribution Channel, 2018 – 2023 (K Units) 135
TABLE NO. 97. : Latin America Jigsaw Puzzle Market Volume, By Distribution Channel, 2024 – 2032 (K Units) 135
TABLE NO. 98. : Latin America Jigsaw Puzzle Market Revenue, By Distribution Channel, 2018 – 2023 (USD Million) 136
TABLE NO. 99. : Latin America Jigsaw Puzzle Market Revenue, By Distribution Channel, 2024 – 2032 (USD Million) 136
TABLE NO. 100. : Middle East Jigsaw Puzzle Market Volume, By Country, 2018 – 2023 (K Units) 139
TABLE NO. 101. : Middle East Jigsaw Puzzle Market Volume, By Country, 2024 – 2032 (K Units) 139
TABLE NO. 102. : Middle East Jigsaw Puzzle Market Revenue, By Country, 2018 – 2023 (USD Million) 140
TABLE NO. 103. : Middle East Jigsaw Puzzle Market Revenue, By Country, 2024 – 2032 (USD Million) 140
TABLE NO. 104. : Middle East Jigsaw Puzzle Market Volume, By Material, 2018 – 2023 (K Units) 141
TABLE NO. 105. : Middle East Jigsaw Puzzle Market Volume, By Material, 2024 – 2032 (K Units) 141
TABLE NO. 106. : Middle East Jigsaw Puzzle Market Revenue, By Material, 2018 – 2023 (USD Million) 142
TABLE NO. 107. : Middle East Jigsaw Puzzle Market Revenue, By Material, 2024 – 2032 (USD Million) 142
TABLE NO. 108. : Middle East Jigsaw Puzzle Market Volume, By Application, 2018 – 2023 (K Units) 143
TABLE NO. 109. : Middle East Jigsaw Puzzle Market Volume, By Application, 2024 – 2032 (K Units) 143
TABLE NO. 110. : Middle East Jigsaw Puzzle Market Revenue, By Application, 2018 – 2023 (USD Million) 144
TABLE NO. 111. : Middle East Jigsaw Puzzle Market Revenue, By Application, 2024 – 2032 (USD Million) 144
TABLE NO. 112. : Middle East Jigsaw Puzzle Market Volume, By Distribution Channel, 2018 – 2023 (K Units) 145
TABLE NO. 113. : Middle East Jigsaw Puzzle Market Volume, By Distribution Channel, 2024 – 2032 (K Units) 145
TABLE NO. 114. : Middle East Jigsaw Puzzle Market Revenue, By Distribution Channel, 2018 – 2023 (USD Million) 146
TABLE NO. 115. : Middle East Jigsaw Puzzle Market Revenue, By Distribution Channel, 2024 – 2032 (USD Million) 146
TABLE NO. 116. : Africa Jigsaw Puzzle Market Volume, By Country, 2018 – 2023 (K Units) 149
TABLE NO. 117. : Africa Jigsaw Puzzle Market Volume, By Country, 2024 – 2032 (K Units) 149
TABLE NO. 118. : Africa Jigsaw Puzzle Market Revenue, By Country, 2018 – 2023 (USD Million) 150
TABLE NO. 119. : Africa Jigsaw Puzzle Market Revenue, By Country, 2024 – 2032 (USD Million) 150
TABLE NO. 120. : Africa Jigsaw Puzzle Market Volume, By Material, 2018 – 2023 (K Units) 151
TABLE NO. 121. : Africa Jigsaw Puzzle Market Volume, By Material, 2024 – 2032 (K Units) 151
TABLE NO. 122. : Africa Jigsaw Puzzle Market Revenue, By Material, 2018 – 2023 (USD Million) 152
TABLE NO. 123. : Africa Jigsaw Puzzle Market Revenue, By Material, 2024 – 2032 (USD Million) 152
TABLE NO. 124. : Africa Jigsaw Puzzle Market Volume, By Application, 2018 – 2023 (K Units) 153
TABLE NO. 125. : Africa Jigsaw Puzzle Market Volume, By Application, 2024 – 2032 (K Units) 153
TABLE NO. 126. : Africa Jigsaw Puzzle Market Revenue, By Application, 2018 – 2023 (USD Million) 154
TABLE NO. 127. : Africa Jigsaw Puzzle Market Revenue, By Application, 2024 – 2032 (USD Million) 154
TABLE NO. 128. : Africa Jigsaw Puzzle Market Volume, By Distribution Channel, 2018 – 2023 (K Units) 155
TABLE NO. 129. : Africa Jigsaw Puzzle Market Volume, By Distribution Channel, 2024 – 2032 (K Units) 155
TABLE NO. 130. : Africa Jigsaw Puzzle Market Revenue, By Distribution Channel, 2018 – 2023 (USD Million) 156
TABLE NO. 131. : Africa Jigsaw Puzzle Market Revenue, By Distribution Channel, 2024 – 2032 (USD Million) 156